


Presenting structured data through tables is one of the best options in PowerPoint. You can use this simple table function to represent data for financial statistics, timeline schematics, comparative datasets, and more.
However, learning to create, arrange, and enhance the physical appearance of the table can be a bit tricky, especially if you’re new to the tool. This article gives you five easy methods to create a table and improve slide appearance without sacrificing either clarity or structure in a presentation.
In this article
Method 1: Insert a Table In PowerPoint
The built-in table tool represents the primary method for inserting tables in a PowerPoint slide.
Step 1
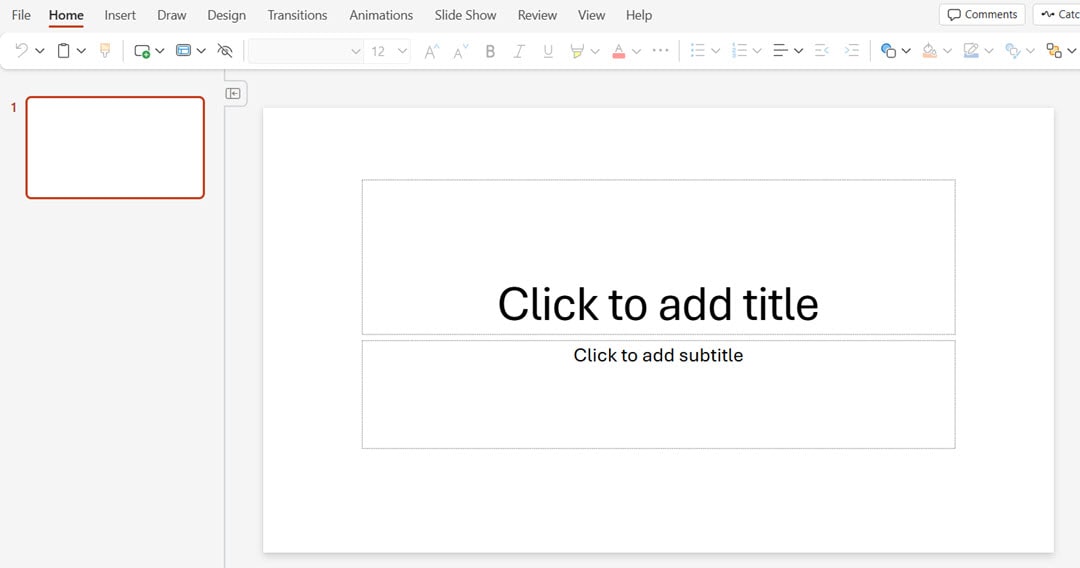
Open the PowerPoint application and add a New slide.
Step 2
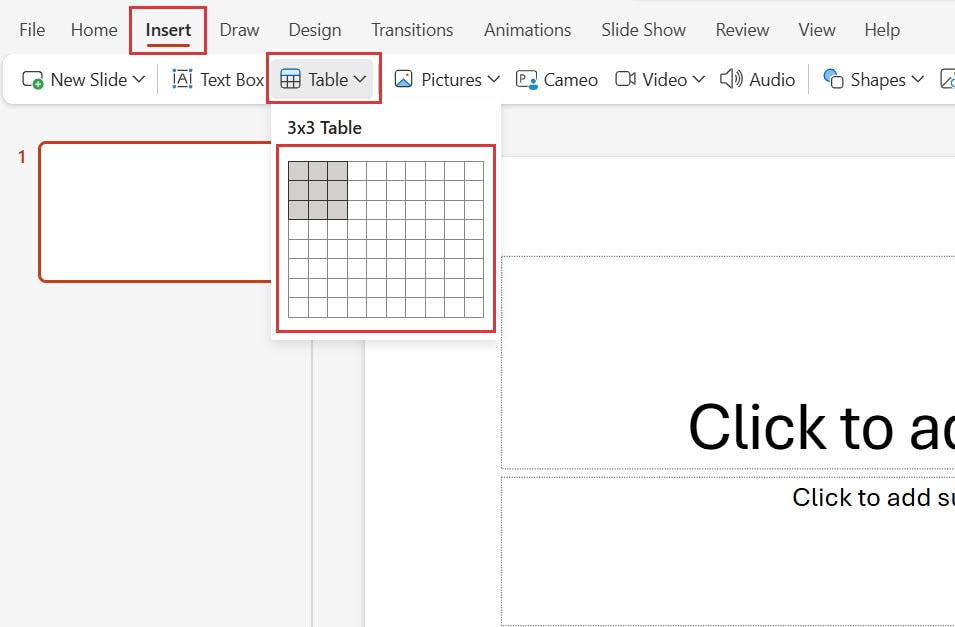
Click the Insert option on the top panel and select Table. Choose the number of rows and columns you want to add from the grid.
Step 3
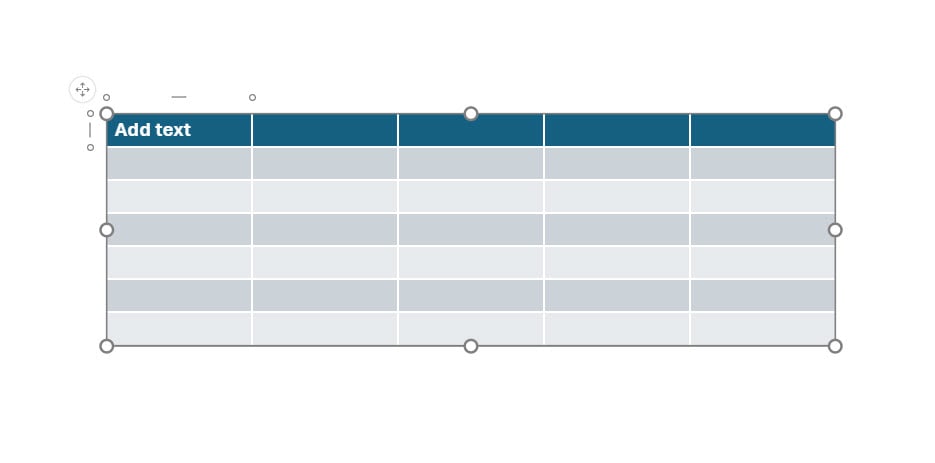
This adds the table directly on the slide. To add text to the table, use the click button and add the content.
Step 4
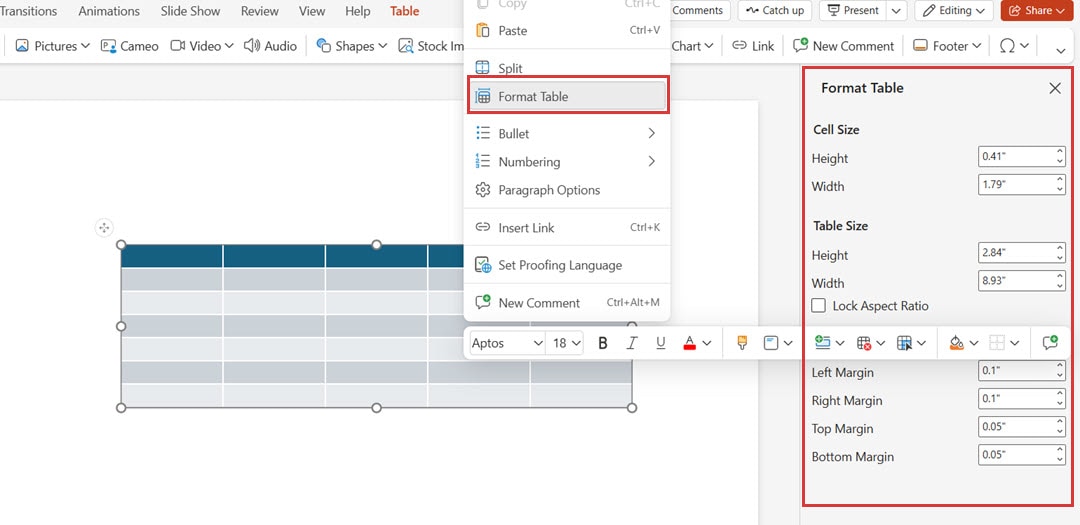
You can resize the table through corner click-and-drag operations or right-click on the table and select the format table. Make changes to the table by adding values to the options in the right panel.
Method 2: Copy and Paste a Table from Word to PowerPoint
Let’s say you already have a table created in Microsoft Word and don’t want to spend additional time creating a new table in PowerPoint. To avoid the hassle, you can simply copy this table and paste it into your slides.
However, while copy-pasting, the table dimensions can become distorted, and you might have to redo all the formatting. But these steps can help you with a quick copy and paste without having to spend any additional time reformatting or updating the table:
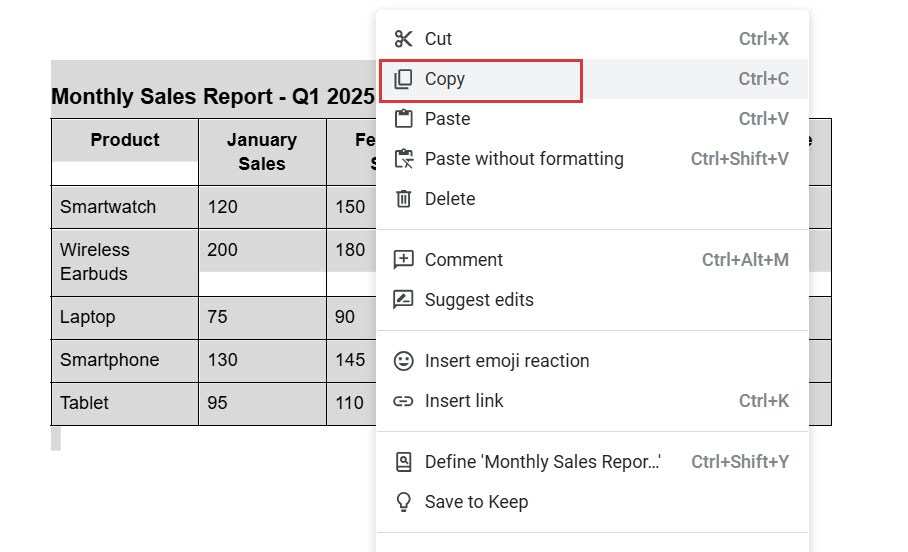
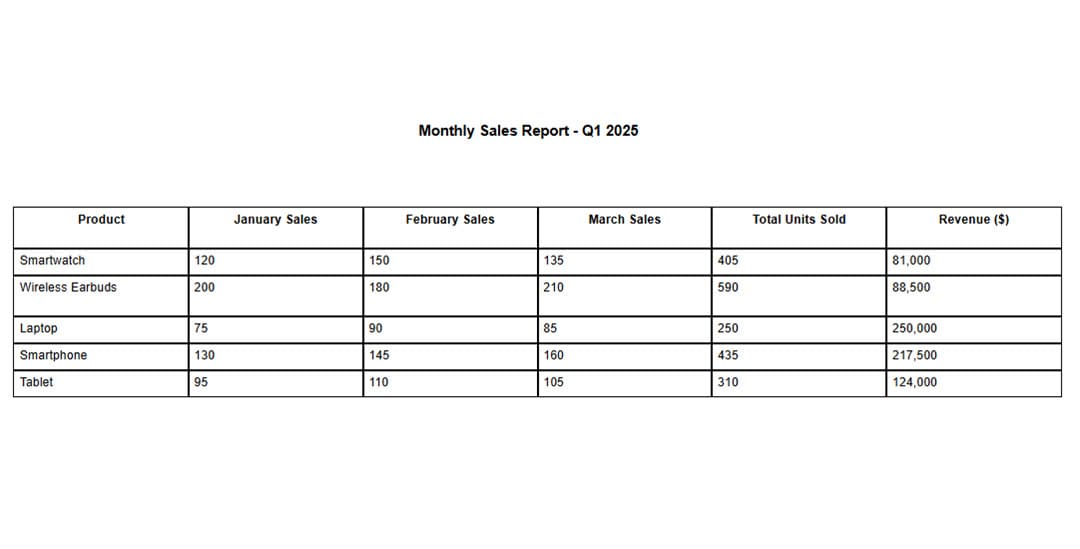
Step 1
Open the Word doc and copy the table you created. You can select the whole table by clicking inside its frame and then using the Ctrl + A keyboard.
Step 2
Next, open the PowerPoint slide where you want to add this table, and press Ctrl+V. This keeps the formatting and adds the table to your slide.
Step 3
To add more crispness to your diagram, you can update the layout, theme, or color by using the floating toolbar or the options panel on the top.
Method 3: Copy and Paste Cells from Excel to PowerPoint
The spreadsheet application Excel functions ideally for numerical data and mathematical calculations. PowerPoint allows you to paste Excel cells, keeping their formatting structure intact.
Step 1
Open the Excel sheet where you have added the numeric values.
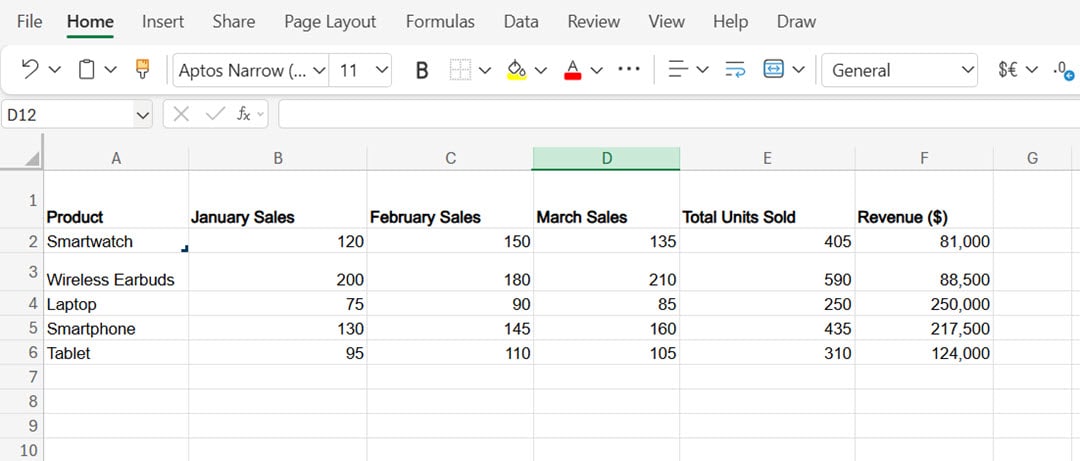
Step 2
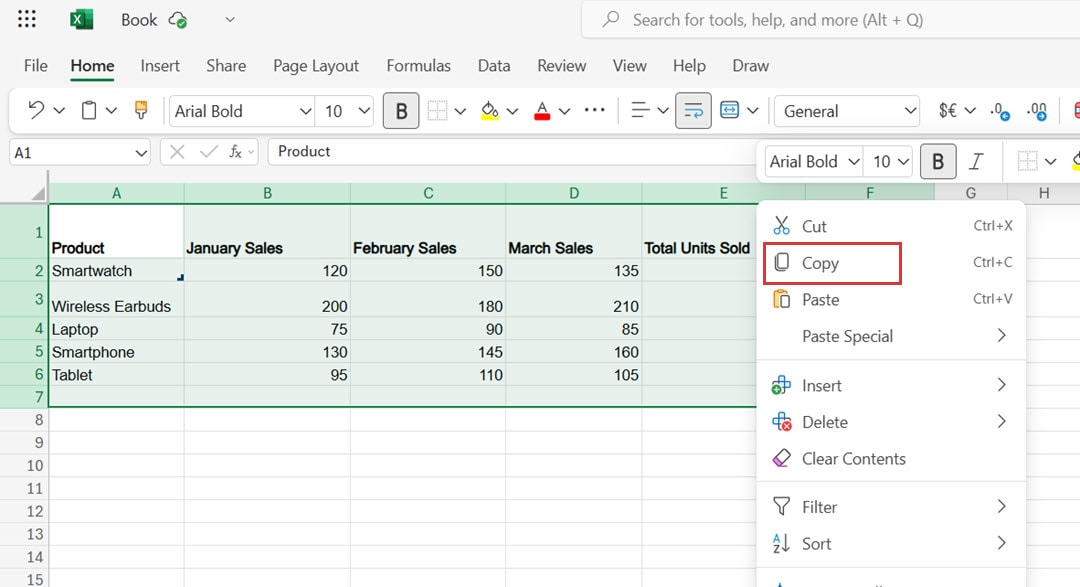
Select the specific range of cells for the copy operation and press Ctrl + C (Cmd + C for Mac users). Or you can right-click the cells and press Copy.
Step 3
Head to the slide inside the PowerPoint presentation where you want to place your table. Press Ctrl+V (or Cmd+V) to perform the paste operation on the cells.

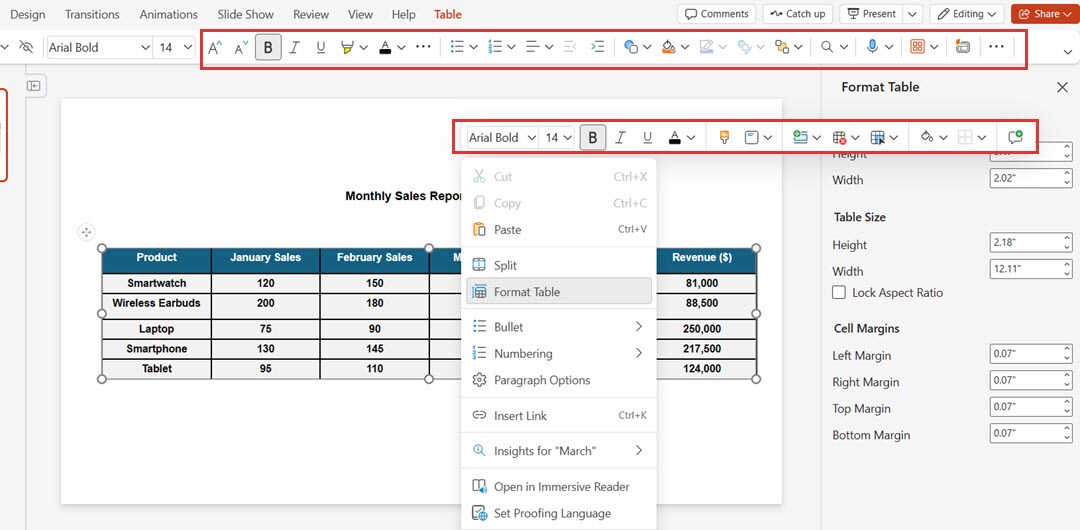
Step 4
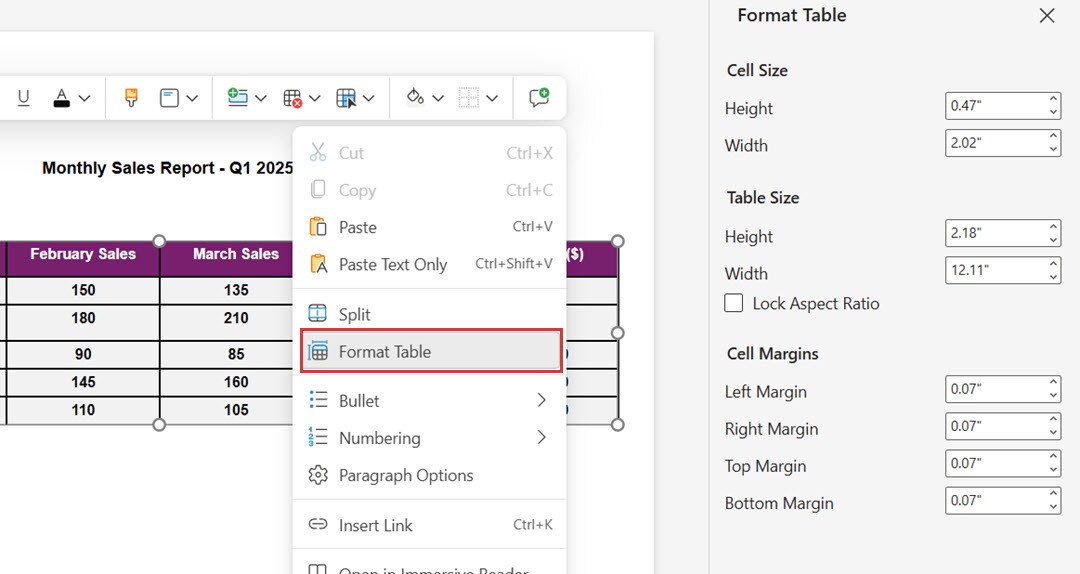
To edit or format your table, right-click on it and select any option from the floating bar. Then, click Format Table and update directly into the right panel.
Method 4: Add an Excel Sheet To PowerPoint
The amazing part of working with PowerPoint is that it allows you to convert your Excel sheet entirely into slides. The data you have been working on for weeks can simply be added to your slides, and you can present that to the stakeholders/leadership.
To do this:
Step 1
Within the PowerPoint, click Insert and select Table.
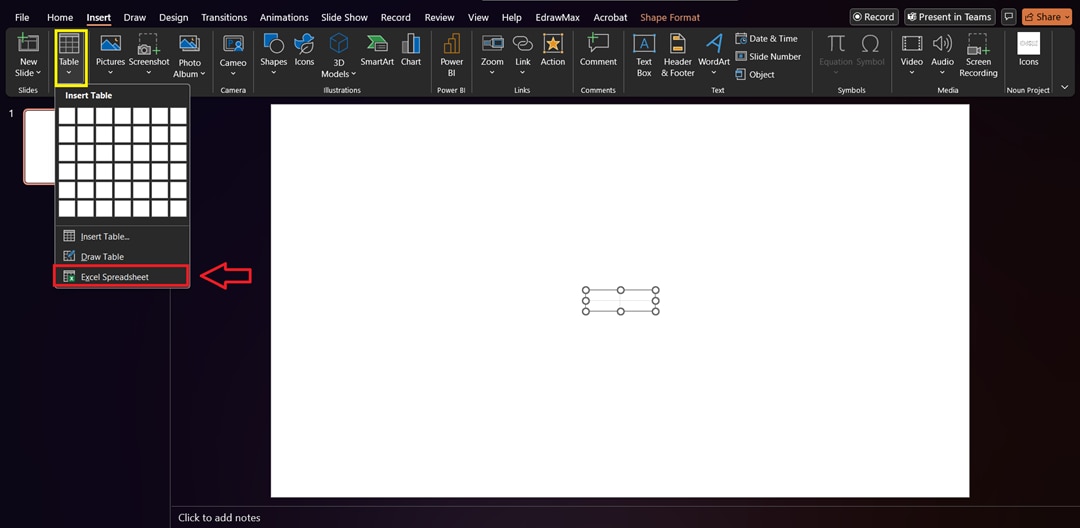
Step 2
Scroll to the bottom and pick the Excel Spreadsheet option. The new Excel interface will become part of your PowerPoint slide after insertion.
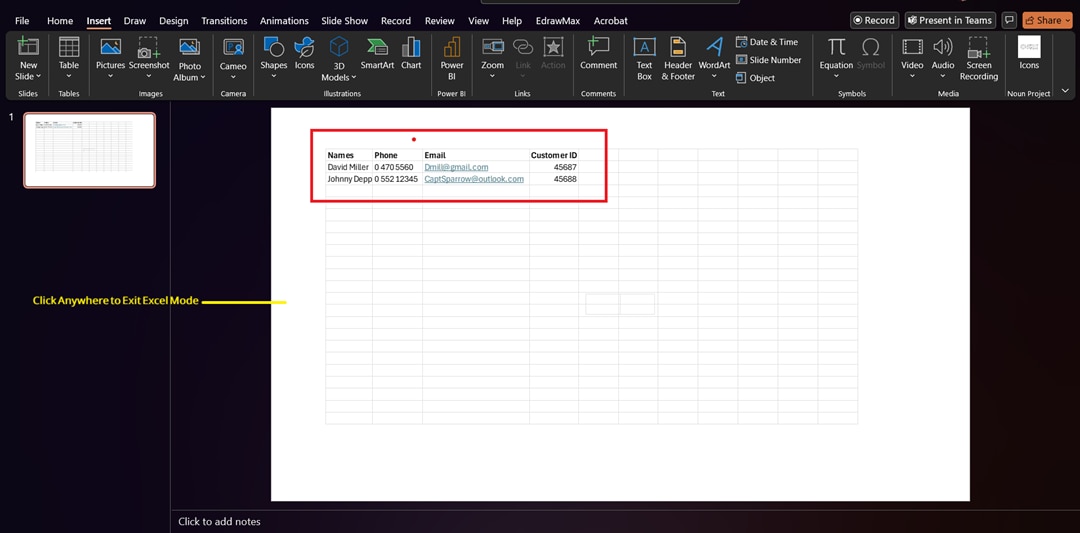
Step 3
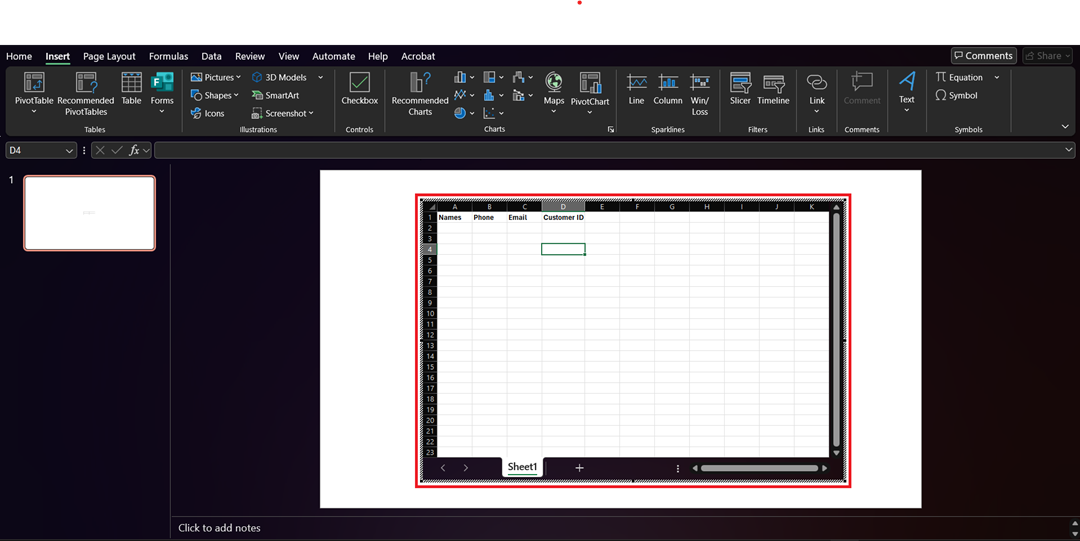
Insert data using a method similar to Excel spreadsheets. Leave the Excel area with a simple click to restore the PowerPoint view.
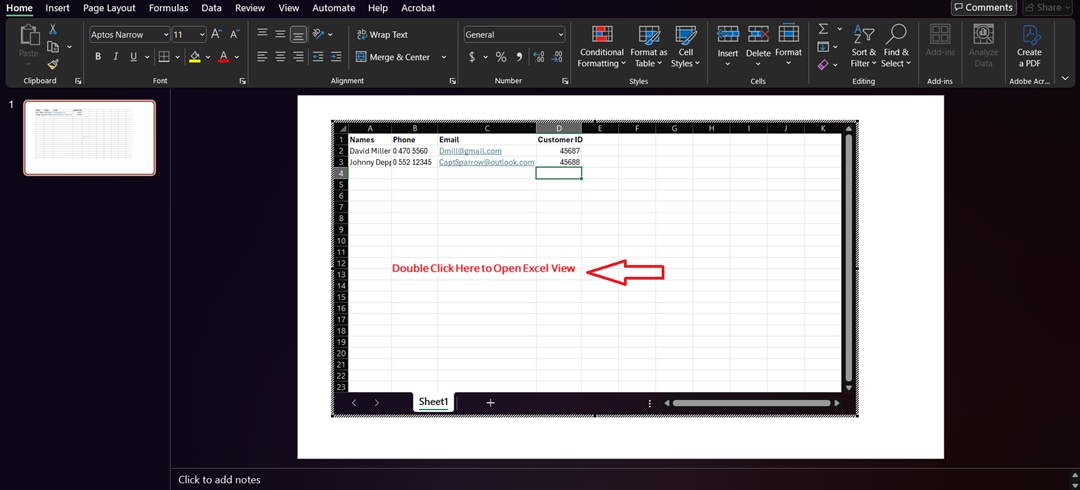
Step 4
To access Excel editing options later, double-click on the table to regain Excel mode functions.
Method 5: Create a table using PowerPoint Integration
The built-in tables in PowerPoint function effectively with general data entry, yet they become restrictive during project timeline management, dependency tracking, and intricate schedule monitoring. Users looking for advanced visualization capabilities should consider EdrawMax AI Table Maker. It is a diagramming tool that integrates with PowerPoint.
Step 1
Download EdrawMax to explore all diagramming options for free or buy the tool to benefit from advanced options. If you want to try the online version of the software, click Sign in and log in using your social media credentials, and click Start Diagramming Now.
Step 2
Once logged in, you can choose one of two ways to create a diagram in EdrawMax: from templates or from scratch. To save time, go with customizing the pre-built template according to your project requirements.
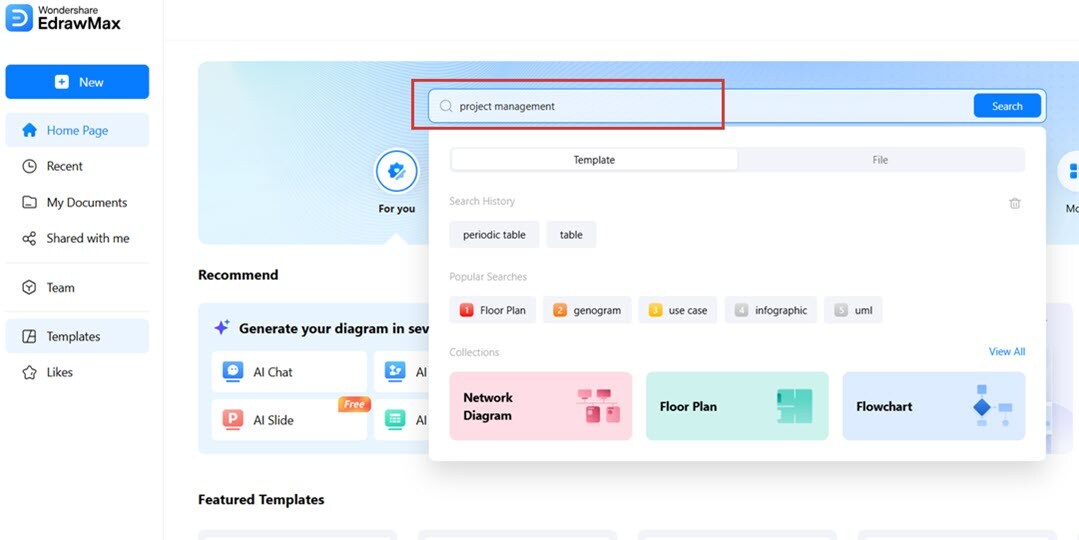
Step 3
To search for the template, type the name of the diagram in the search bar, and multiple template options will appear.
Step 4
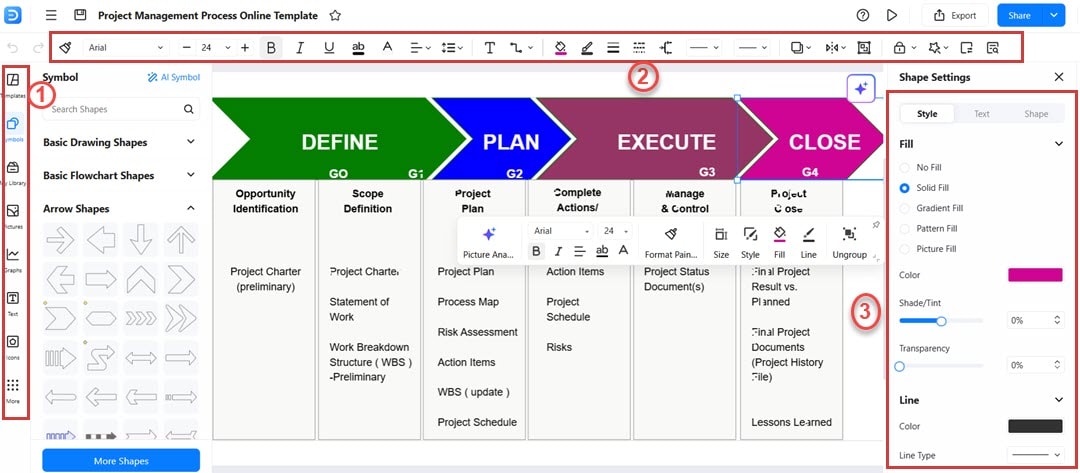
Choose from the available templates and start customizing the tables/diagrams. Add details for your project, update the theme, layout, font, and text style.
- To update the symbols, images, add pictures or change the template, use the options from the left panel.
- To customize the text, connector style, and text color, use the toolbar at the top.
- To change the theme, layout, and design, use the options from the right panel.
Step 5
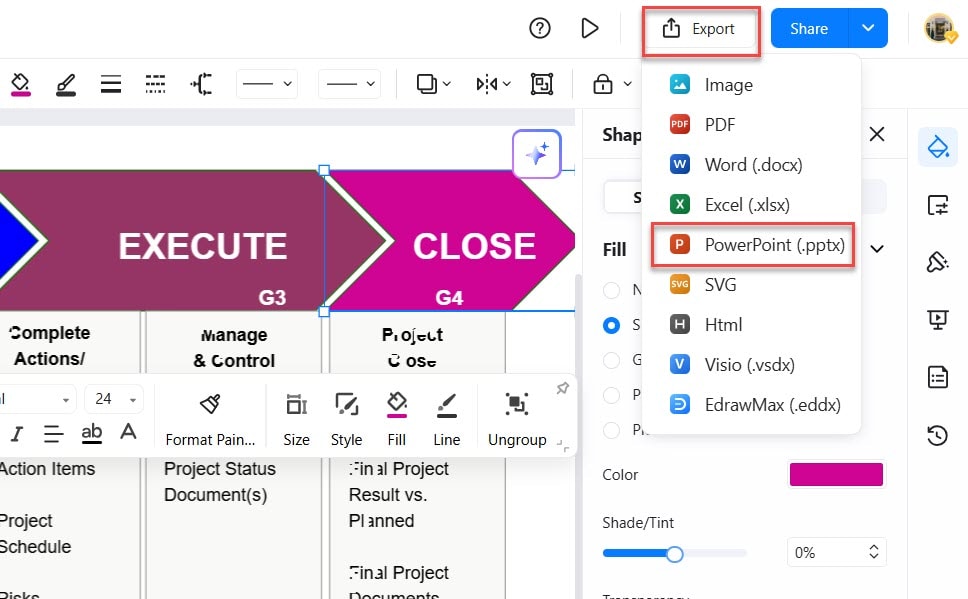
Once the diagram is complete, you can save and export it. EdrawMax allows you to export your created diagram in PowerPoint format so you can directly use it for your presentations. To use this feature, click Export and use PowerPoint (.pptx) from the available options.
Conclusion
Users can easily create tables through the built-in tools that the application provides. You can make effective data organization by selecting from multiple table insertion options in PowerPoint, which include newly constructed tables and Word or Excel copied tables, and Excel sheet embedding. For professional diagram needs, use EdrawMax, which maintains excellent visualization tools.
Tables are essential to presentations because they help create data clarity, producing better audience connections to information. Following the presented guidance enables users to build tables with a proper structure that matches their presentation format. Test these methods to make your slides more professional and impactful presentations.
AI Diagram Generator
Enter your prompt. Upload files if needed. Generate diagrams, charts, or slides instantly.


