




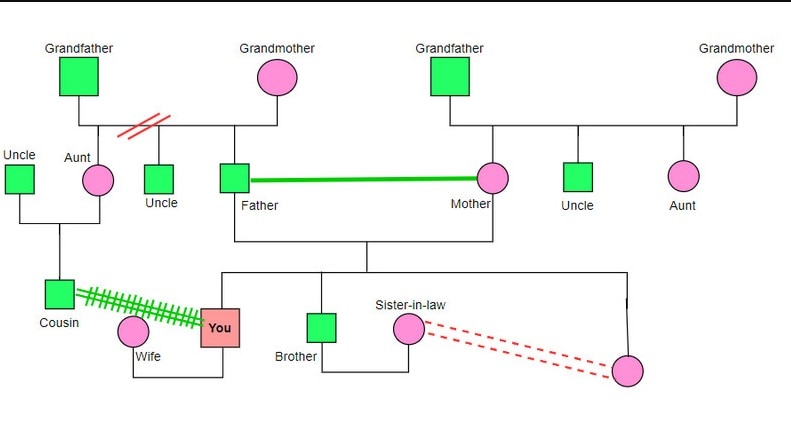
A genogram is a multigenerational family diagram that can combine genealogy with relationship, behavioral, and health-pattern information. When to use a genogram: choose a genogram when you need more than ancestry—such as relationships, recurring health information, emotional bonds, or patterns across generations. Use a basic family tree for genealogy alone; handle sensitive personal or health data according to the privacy requirements of the setting.
In this article
Part 1. Basics of Genogram Diagrams
Although genograms are family trees but are more formal and comprehensive than a typical family tree. They visualize the ancestry, lineage, and family links across many generations. The details presented in a genogram may include basic information. For example, it contains the names, birth dates, marriage status, medical disease, or psychological disorder. It also displays behavioral information like sexual orientation.
Components of a Genogram
A genogram usually comprises symbols, textual information, and generational patterns. The symbols signify various family members, including siblings, parents, or grandparents. Specific shapes denote genders, and lines link the family members to show relations.
Textual information may cover crucial details about each family member. Such details involve their names, birth and death dates, marriage status, etc. The lineage patterns decode the social or emotional dynamics across various generations. These lineage factors affect family links.
Part 2. How to Make a Genogram
How to Make a Genogram in General
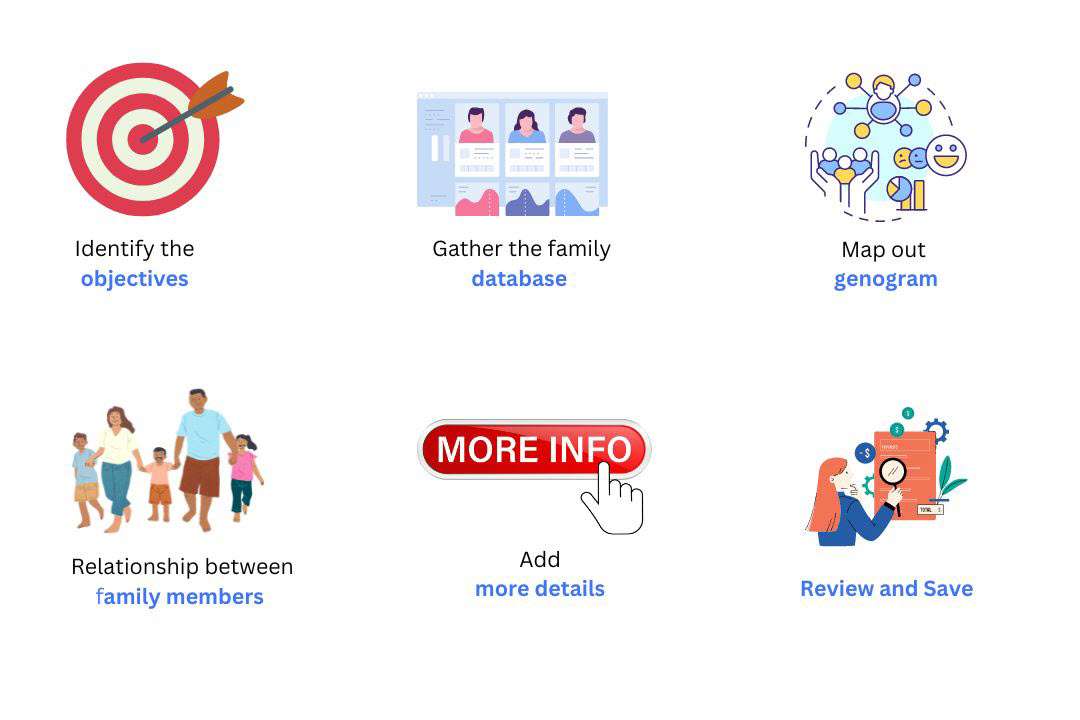
Step 1: Establish the Objective
Begin by stating the objective for creating a genogram. Are you investigating medical history-psychological or relational and social? This will assist in identifying the type of information that has to be compiled.
Step 2: Gather the Family’s Database
Collect secondary data related to family members, including their names, birth and death dates, the dating or marriage, divorces, if any. Also, include any mental or physical illness or abnormality in the family. As a rule, try to gather at least three generations, as it allows you to cover the general information.
Step 3: Genogram Drawing
Starting with the oldest generation at the top of the hierarchy, move on to the other generations. Draw circles around actual people, draw lines to show their relationships, and include some pertinent information.
Step 4: Relationship Between Family Members
Join the family members with lines and put the signs like ‘= ‘ for marriage, ‘// ‘ for divorce, ‘. . ‘ for cohabitation. These additional symbols should be included before the main symbols to express definite circumstances or conditions.
Step 5: Add Details
When drawing the symbols, use textual information, such as names and dates. This gives further understanding and meaning to its category in your genogram.
Step 6: Review & Save
Assess whether the elements in your genogram are accurate and comprehensive. You can export your genogram by clicking the export icon to choose your preferred format.
Method to Make a Genogram Online
EdrawMax is an all-in-one platform for constructing your genograms. The tool offers several built-in features to update your genogram creation. It has a ready-to-use symbols library of all types to create an inclusive family diagram.
Another aspect that EdrawMax surpasses is the availability of both the application and the online version. This feature lets you choose which medium you want to opt for a genogram.
Further, its drag-and-drop feature makes it super easy to portray your familial bonds. You can also enjoy its auto-adjustment option to align your shapes. The tool offers a massive template community to kick-start your genogram creation. Thus, you can avoid the starting-from-scratch issue.
Steps To Make a Family Genogram With EdrawMax
A manual genogram creation may take several hours. Yet, the intuitive user interface of EdrawMax simplifies the diagram creation process. The drag-and-drop option allows even a beginner user to craft intuitive genograms in a few minutes. Here is the detailed process on how to create a genogram online using EdrawMax:
Step1
Start by analyzing the scope of your intended genogram. Determine whether you are making it for medical, psychological, or social purposes.
Step2
Decide the lineage or number of generations you want to add to your genogram. For example, if you are making a genogram for medical diagnosis, you can select up to 3 or 4 generations.
Step3
Collect data about your family links. You can search for age, diseases, actions, bloodline, marriages, divorces, or other events.
Step4
The following step is to select a certified diagramming tool. Using EdrawMax, you can assemble your gathered information in visual form. Therefore, we will use EdrawMax Online to construct our genogram.
Step5
Sign up on EdrawMax Online to access its interface.
Step6
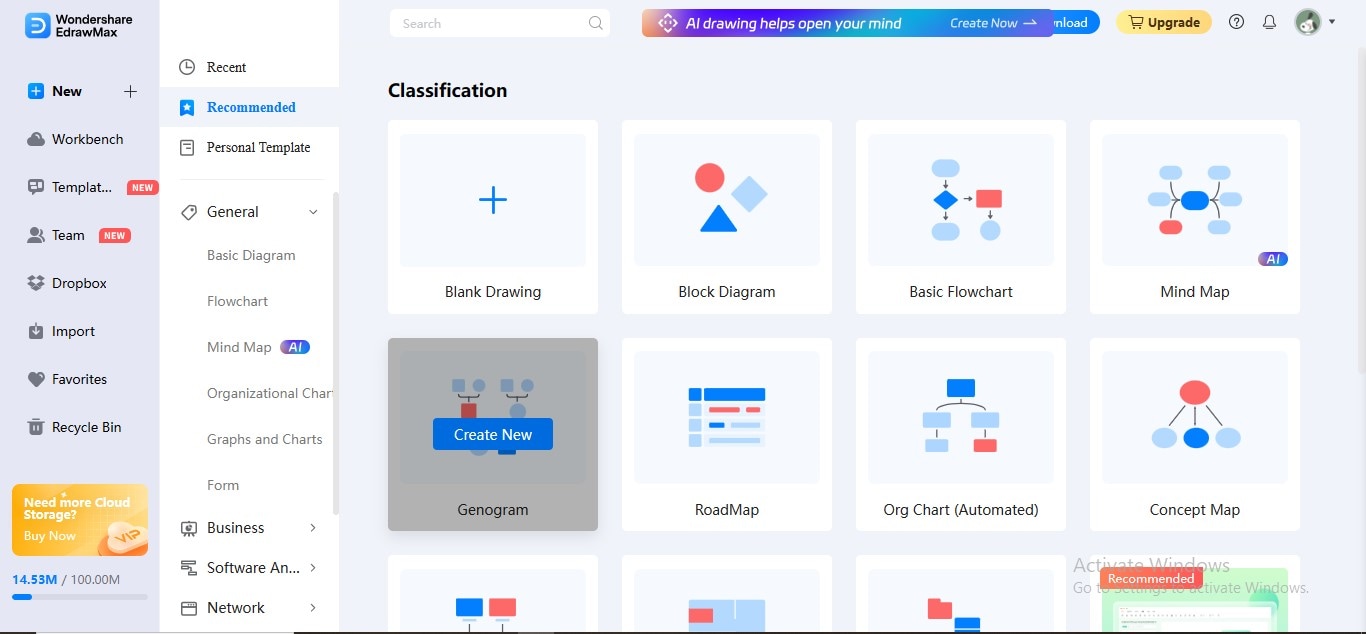
Click the "New" option in the left panel and choose the "Genogram" tab from the main widget.
Step7
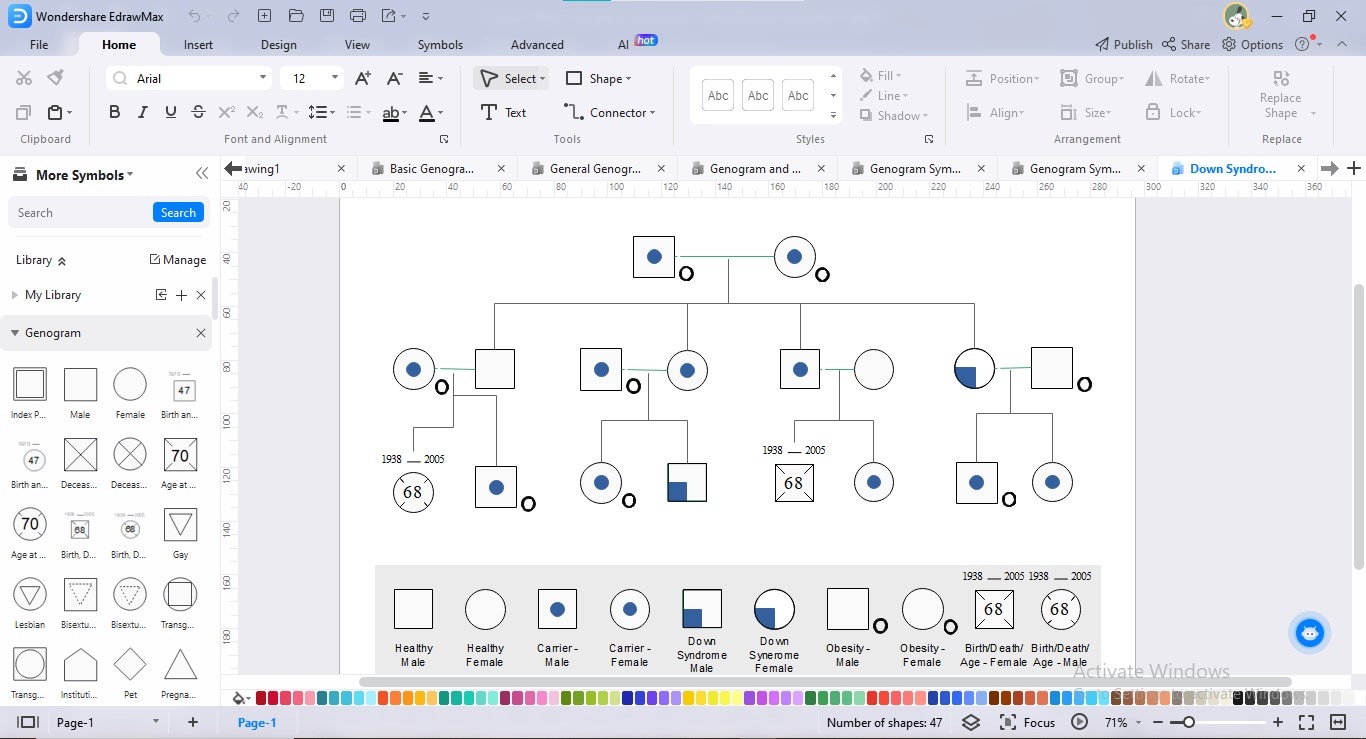
Drag and drop all the basic symbols from the Symbols Library on the left. Make a structure of your genogram by adding details to your symbols.
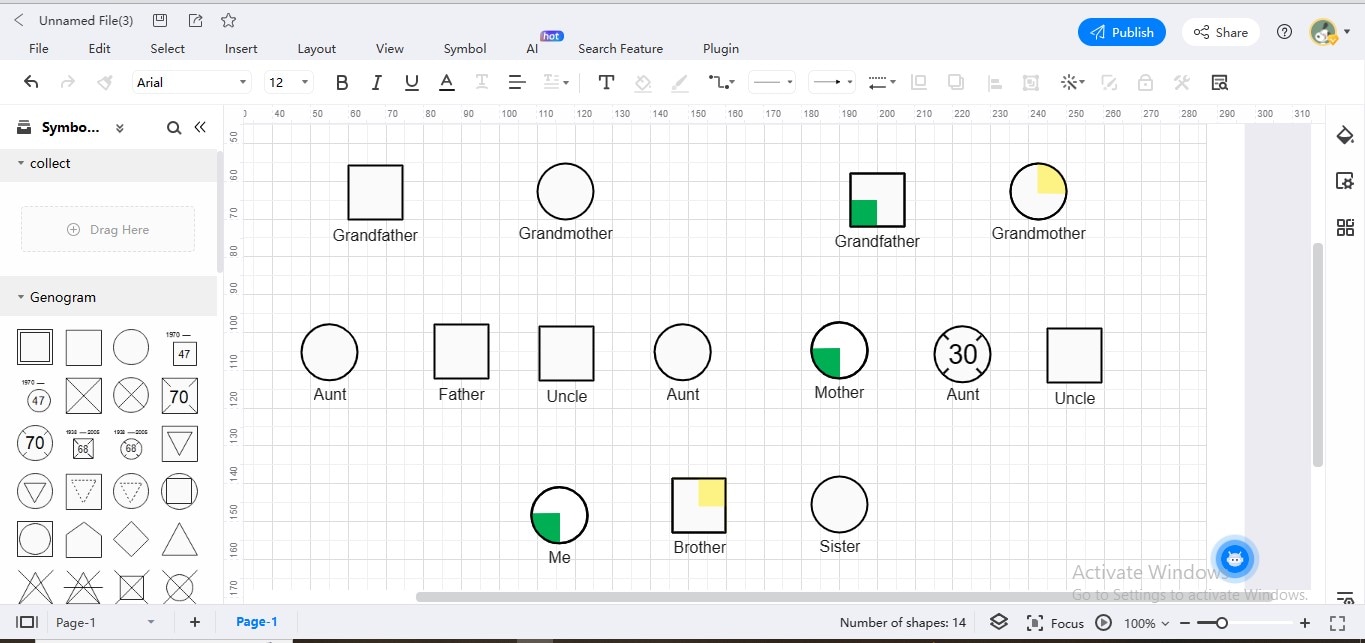
Step8
Now link up all the members. Sketch relationship symbols between them.
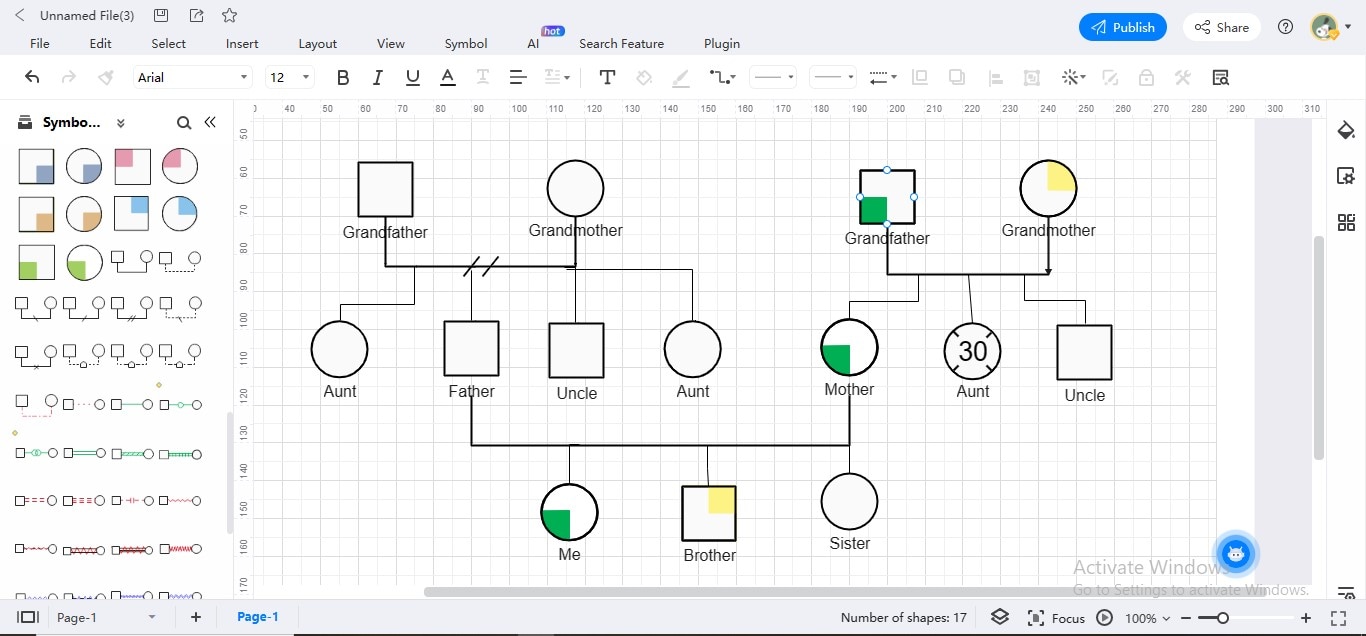
Step9
Complete your genogram by adding extra details.
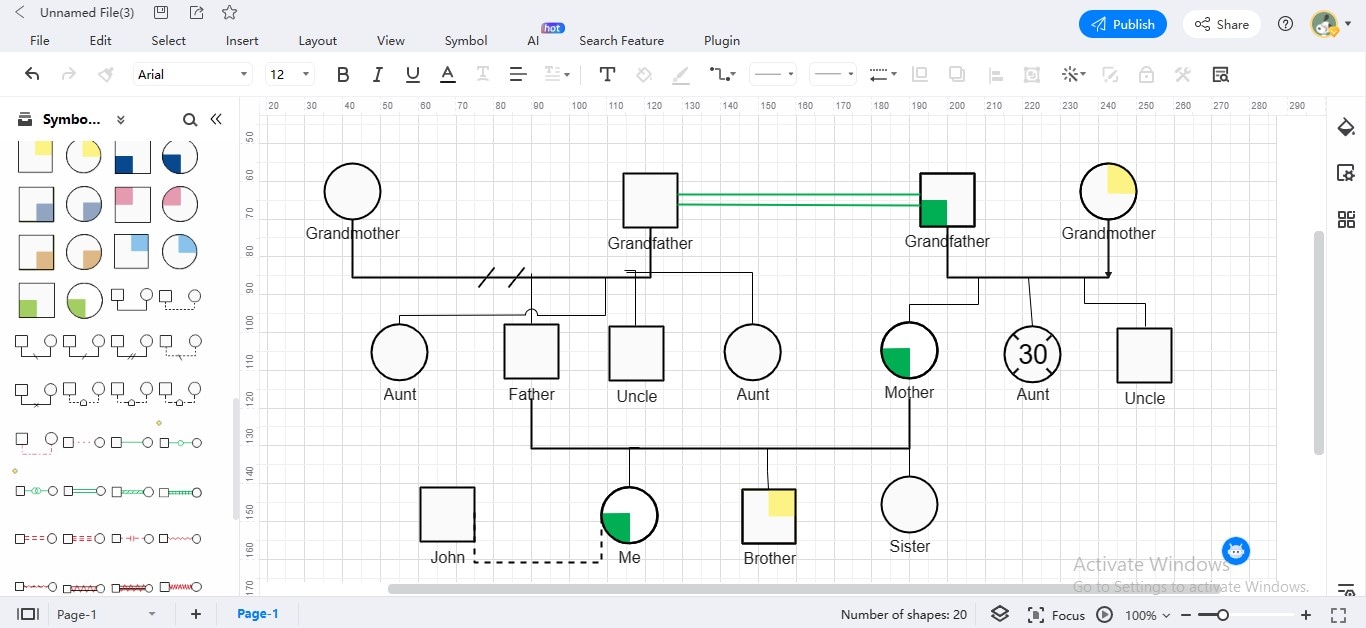
Step10
Save your genogram in your preferred format. For this, navigate to the "Export" icon at the top.
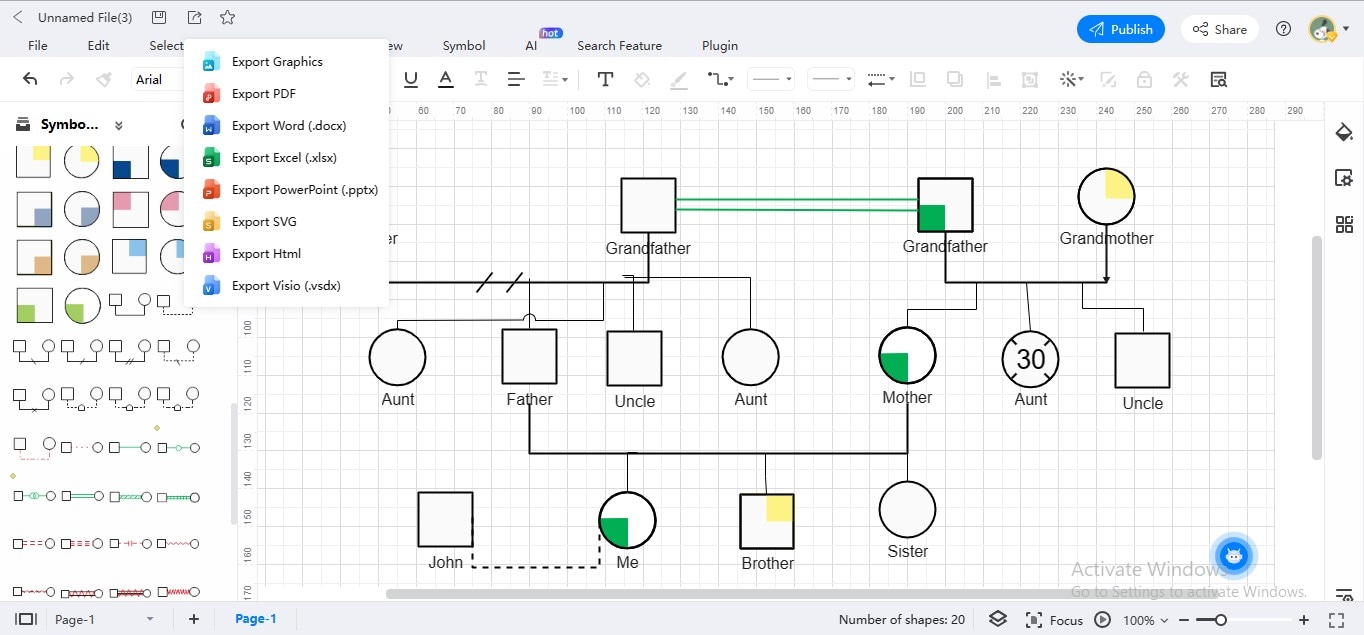
Part 3. Genogram Symbols Library on EdrawMax
Genograms can describe complex details easily and visually. Yet, it is crucial to know their symbolism. To familiarize its basics and notations, we have presented a few templates. These symbol toolkits contain fundamental genogram symbols:
Legend-Winchester Genogram Symbols


A genogram consists of various basic and advanced symbols to depict different conditions. In the above symbols library template, Legend-Winchester genogram symbols are shown. Squares signify males, whereas circles mean females.
A crossed square means a dead male. Conversely, a crossed circle represents a deceased female. The lines or arrows display the links among the family members. It shows whether they are married, engaged, divorced, separated, or friends.
Basic Genogram Symbols

In a genogram, the gender of family members is indicated by the common symbol used. More, they also tell us about the sexual orientations and life events of different family members. For example, a square with an inverted triangle represents a gay. In contrast, a circle with an inverted triangle denotes a lesbian female. Similarly, the squares and circles with dotted inverted triangles represent bisexual individuals.
You can also depict immigration, multicultural variance, and pregnancy using these diagrams.
Psychological Behavior Genogram Symbols

Psychiatrists use genograms to know family details and identify patterns of issues. They also explore the impact of family history on current issues through these visuals. It helps therapists understand how family affairs influence the emotional well-being of individual family members.
Also, genograms document family medical histories. This information is crucial in diagnosing and managing genetic conditions. Such diagrams also tell us about the illnesses having a hereditary factor. The above genogram symbol library pertains to psychological and physical disorders due to gene transfer.
Family Relations Genogram Symbols

It is equally important to visualize the links and affinities among different family members. You need to know the actual links to construct a comprehensive family tree. For example, the "married" symbol in a genogram is represented by a horizontal line. This line connects a male and female symbol. Similarly, we denote the "engaged" symbol as two persons connected by a dashed line.
In contrast, the "divorced" symbol contains two small diagonal lines crossing the horizontal line. Like the divorced symbol, the "separated" symbol has two small diagonal lines crossing the horizontal line. In contrast, the "cohabiting" symbol contains a dotted line similar to the married symbol but without the marriage symbol.
Part 4. Genogram Templates on EdrawMax
A full-fledged family genogram may assist you in comprehending the entire mechanism of how a genogram operates. For this reason, we have compiled a few valuable genogram templates for your insights:
Family Genogram Template With Key Symbols

The above genogram contains two families. One involves the patient's father, and the other is his mother. Both the paternal grandfather and grandmother of the patient were separated and dead. The paternal grandmother had cancer. In contrast, maternal grandparents are alive. Yet, they have asthma and chronic kidney diseases.
The parents and siblings of the patients are alive & healthy. This template represents a family genogram representing basic links and attributes.






 (AI & Web)