


Data flow diagrams help represent the overall flow of data in a system effectively. But before you start mapping one out, you need to learn the language of DFDs—its symbols and notations.
While these symbols look like simple shapes, each one carries meaning. They represent how data moves in a system, where it’s stored, and how it’s processed. You can think of these symbols as a DFD’s building blocks.
If you want to create professional DFDs, learning symbols and notations is crucial. So, let’s break them down and see how you can use them in EdrawMax to create custom diagrams.
In this article
What is a Data Flow Diagram?
A functional business has several departments, each with its unique system processes. This makes storing, tracking data, and establishing connections between each system quite challenging. But it's also crucial as it helps identify problem areas and improve productivity at work.
That's where Data Flow Diagrams (DFD) come in. They are one of the simplest and effective tools for businesses to understand, perfect, and implement new and existing systems.
Data flow diagrams provide information about the process itself by highlighting inputs and outputs. They also illustrate how data moves in the system from start to finish. Visualizing each element in the process makes it easy to identify inefficiencies and produce the best possible system.
Organizations first started using data flow diagrams in operational research to monitor workflow. But they quickly became a popular way to visualize the process data and steps. Although DFDs were mainly used to show data flow in computer systems, they also became useful in documenting significant data flows.
Physical and Logical Data Flow Diagrams
Before you start designing a data flow diagram, you should determine what type of DFD you need. There are two main categories of data flow diagrams: logical DFD and physical DFD.
Logical DFD focuses on the business and how a system operates. It highlights various operational events required to run a business and the data needed for every event.
On the other hand, physical DFD shows how a system is implemented. While both diagrams map out the flow of data in a process or system, the logical diagram provides the 'what,' while the physical diagram provides the 'how.'
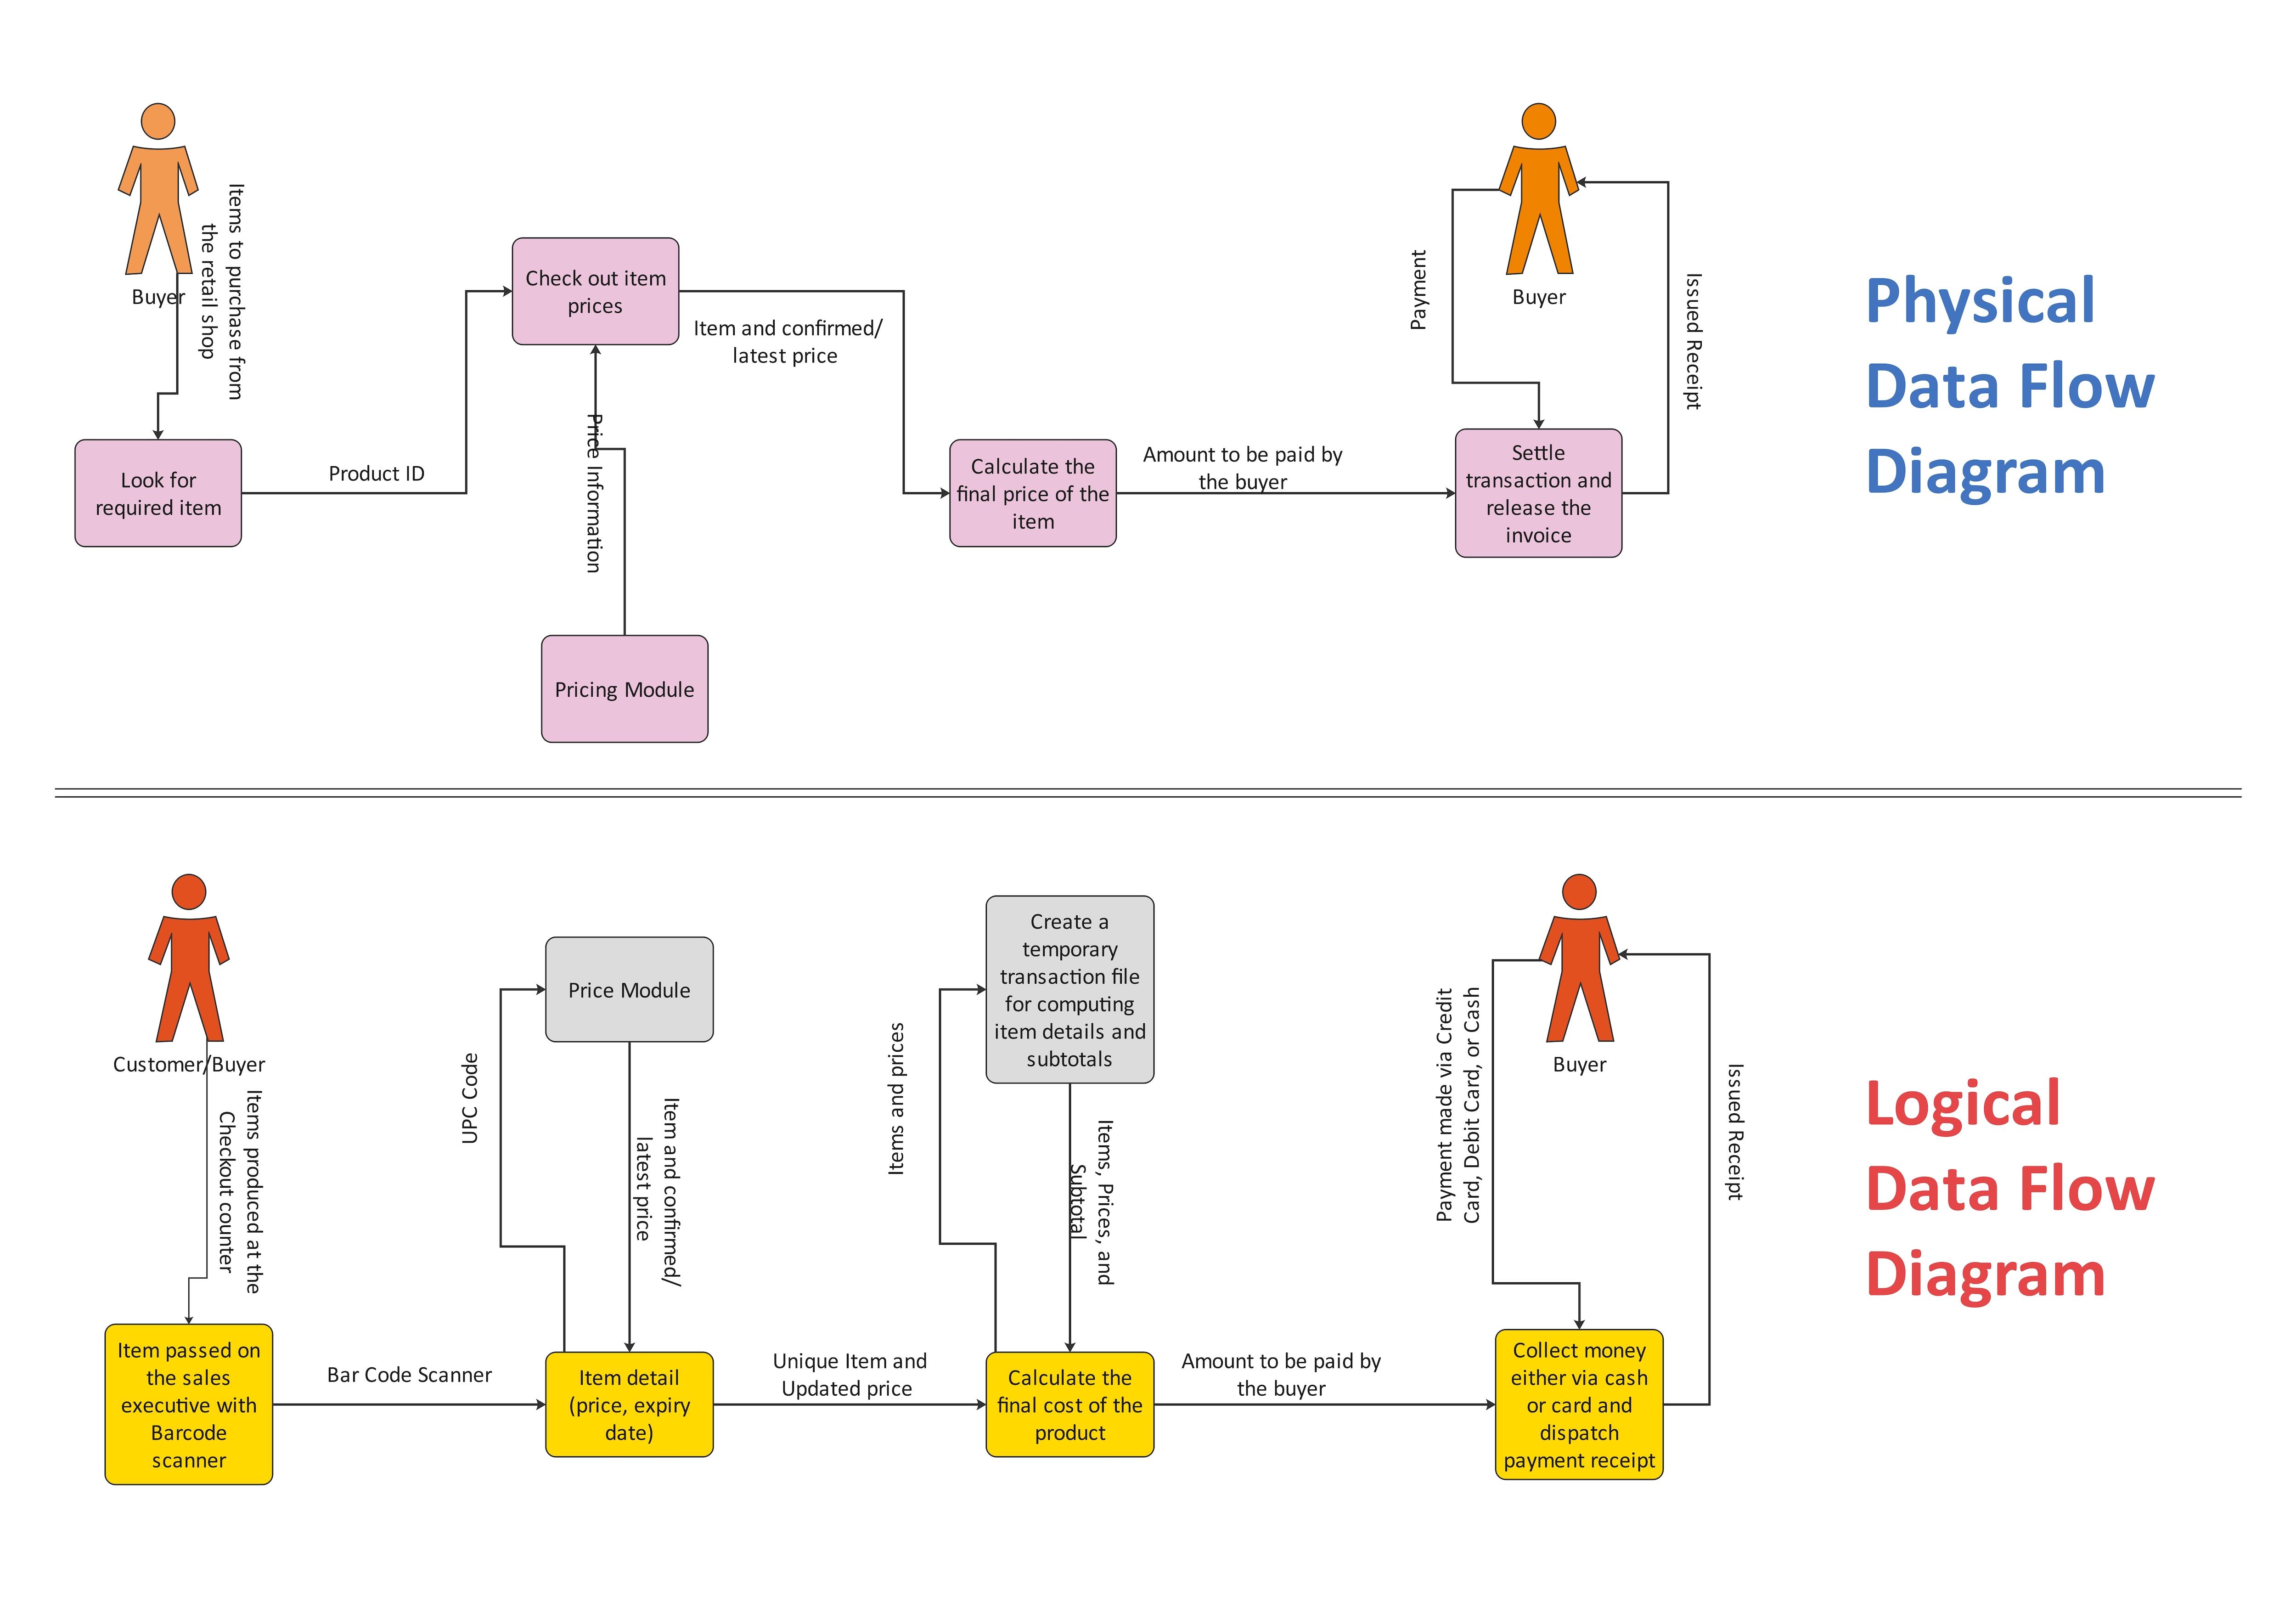
You may need both physical and logical data flow diagrams to show how information flows. Together, they offer more insights and information than either one alone.
Data Flow Diagram Symbols and Notation
Data Flow Diagram Symbols
Data symbols in a flowchart represent how data moves in a system or process. It includes short-text labels, arrows, circles, squares, and rectangles to describe the direction in which data flows. The other important parts in DFDs are sub-processes, data storage points, data inputs, and outputs.
A data flow diagram has four basic elements: external entity, process, data flow, and data store. These elements can be represented through two methods of notation - Yourdon & Coad, and Gane & Sarson. While DFD symbols may vary depending on methodology, the basic idea stays the same.
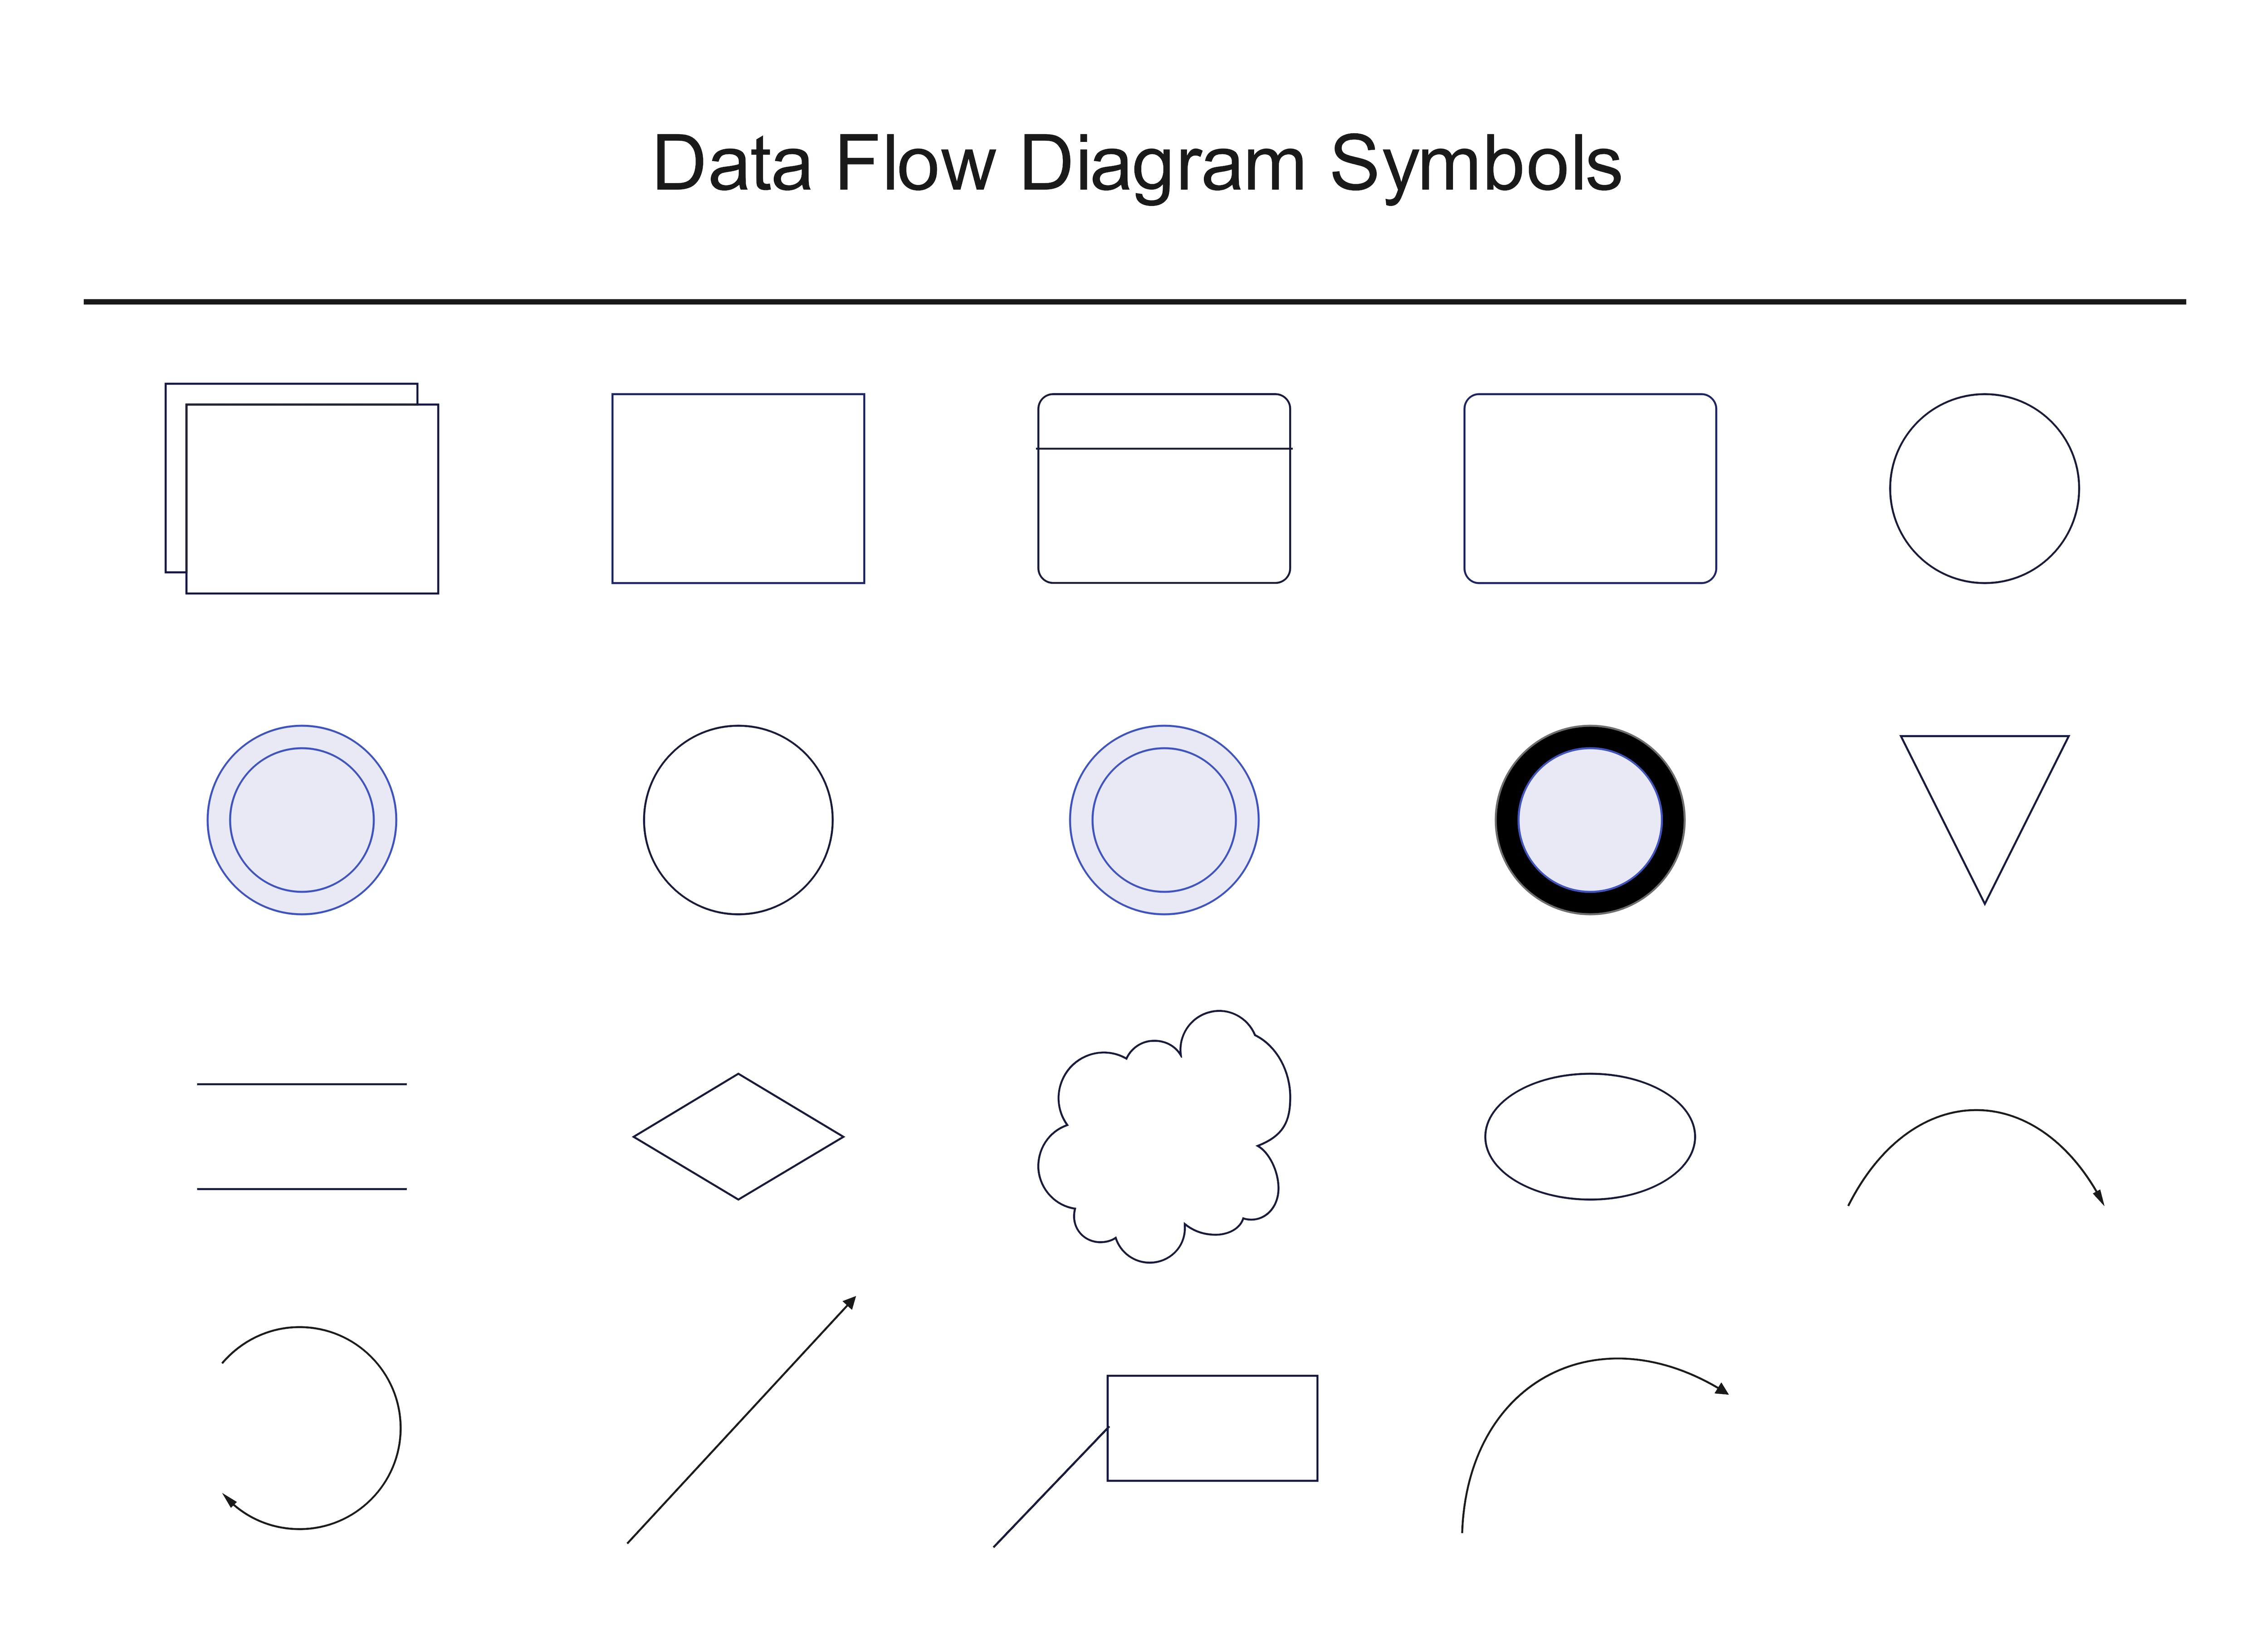
Data Flow Diagram Notations
Here's a quick overview of standard DFD symbols and notation.
- External Entity - It represents anyone or anything outside the system that sends or receives data. They are also known as sources, terminators, sinks, or actors and are represented by squares.
- Process - It shows an activity or task that the system performs to change inputs into outputs. A process is represented with a circle or a rounded rectangle symbol with 3 descriptive elements:
- An identification number appears in the upper left-hand corner. This is randomly assigned at the top level and used as a unique ID.
- A location appears to the right of the identifier and describes where in the system the process takes place. This may, for example, be a department or a piece of hardware.
- A descriptive title is placed in the center of the box. This can be a simple instruction, such as 'maintain customer records' or 'find the driver.'
- Data Store - A data store is a holding place for information within the system. It may be used for long-term files, such as sales ledgers, or short-term information, like a batch of documents waiting to be processed. It is represented by an open-ended, narrow rectangle. Each data store is given a reference, followed by a random number.
- Data Flow - A data flow shows the movement of information from its source to its destination. It begins or ends with a process, highlighting the connection between elements. A data flow is represented by a line with arrowheads showing the direction of flow. In addition, each data flow may be referenced by the processes or data stores at its head and tail, or by a description of its contents.
- Resource Flow - A resource flow shows the movement of any physical material from its source to its destination. For this reason, they are sometimes referred to as physical flows. Resource flows are used in high-level diagrams, especially when the physical movement of materials needs to be analysed.
How to Create a Data Flow Diagram
A data flow diagram can help you illustrate processes clearly. However, a diagram can only serve its purpose if it has the following qualities:
- Every single process has at least one input and one output.
- Each data store has at least one data flow in and one data flow out.
- Every system's stored data goes through a process.
- Every process in a data flow diagram is linked to another process or data store.
If you have the above information, you can create a data flow diagram easily by following these five steps.
Step1Identify Major Inputs and Outputs
- Start by figuring out the main elements going in and coming out of your system.
- Once you understand your major inputs and outputs, you will have a clearer picture of how the system works from start to finish. These will eventually form the foundation for the rest of your diagram.
- So, take the time to get them right from the beginning.
Step2Build a Context Diagram: Level 0 DFD
- Create a simple diagram, focusing on a single process.
- Place it in the center and connect it to all the external entities from which it receives or sends data. This will serve as your first draft that gives an overall picture of the system without going into too many details.
Step3Expand the Context Diagram into a Level 1 DFD
- Take the single process from your context diagram and divide it into smaller, more detailed processes. This will help in visualizing how data moves within a system and what activities are performed to transfer it from one end to another.
- Level 1 DFDs are more of a general overview, but they give more detail than a context diagram.
Step4Expand to Level 2+ DFD
- Continue to break down single processes into detailed versions until you have added all inputs, outputs, and data stores involved in the system.
- The final diagram will show exactly how each part of the system works, making it easier to understand complex processes.
Step5Check the Accuracy of the DFD
- Check the diagram thoroughly, paying close attention to the flow of information. If all the processes are connected logically, and all necessary data stores are included, then thumbs up.
- Your final goal should be to ensure that other people can understand your diagram completely.
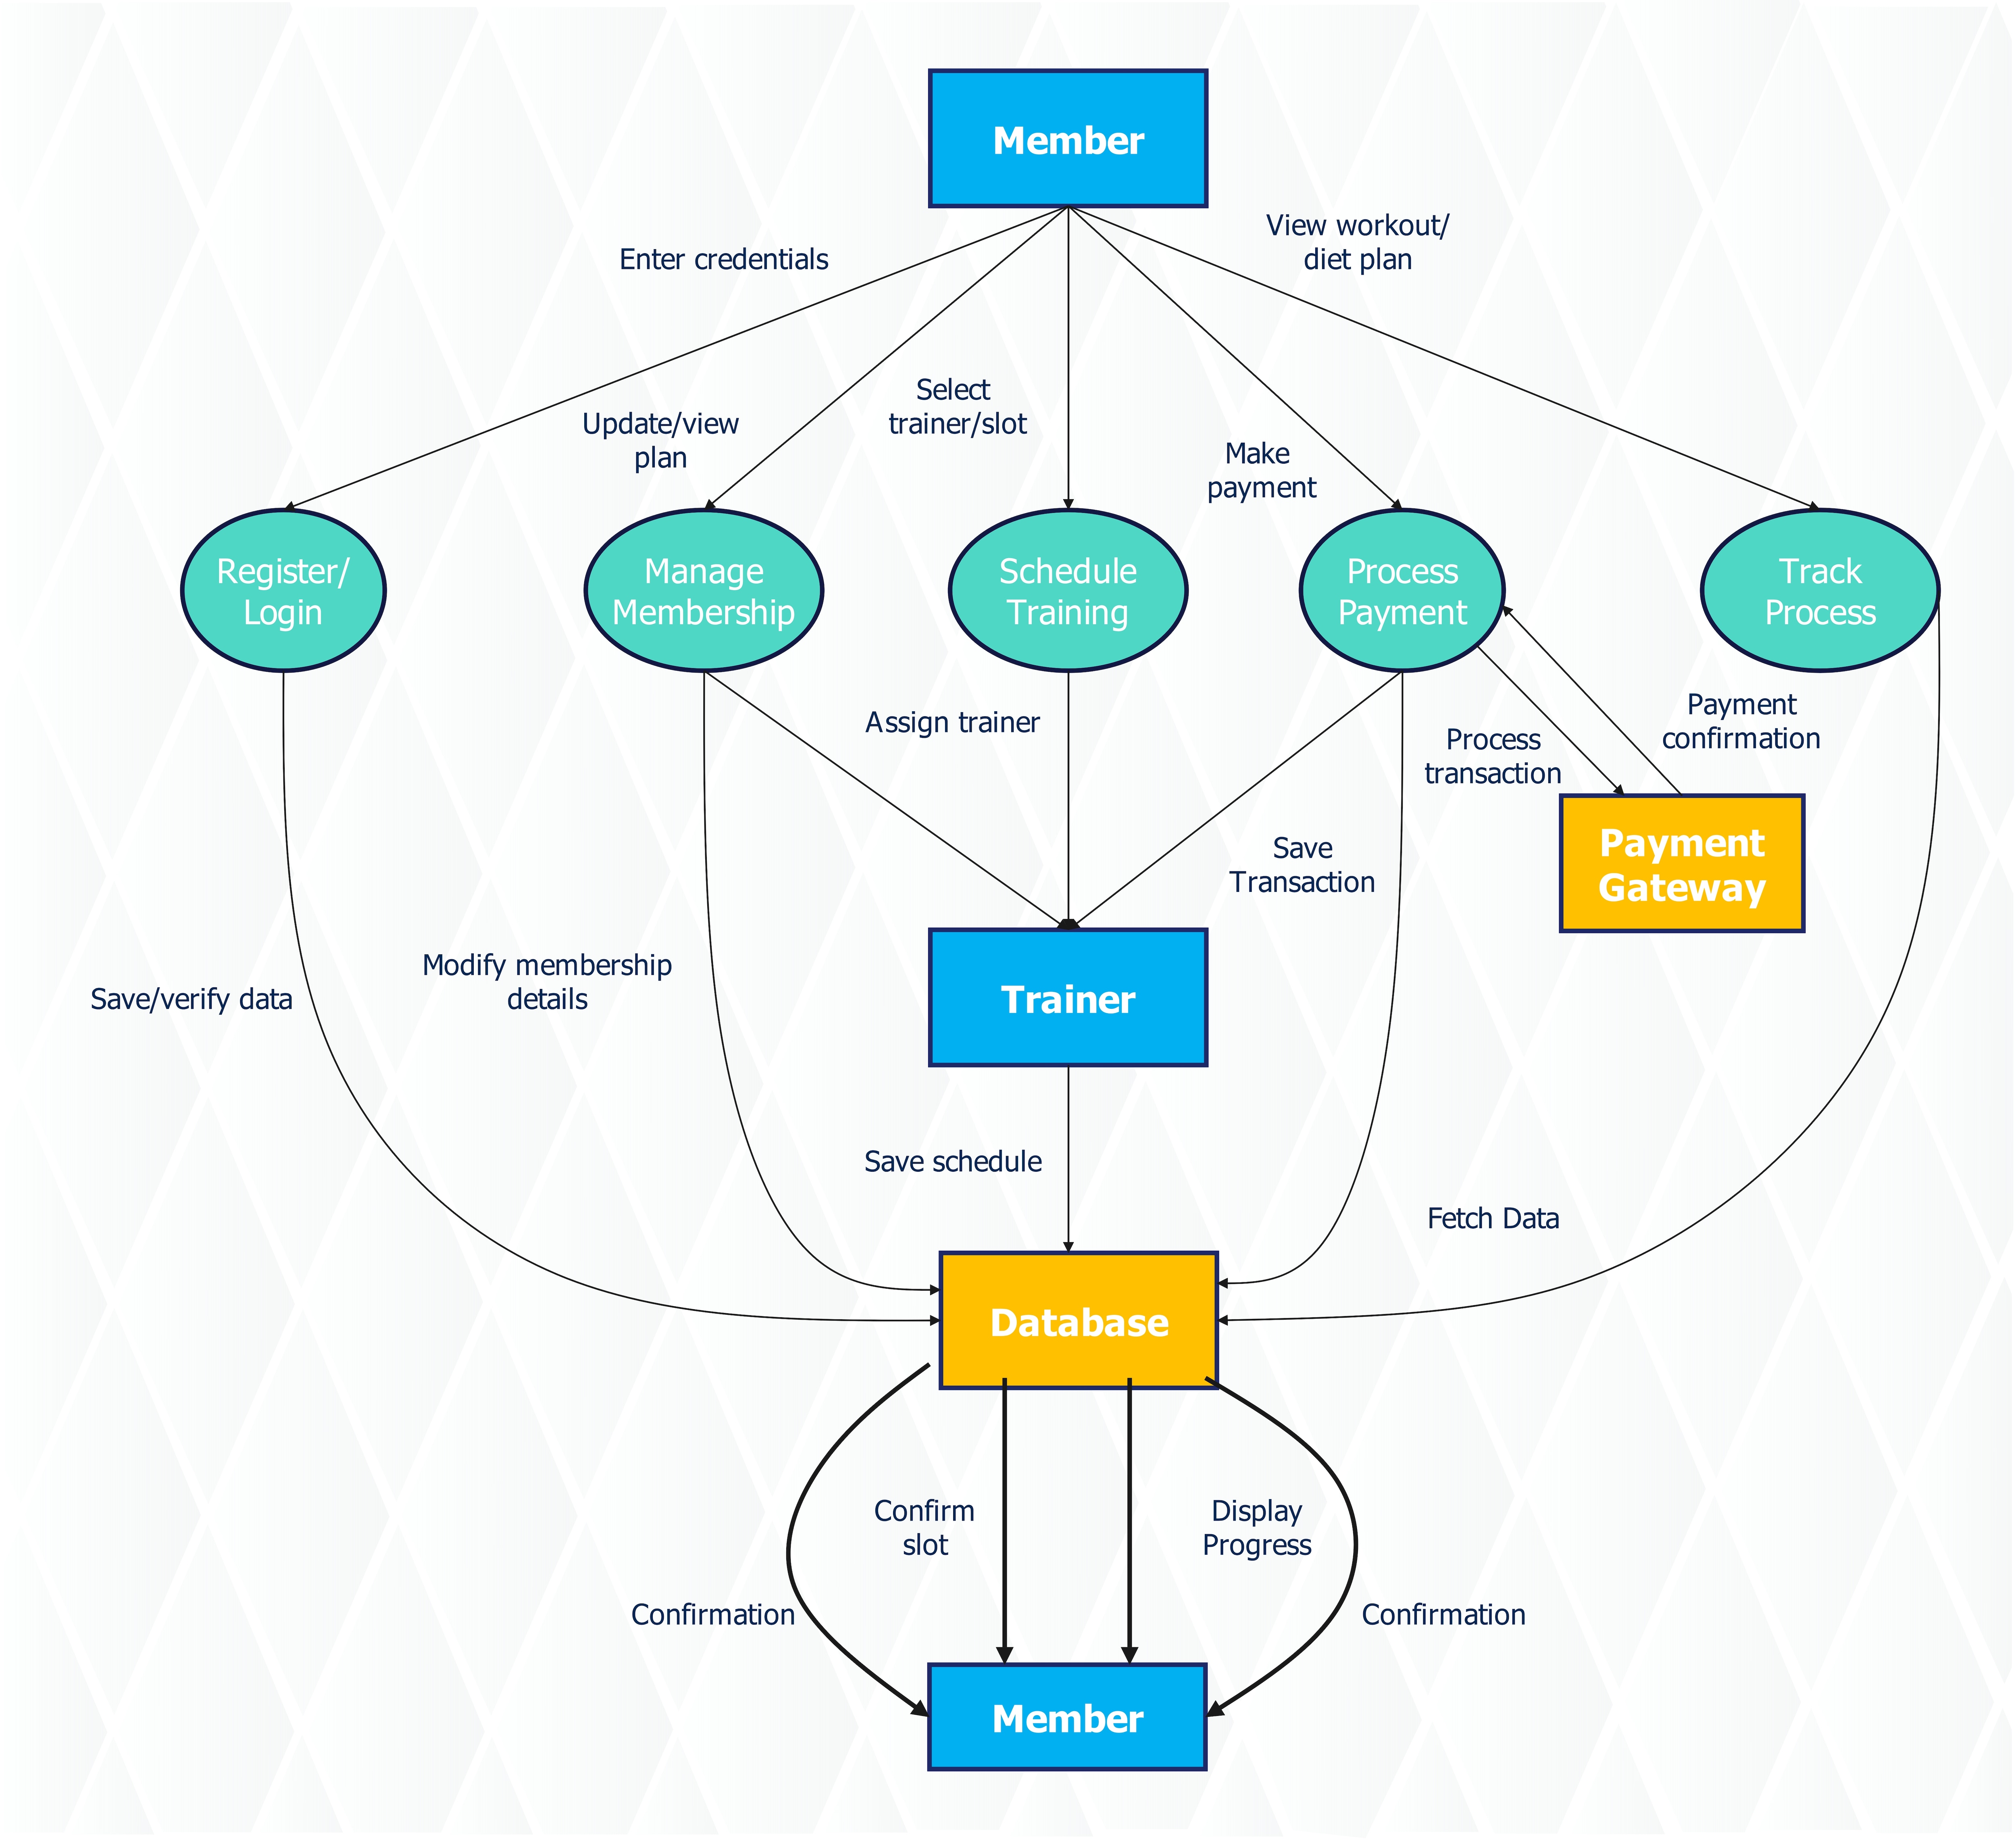
Data Flow Diagram Examples
Want to see how symbols and notations are used in a data flow diagram? See the templates below and easily customize them with EdrawMax. With hundreds of templates available on EdrawMax's website, you're sure to find one that fits your needs.
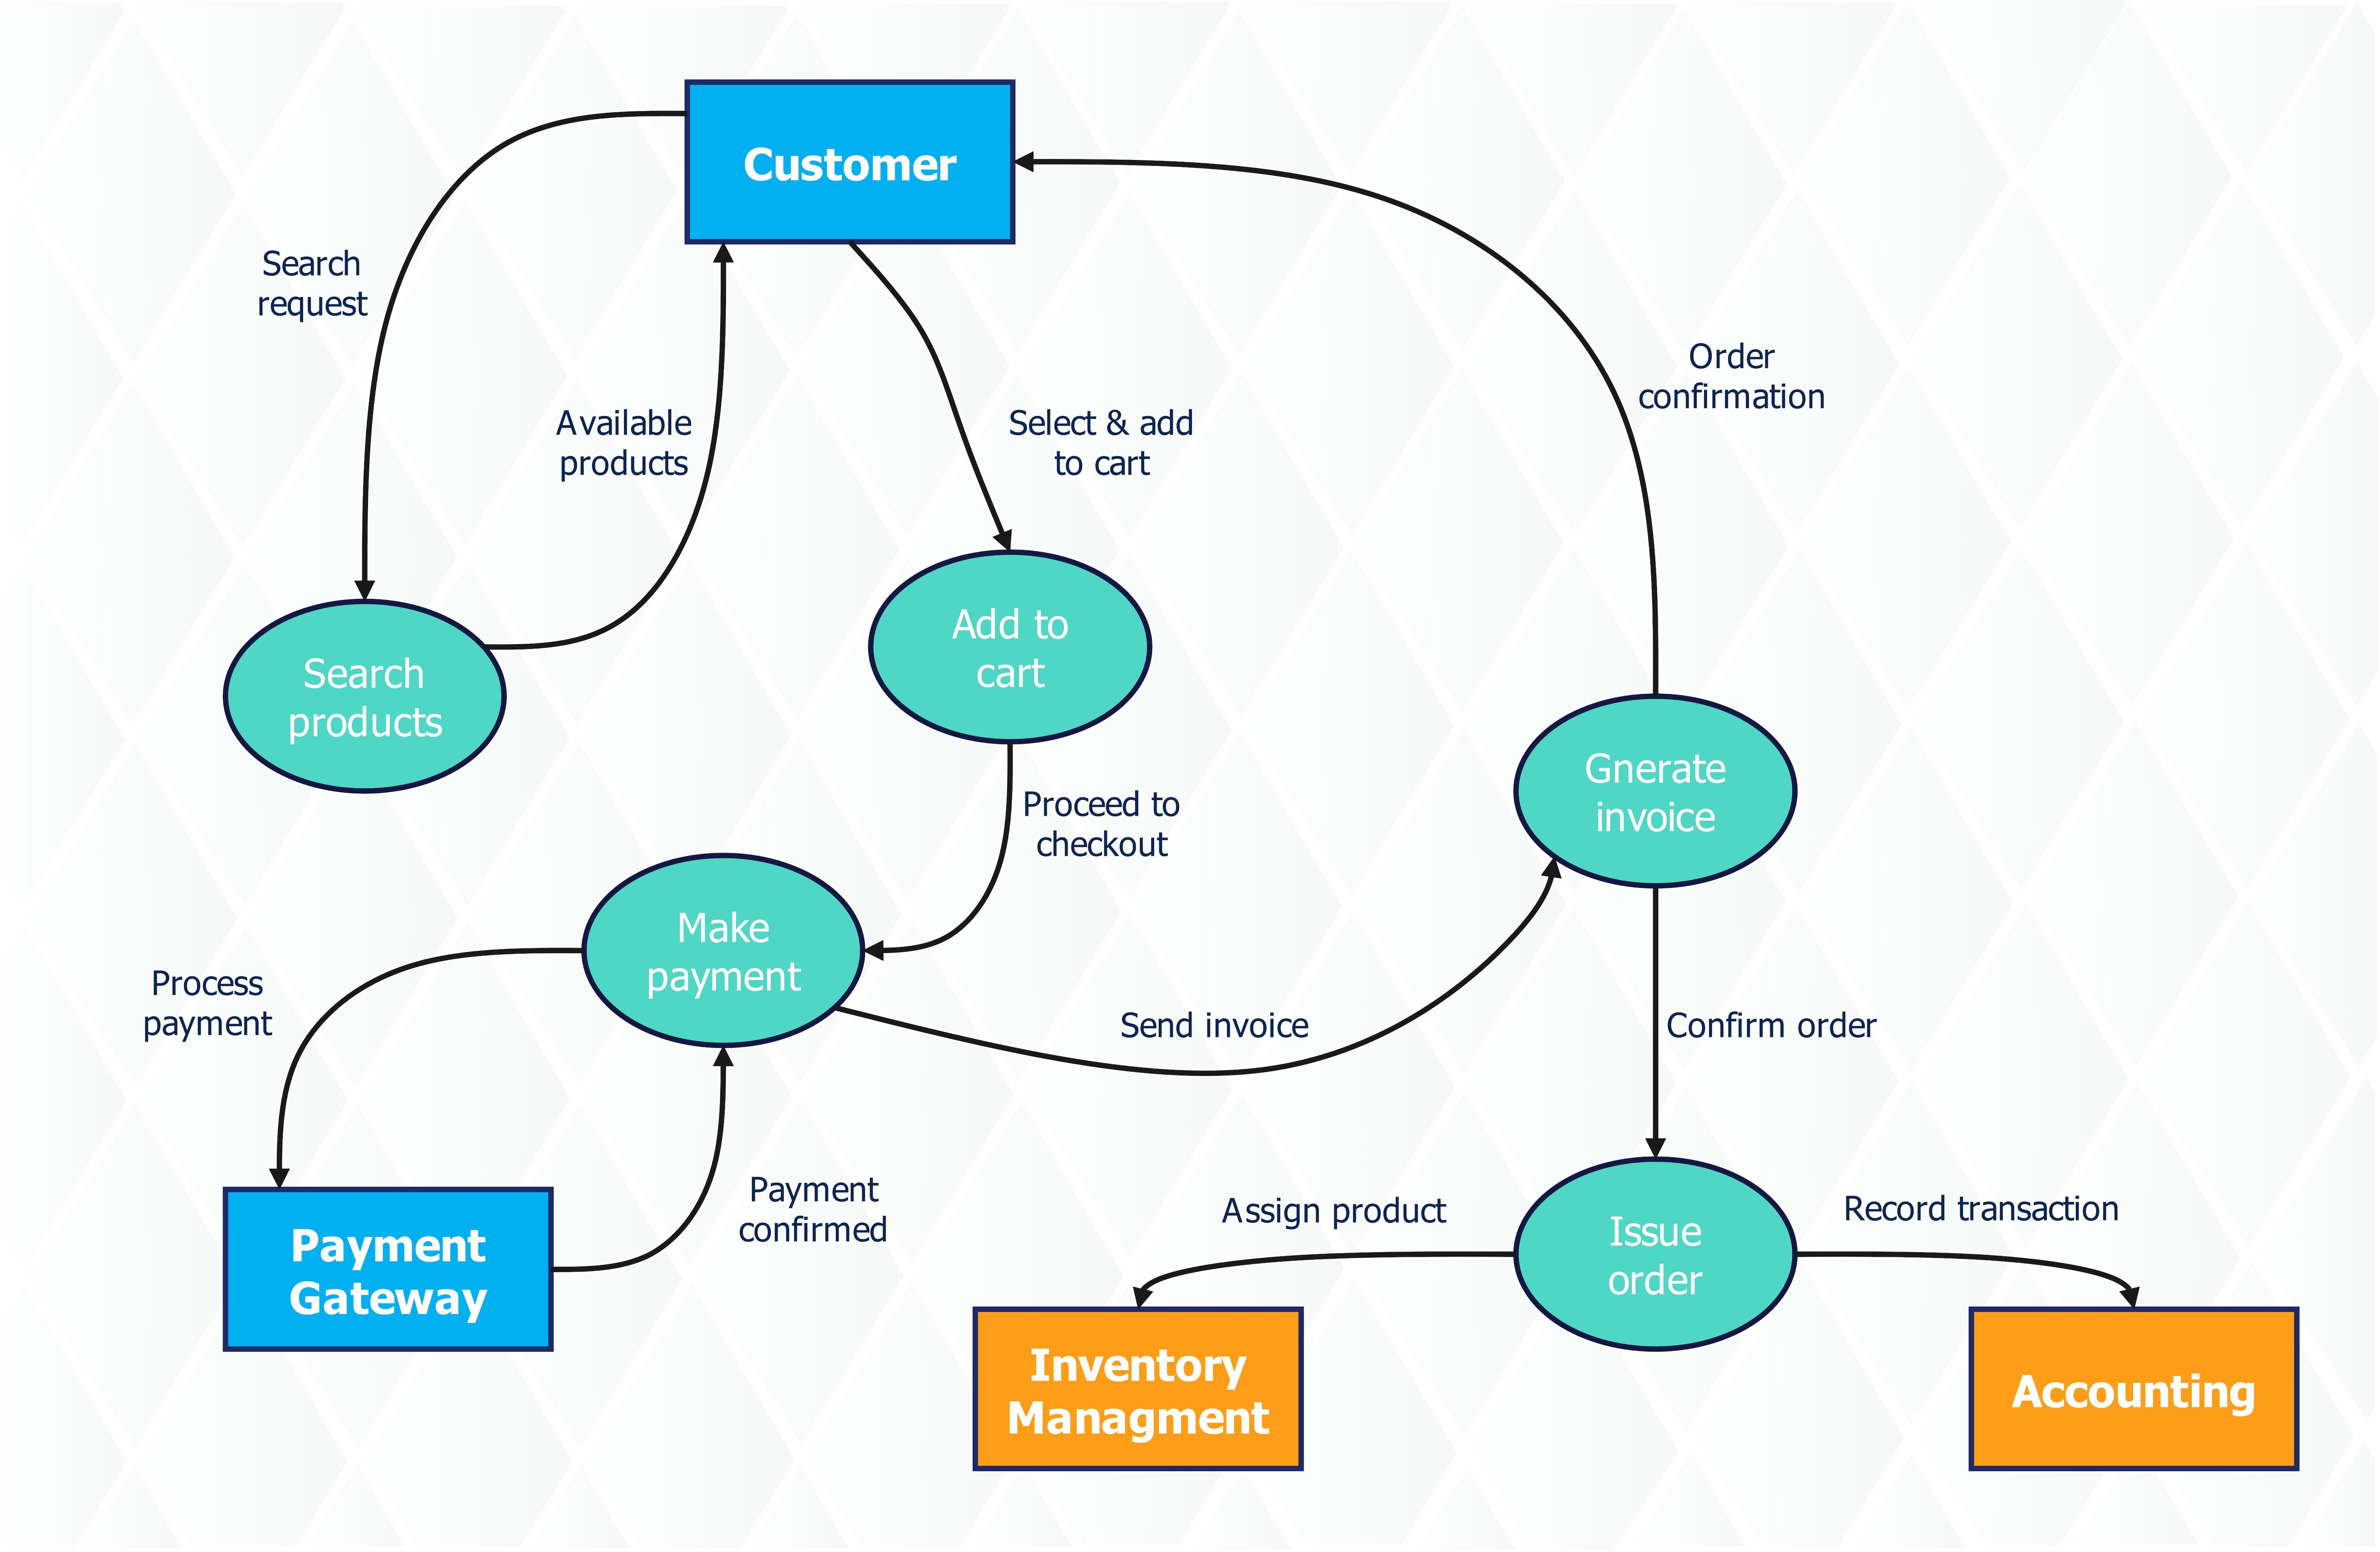
Online Shopping Data Flow Diagram Template
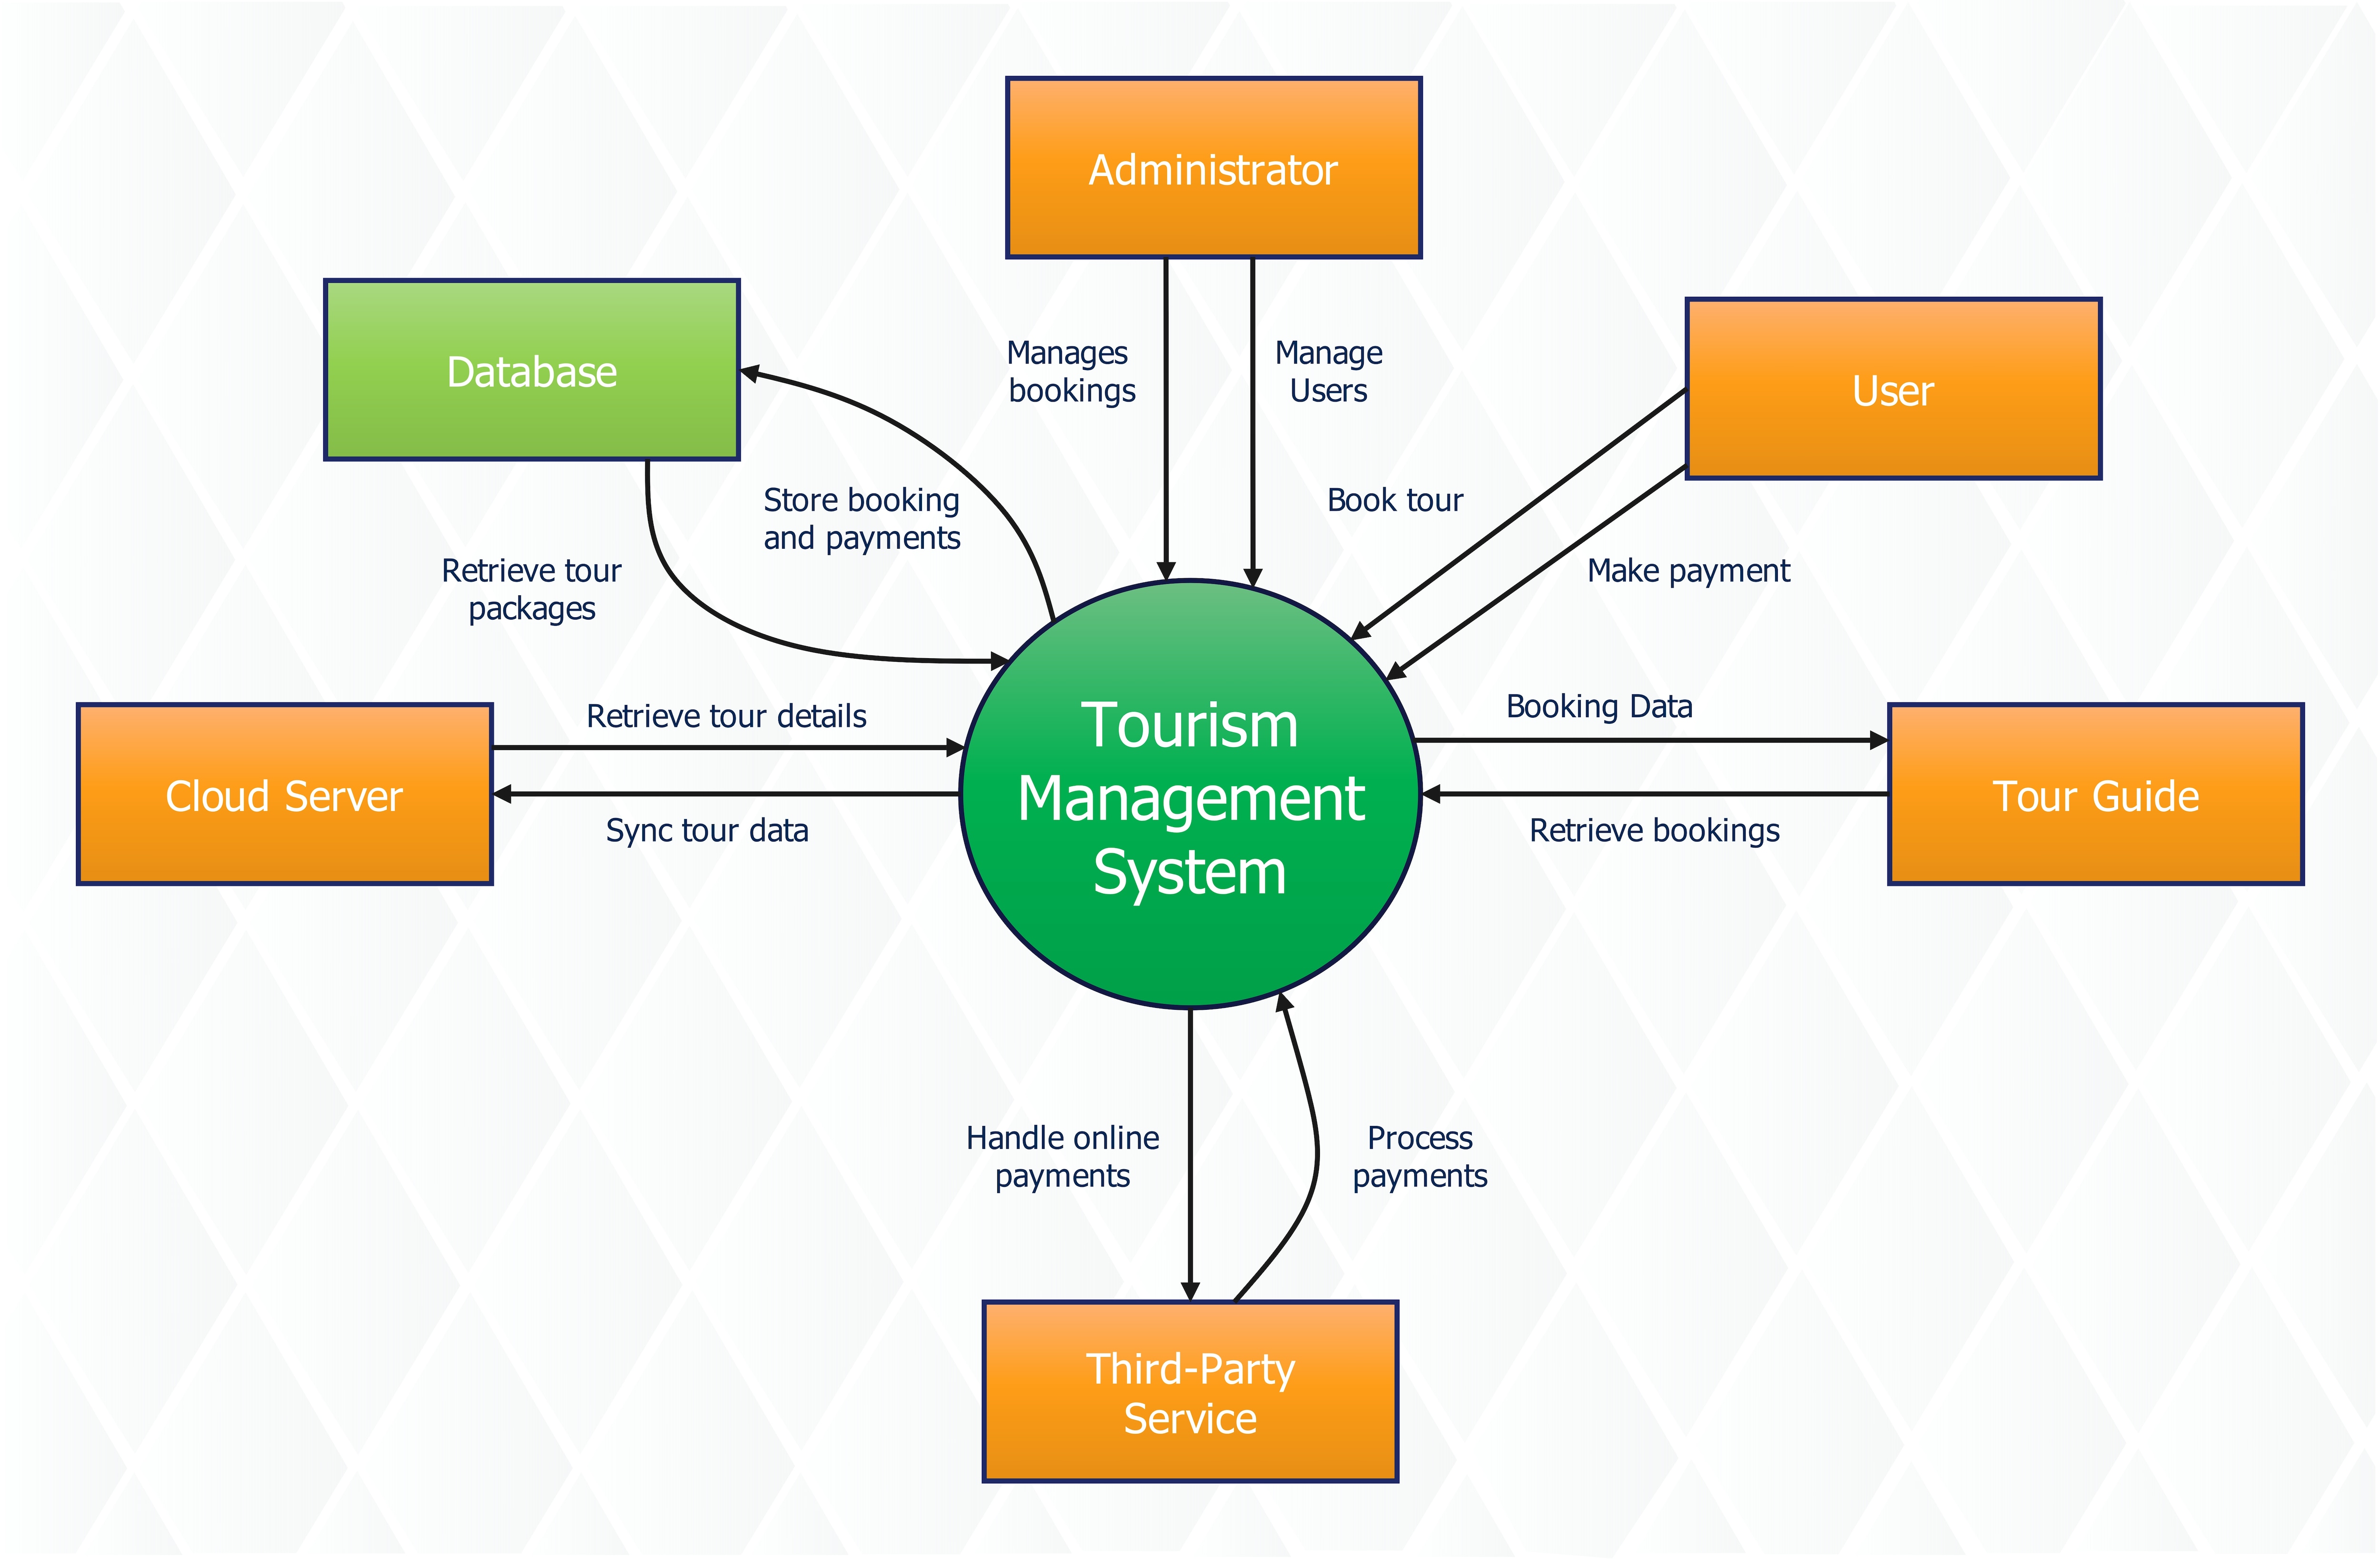
Tourism Management Data Flow Diagram Template
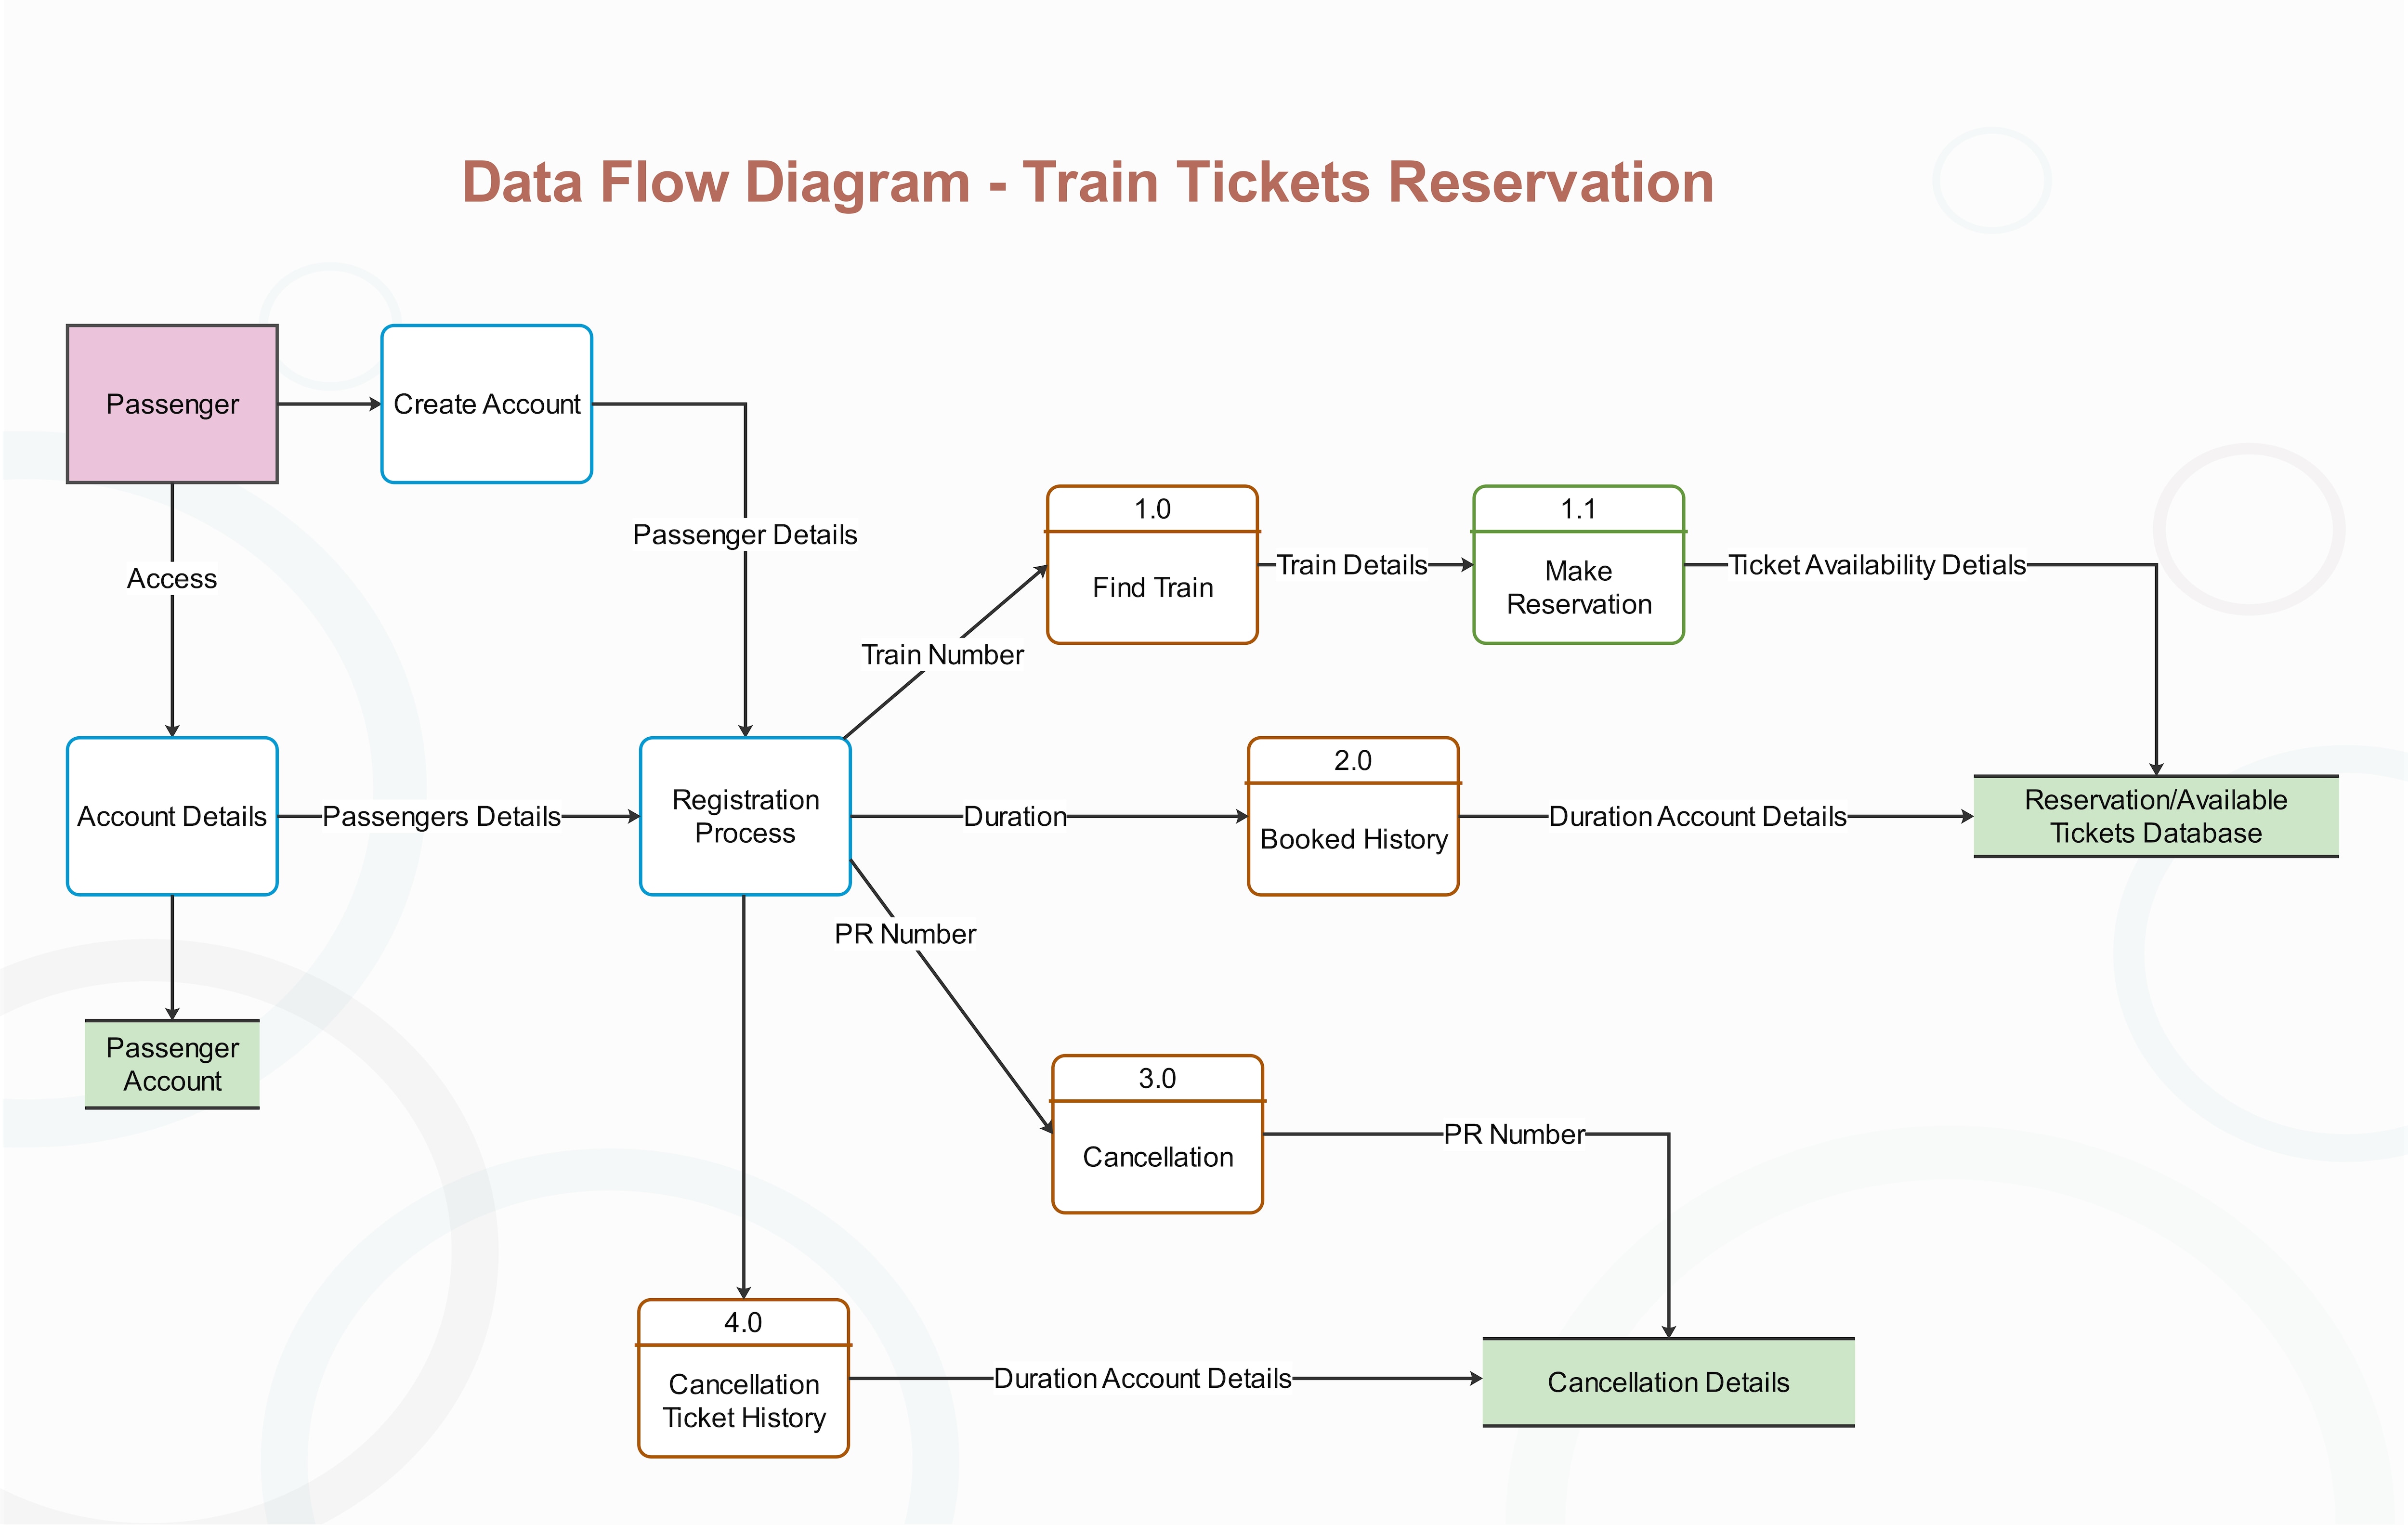
Train Tickets Reservations Data Flow Diagram Template
Conclusion
Understanding DFD symbols is the first step towards creating solid data flow diagrams. Once you know the meaning of each one, simplifying complex processes becomes much easier. And with smart tools like EdrawMax, which offers pre-built templates and an extensive symbols library, building custom designs is a breeze.
Ready to turn your system into a visual data map? Start diagramming today with EdrawMax.
AI Diagram Generator
Enter your prompt. Upload files if needed. Generate diagrams, charts, or slides instantly.


