About Azure Synapse Diagram Template
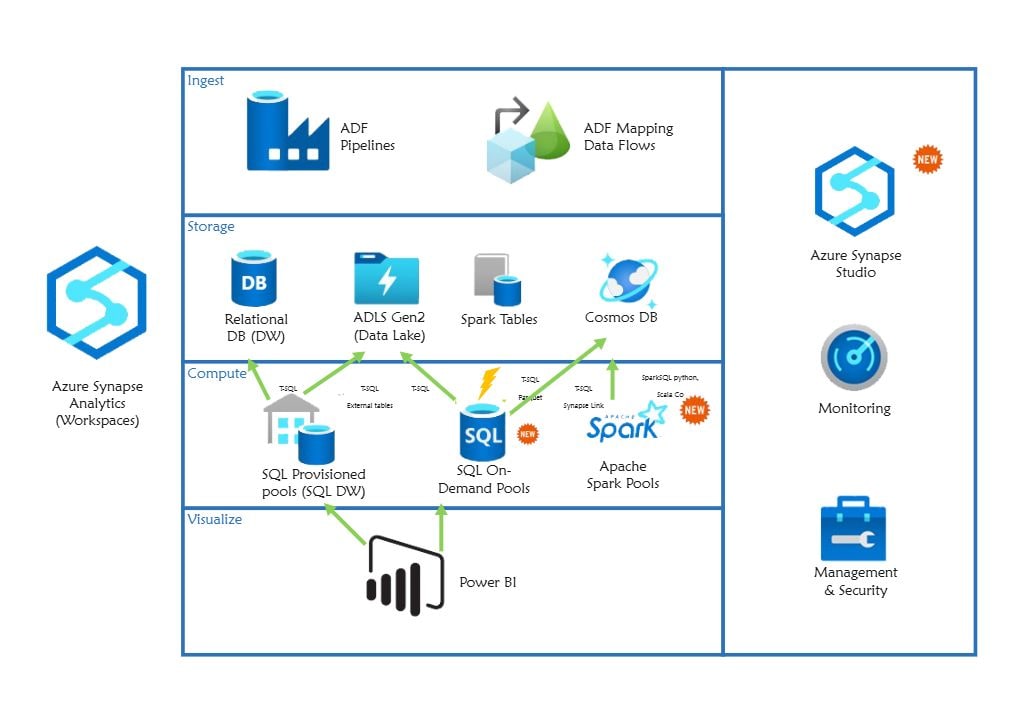
This Azure Synapse diagram template focuses on how analytics-related services, data movement, and platform relationships are organized inside an Azure-based data environment. It helps users explain structure and flow more clearly than a plain technical outline.
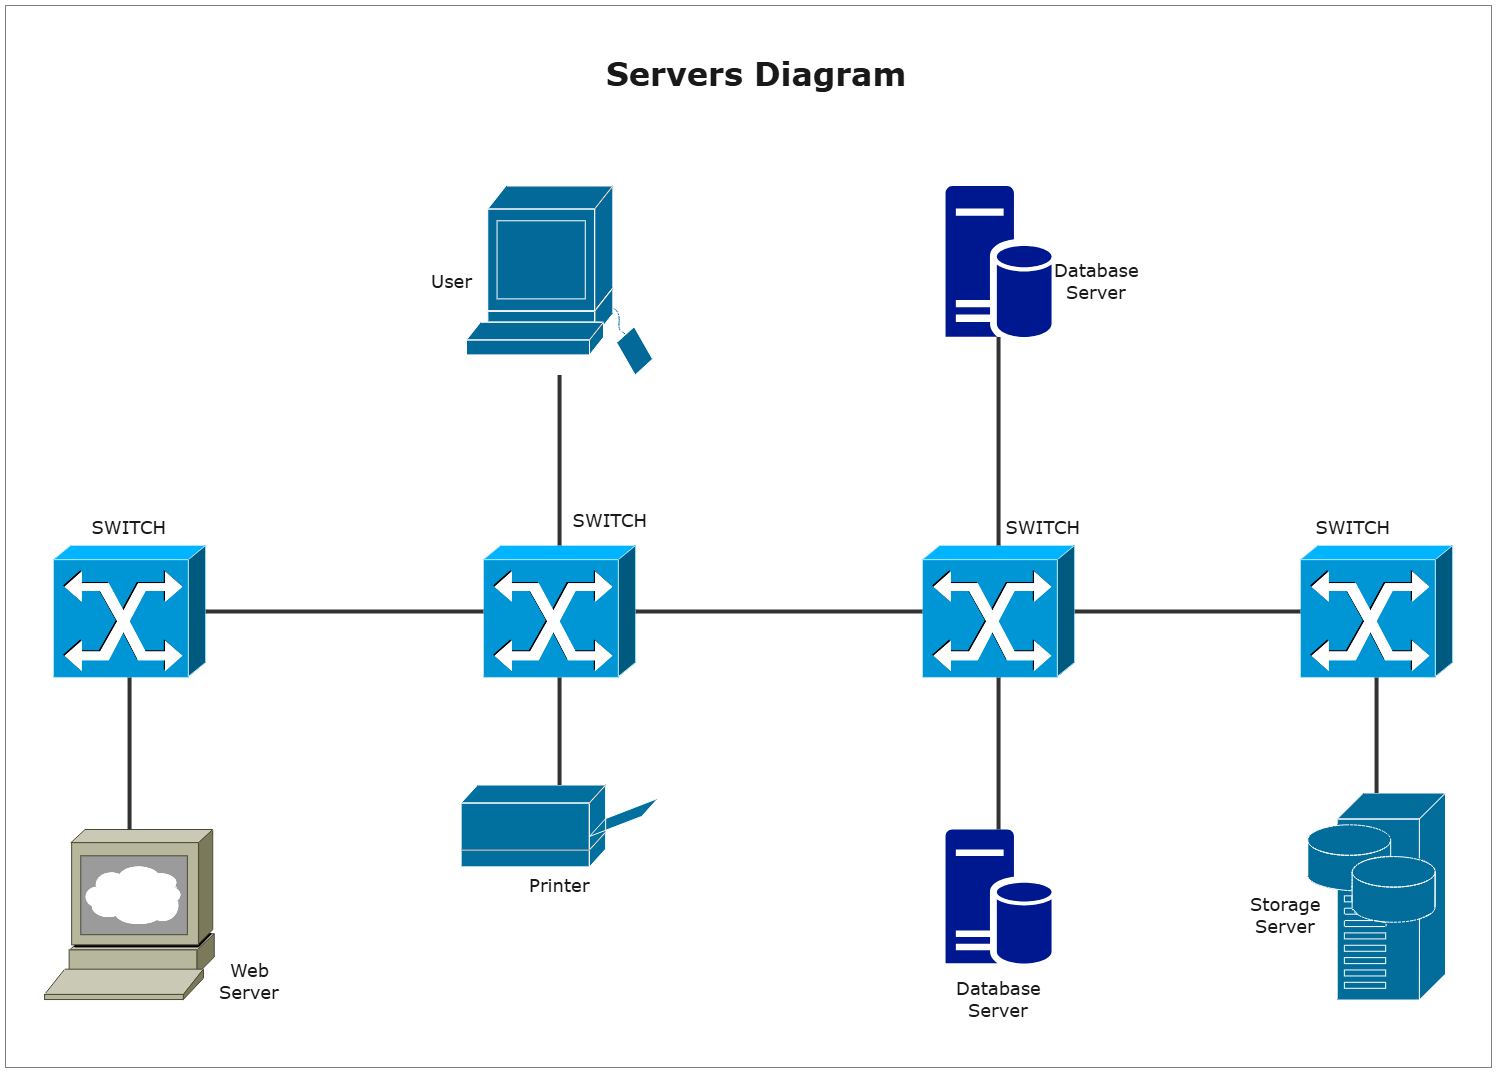
Analytics platform components
The diagram appears to highlight the major platform blocks that define the Synapse-related environment. This matters because data-platform review often starts with understanding which services or layers carry the key analytics and integration roles.
- Helps explain the major analytics-related components
- Supports data-platform planning and review
- Useful for technical documentation and communication
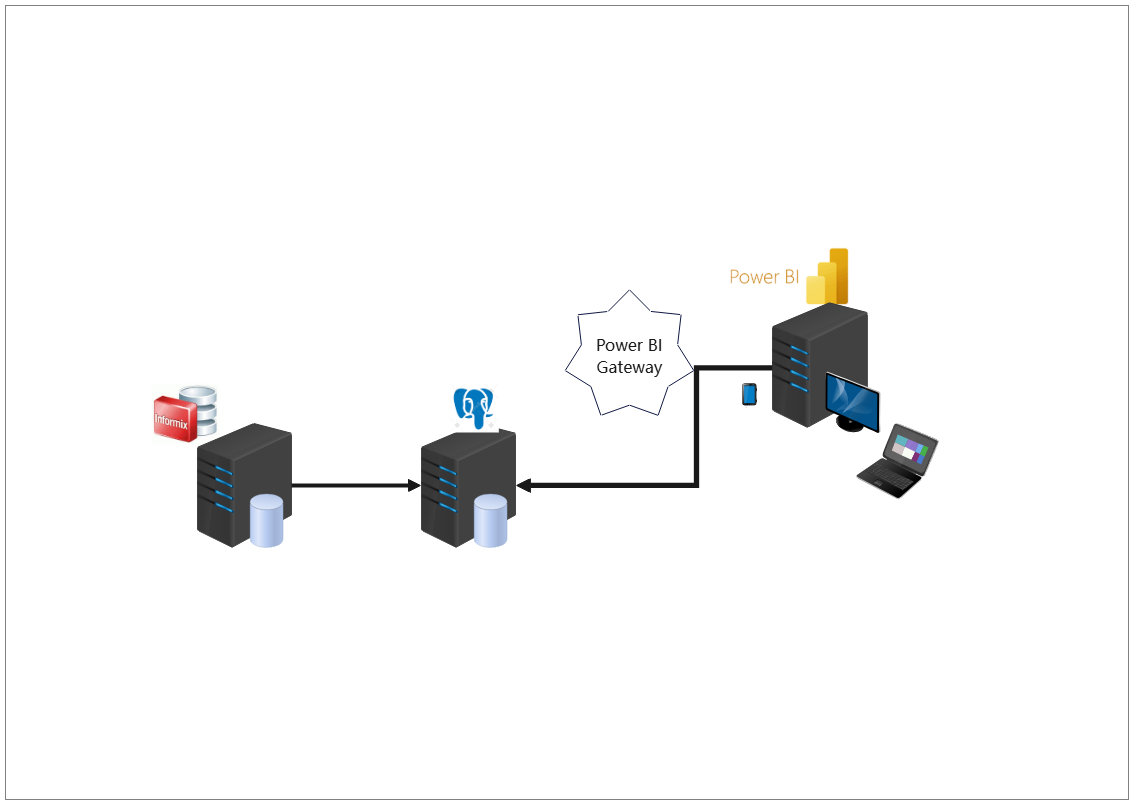
Data movement and service relationships
The visual arrangement also helps users review how data or service relationships connect across the platform instead of treating the components as isolated blocks. In a Synapse-related architecture, these paths matter because system value depends on how data moves through the environment.
- Shows how key services relate through data or processing logic
- Supports review of flow and dependency structure
- Useful for explaining platform behavior more clearly
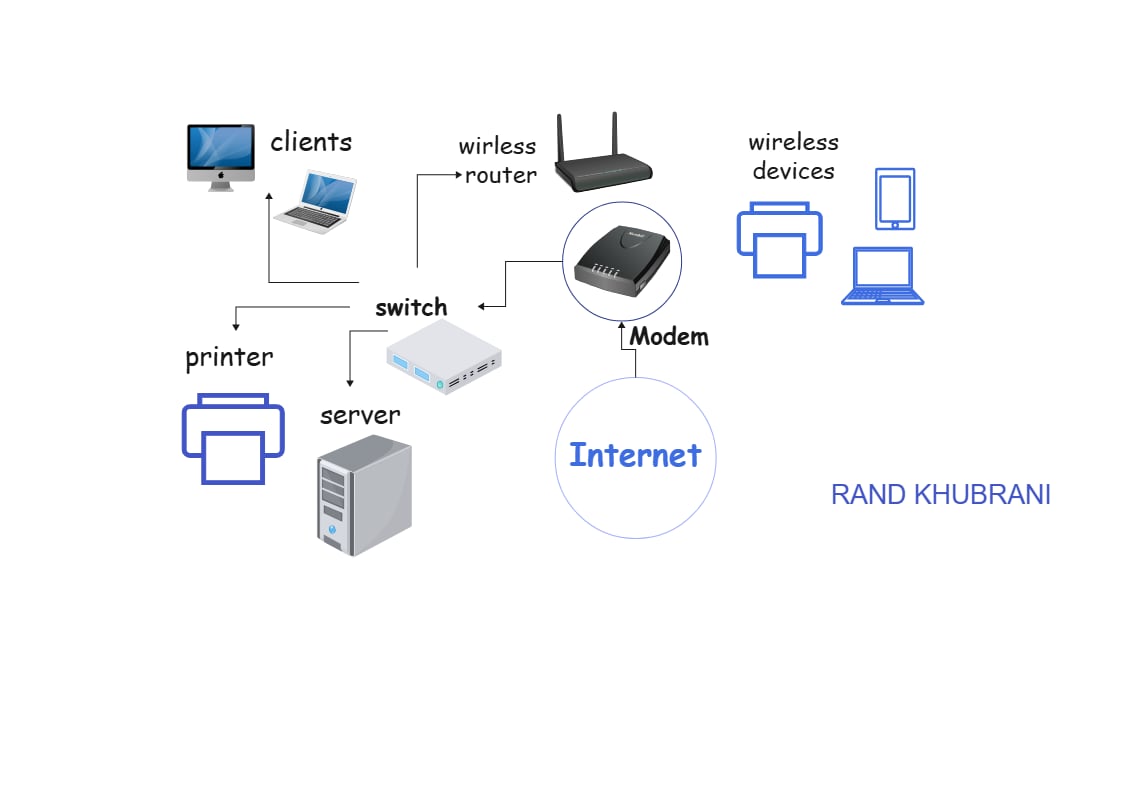
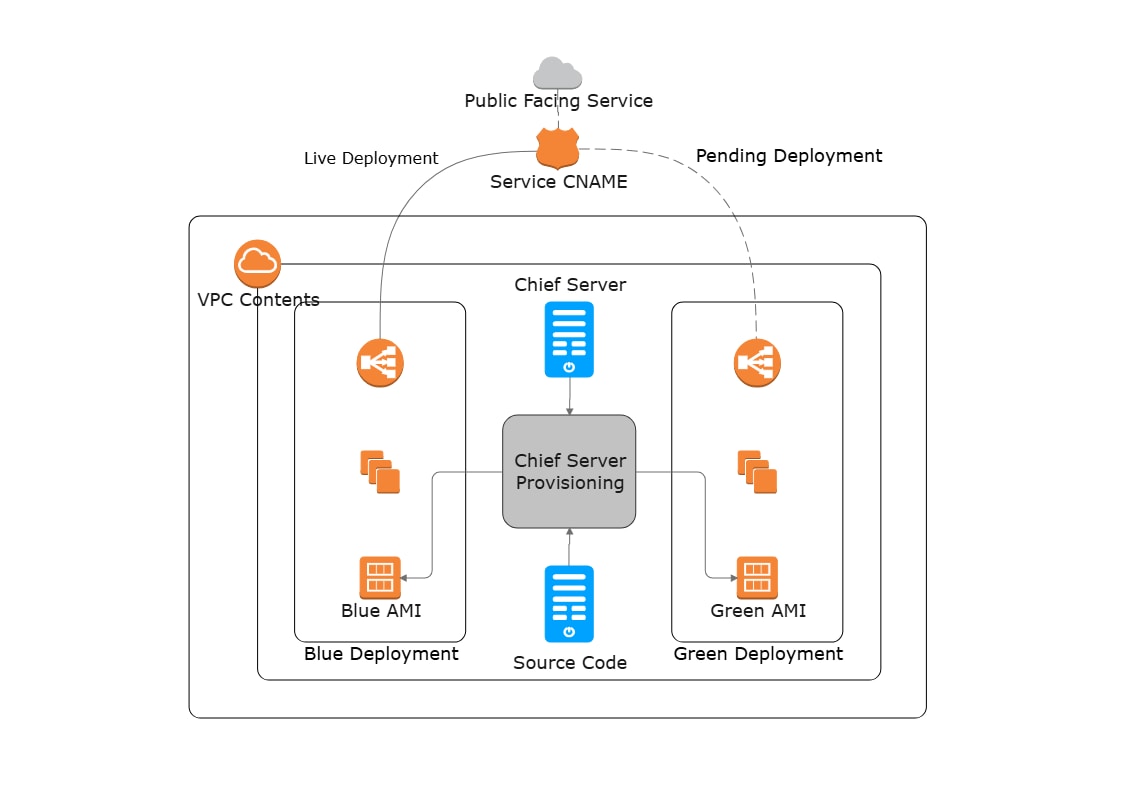
Architecture and documentation value
Beyond identifying the services, the diagram helps users communicate how the wider analytics environment is organized. This is useful because data-platform work often depends on diagrams that multiple teams can use for planning, explanation, and review.
- Useful for planning, explanation, and technical alignment
- Supports clearer cross-team discussion
- Helps make the architecture reusable as a reference
FAQs about this Template
-
What is Azure Synapse?
Azure Synapse is Microsoft’s analytics service for combining data integration, warehousing, and large-scale analysis in one environment. Teams use it to connect multiple data sources, process large volumes of information, and support reporting or advanced analytics workflows.
-
What does an Azure Synapse diagram show?
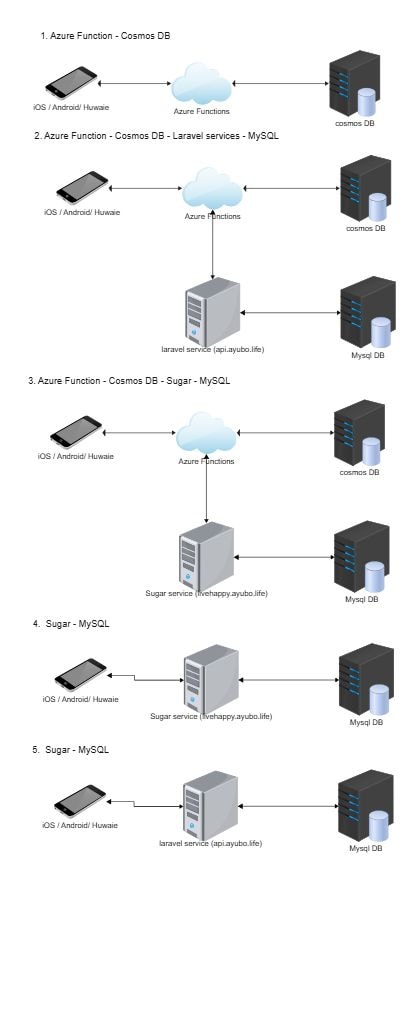
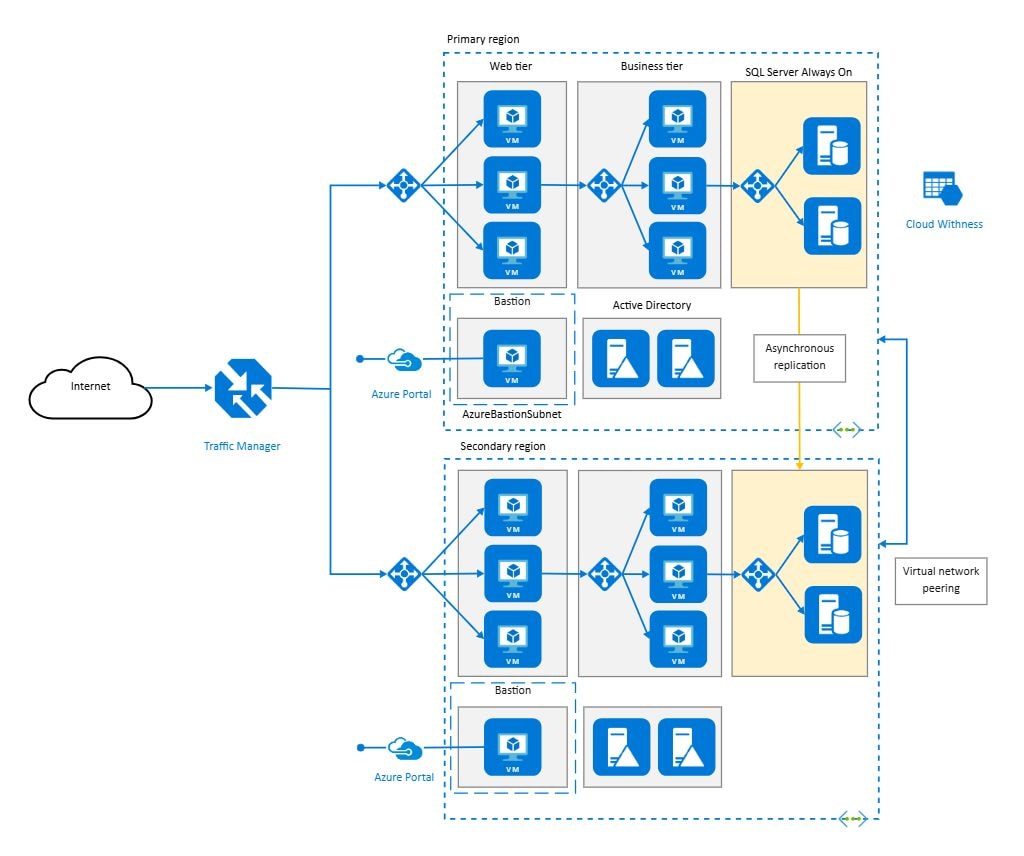
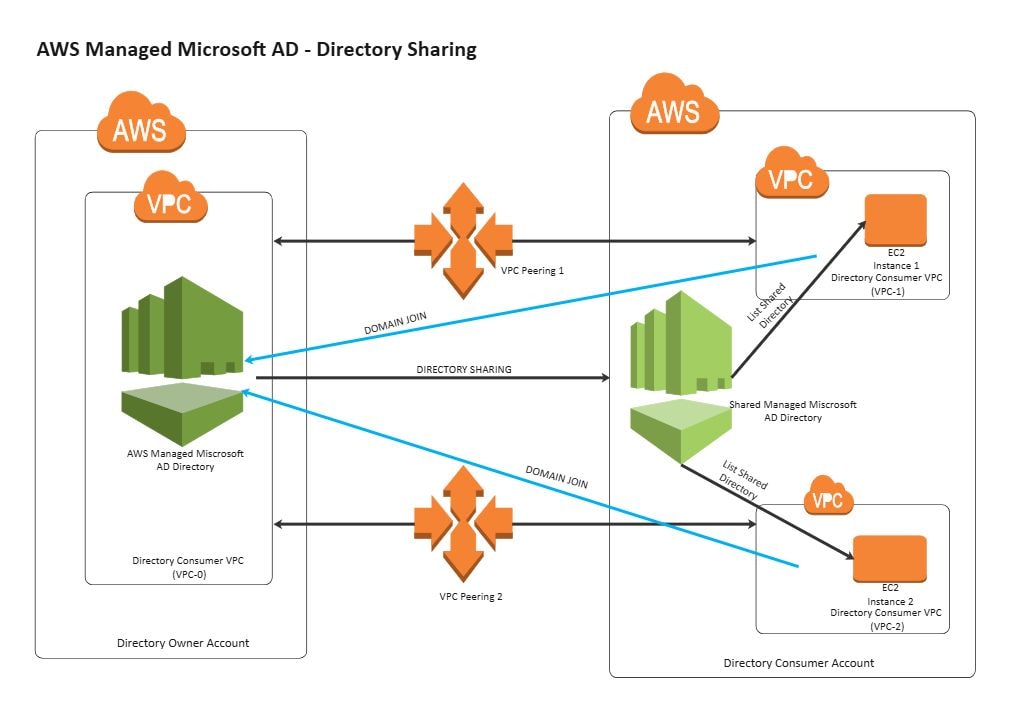
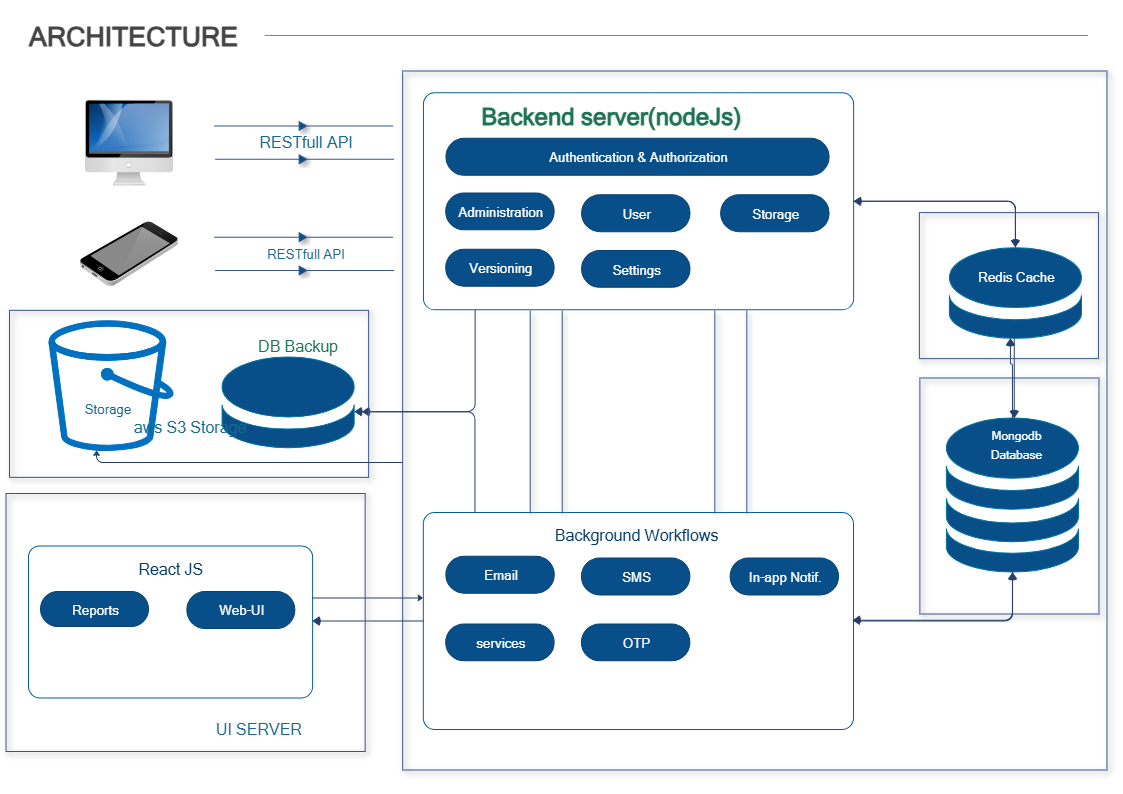
An Azure Synapse diagram usually shows how data sources, pipelines, analytics components, storage, and reporting layers connect inside a data architecture. It helps teams explain the movement of data and the role of Synapse in the wider analytics environment.
-
How do you create an Azure Synapse architecture diagram?
To create an Azure Synapse architecture diagram, identify the main data inputs, processing steps, storage layers, analytics services, and reporting outputs first. Then arrange them so the diagram clearly shows how data flows through the system from source to analysis.
-
What is the difference between Azure Synapse and cloud architecture?
Azure Synapse is a specific analytics platform inside Microsoft’s cloud ecosystem, while cloud architecture is the broader design of cloud systems and services. One focuses on analytics workflow and data processing, while the other describes the overall cloud structure.