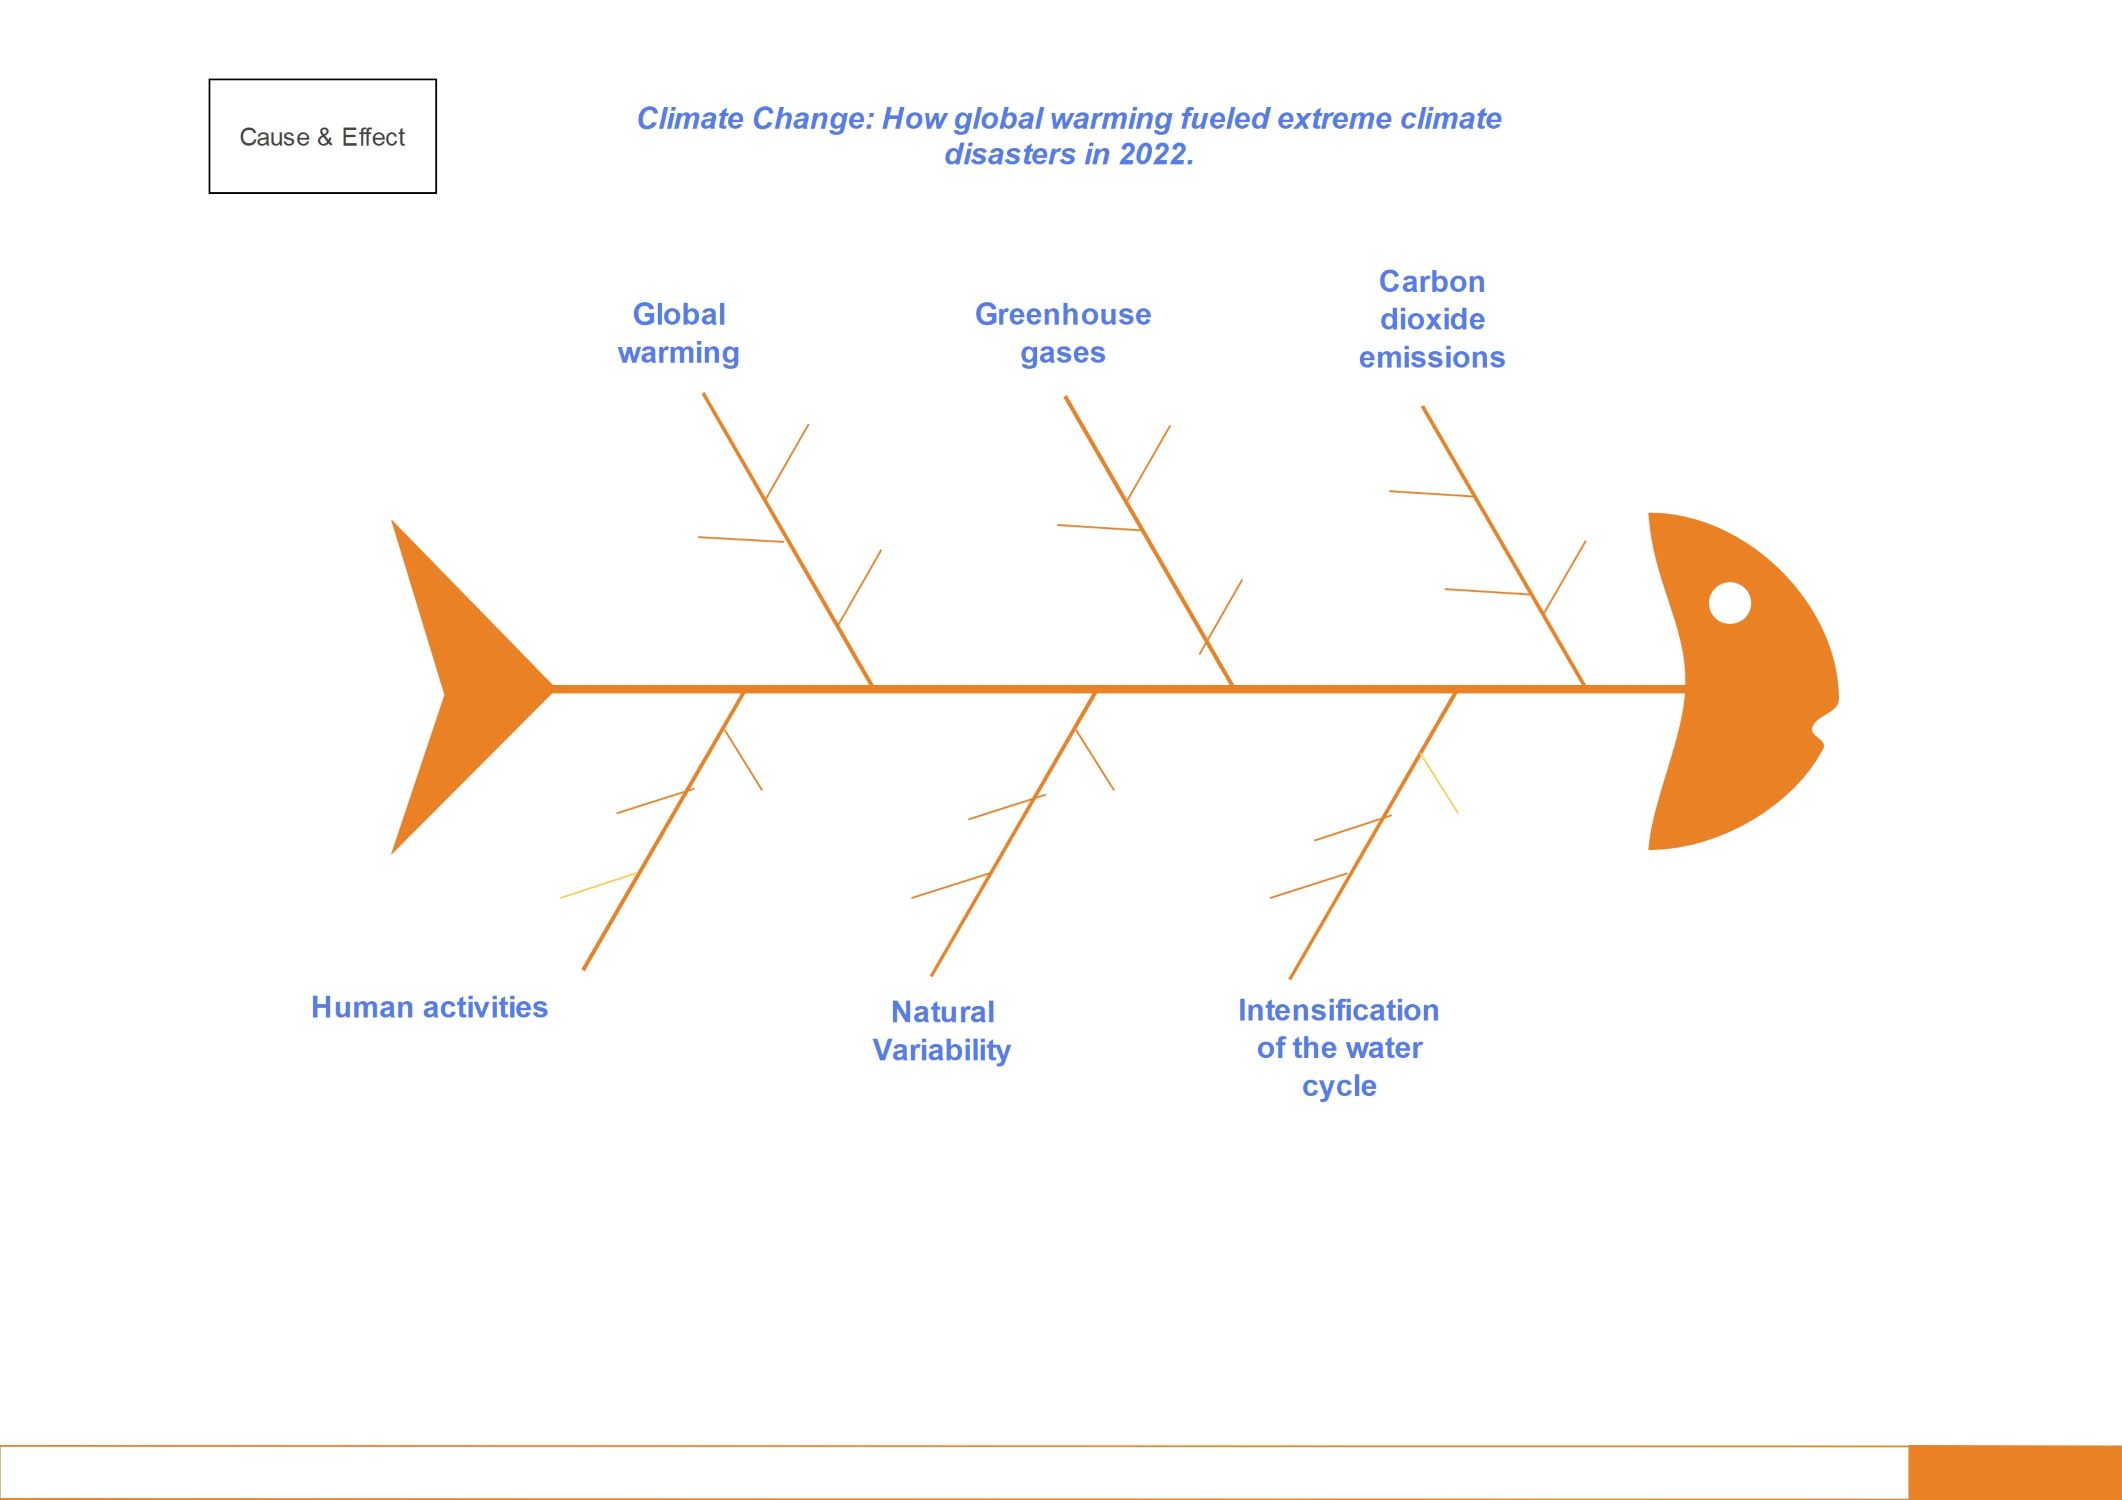
About this Climate Change Cause And Effect template
This fishbone diagram template helps you visualize the complex factors driving global warming. It identifies key causes and their resulting effects on the environment. It is a perfect tool for educational presentations, reports, and strategic planning.
Global warming
Global warming refers to the steady increase in the Earth's average surface temperature. This phenomenon is a primary driver behind the significant shifts in weather patterns and the melting of polar ice caps.
- Rising average temperatures
- Melting glaciers
- Rising sea levels
Greenhouse gases
These gases trap heat in the atmosphere, creating a blanket effect that keeps the planet warm. While some greenhouse gases occur naturally, human actions have greatly increased their concentration, leading to severe impacts.
- Methane production
- Nitrous oxide
- Industrial chemical release
Carbon dioxide emissions
Carbon dioxide is the most prevalent greenhouse gas emitted through human activities. It remains in the atmosphere for a long time, causing continuous warming and contributing heavily to the ongoing global climate crisis.
- Burning fossil fuels
- Deforestation
- Industrial manufacturing
Human activities
Human actions are the leading cause of rapid climate changes observed today. From energy production to transportation, our daily choices and industrial practices significantly alter the chemical composition of the atmosphere and local ecosystems.
- Urbanization
- Agricultural practices
- Energy consumption
Natural Variability
Natural processes also play a role in changing the climate over long periods. These include changes in solar energy and volcanic activity. However, these factors alone cannot explain the rapid warming trends seen recently.
- Volcanic eruptions
- Solar radiation cycles
- Ocean currents
Intensification of the water cycle
A warmer atmosphere holds more moisture, which leads to more intense rainfall and evaporation. This process disrupts normal weather patterns, causing more frequent and severe floods as well as prolonged periods of drought.
- Extreme rainfall
- Severe droughts
- Flash floods
FAQs about this Template
-
What is the primary cause of climate change?
Most scientists agree that human activities are the primary cause of recent climate change. The burning of fossil fuels like coal, oil, and gas releases significant amounts of greenhouse gases into the atmosphere. These gases trap heat, causing the planet to warm up. Other contributing factors include large-scale deforestation and various industrial processes that release harmful chemicals.
-
How does global warming affect our daily lives?
Global warming impacts daily life through more extreme weather events like heatwaves, hurricanes, and heavy rain. These events can damage homes, disrupt food supplies, and increase health risks for many people. Additionally, rising sea levels threaten coastal communities, while shifting climate zones can affect the types of plants and animals that can survive in specific regions.
-
Can we stop or reverse the effects of climate change?
While we may not be able to reverse all damage, we can certainly slow down the process. By transitioning to renewable energy sources like wind and solar, we can significantly reduce carbon emissions. Protecting forests and adopting sustainable farming practices also help absorb existing greenhouse gases. Taking collective action today is essential to prevent the most catastrophic future outcomes.