


Creating a pie chart in PowerPoint is a great way to visually present data during presentations. Pie charts are useful for showing proportions and comparisons in data, making it easier for your audience to understand complex information. In this guide, we'll show you step-by-step how to make pie charts in PowerPoint.
Whether you're new to data visualization or want to improve your presentation skills, this tutorial will help you create engaging and informative pie charts that captivate your audience. Let's get started on making your PowerPoint presentations more effective with pie charts.
In this article
Part 1. How To Create a Pie Chart in PowerPoint?
Microsoft PowerPoint is a widely recognized application known for its versatility. While often associated with creating presentations, it goes beyond slideshows. This section will guide you through creating informative pie charts using PowerPoint's robust charting features.
Beyond the art of creating impactful slides, PowerPoint offers powerful tools for creating various visual aids, including informative and illustrative charts like pie charts are essential tools for conveying proportions within data. With PowerPoint's intuitive interface and dedicated charting tools, the process of constructing these charts is seamless.
If you're ready to explore PowerPoint's charting features, you're in the right place. Start building your pie charts by following the steps below:
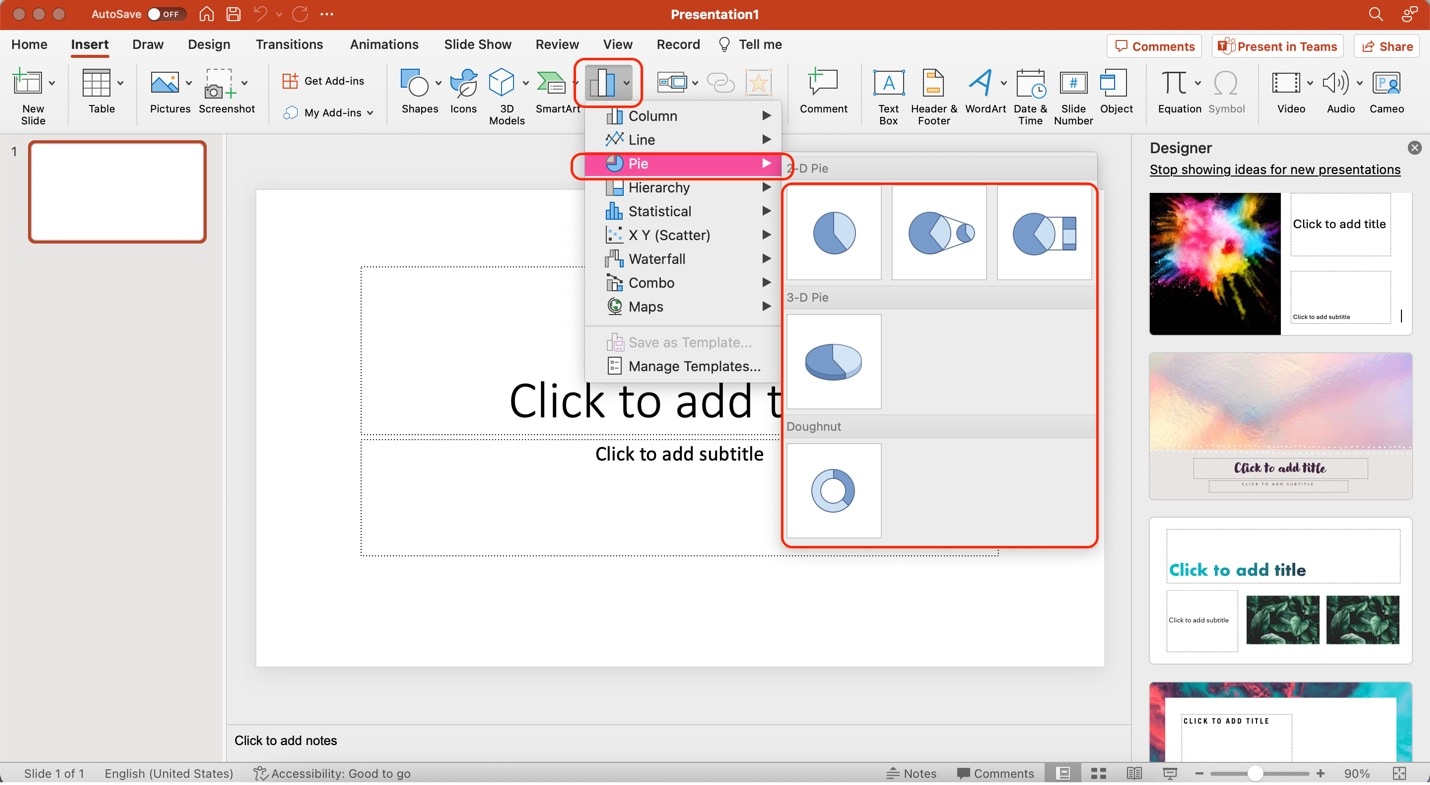
Step 1. Launch PowerPoint and create a new presentation. On the main toolbar, click Chart. Then, click Pie. Choose a pie chart template from the provided options under Pie.
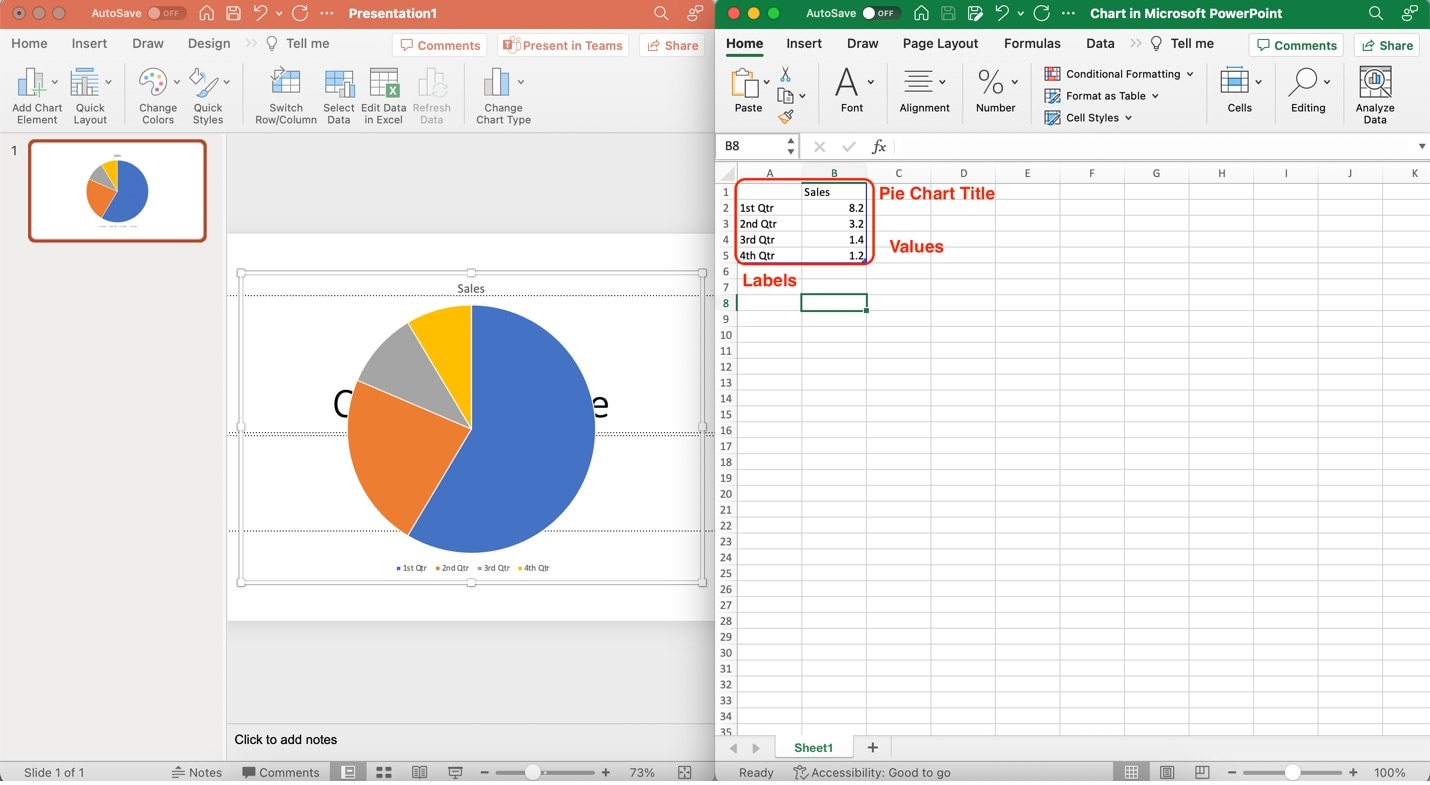
Step 2. Microsoft will automatically launch a separate Excel sheet. Edit the labels, values, and pie chart title using the spreadsheet provided.
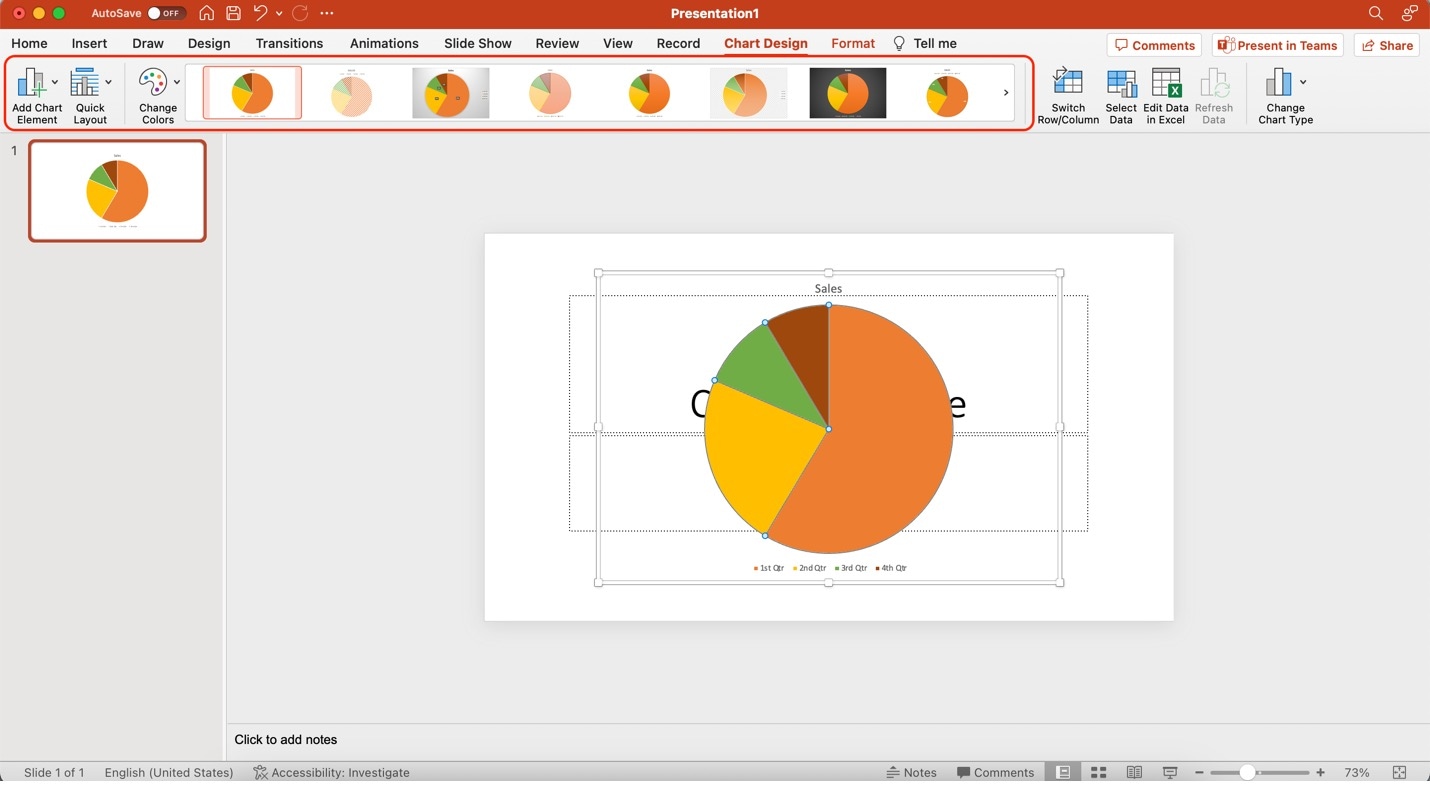
Step 3. Customize the appearance of your pie chart. Use the customization options under the Chart Design tab.
Part 2. Make a Pie Chart With Wondershare EdrawMax: Easier and Faster
As you've seen earlier, Microsoft PowerPoint can easily create pie charts. However, if you need a professional diagram maker to create visually appealing pie charts, consider, Wondershare EdrawMax, which stands out as a comprehensive and user-friendly diagramming tool. It has an amazing toolbox of features, including:
- Rich Templates. You can access a variety of professionally designed templates tailored for different charting needs.
- Drag-and-Drop Interface. Effortlessly arrange chart elements using an easy-to-use drag-and-drop interface.
- Customization. Enjoy a high degree of flexibility in customizing your pie chart's appearance and details.
- Intuitive User Experience. EdrawMax's user-friendly interface makes it accessible for charters of all skill levels.

Creating pie charts in EdrawMax offers distinct advantages over PowerPoint. Beyond its ease of use, EdrawMax provides a wide range of built-in templates designed to suit various purposes. This empowers you to effortlessly select the perfect template for your data representation needs. EdrawMax's highly customizable templates also ensure that your pie chart aligns with your vision.
How To Create Pie Charts With EdrawMax
Using EdrawMax is a step toward enhancing your chart creation experience. The simplicity and ease of use that EdrawMax brings makes it a great addition to your toolkit. Follow the steps below to begin:
Step 1: Download, install, and launch EdrawMax. Log in with your Wondershare ID or an account on Google, Facebook, or Twitter.
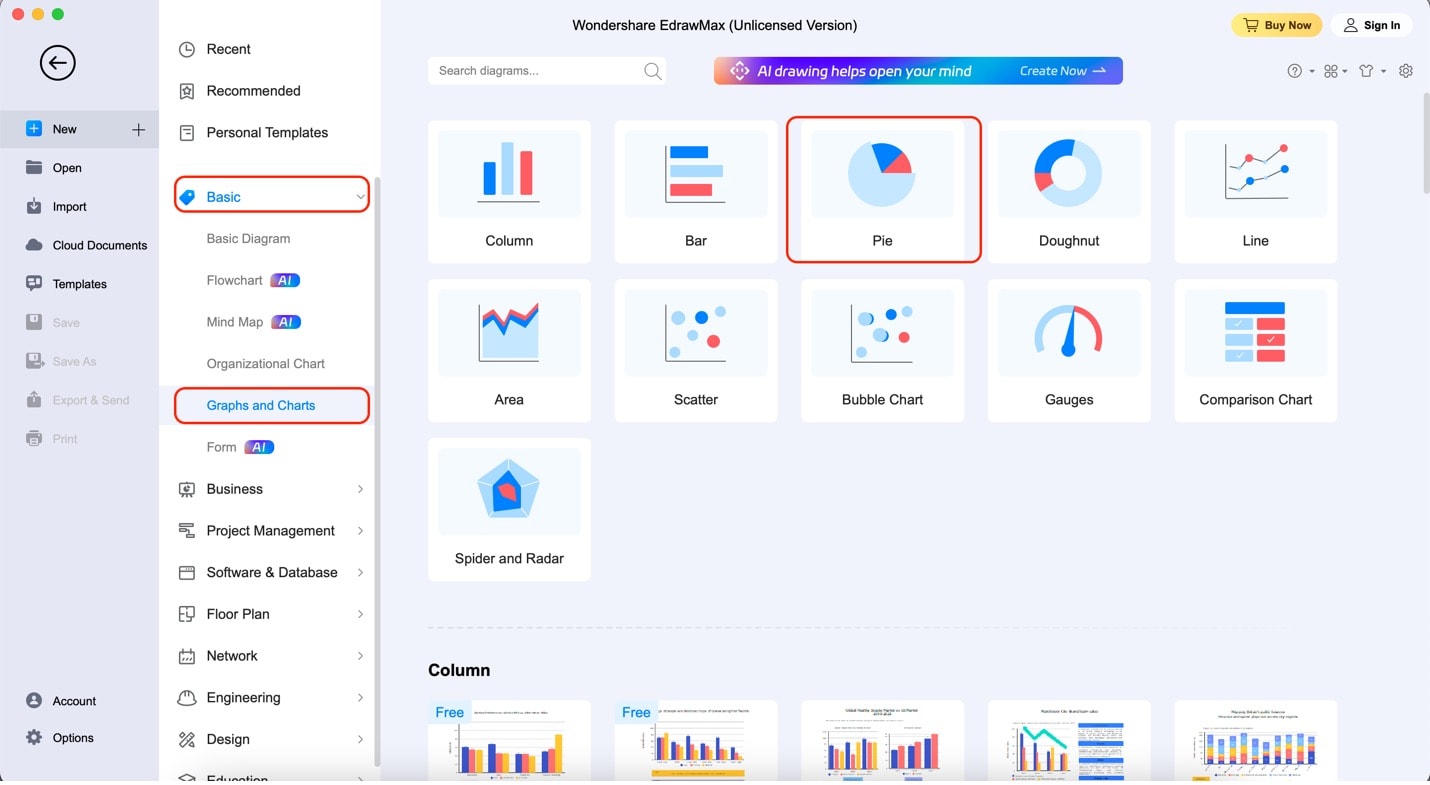
Step 2: After launching the app, click Basic. Then, click Graphs and Charts. On the provided templates, click Pie.
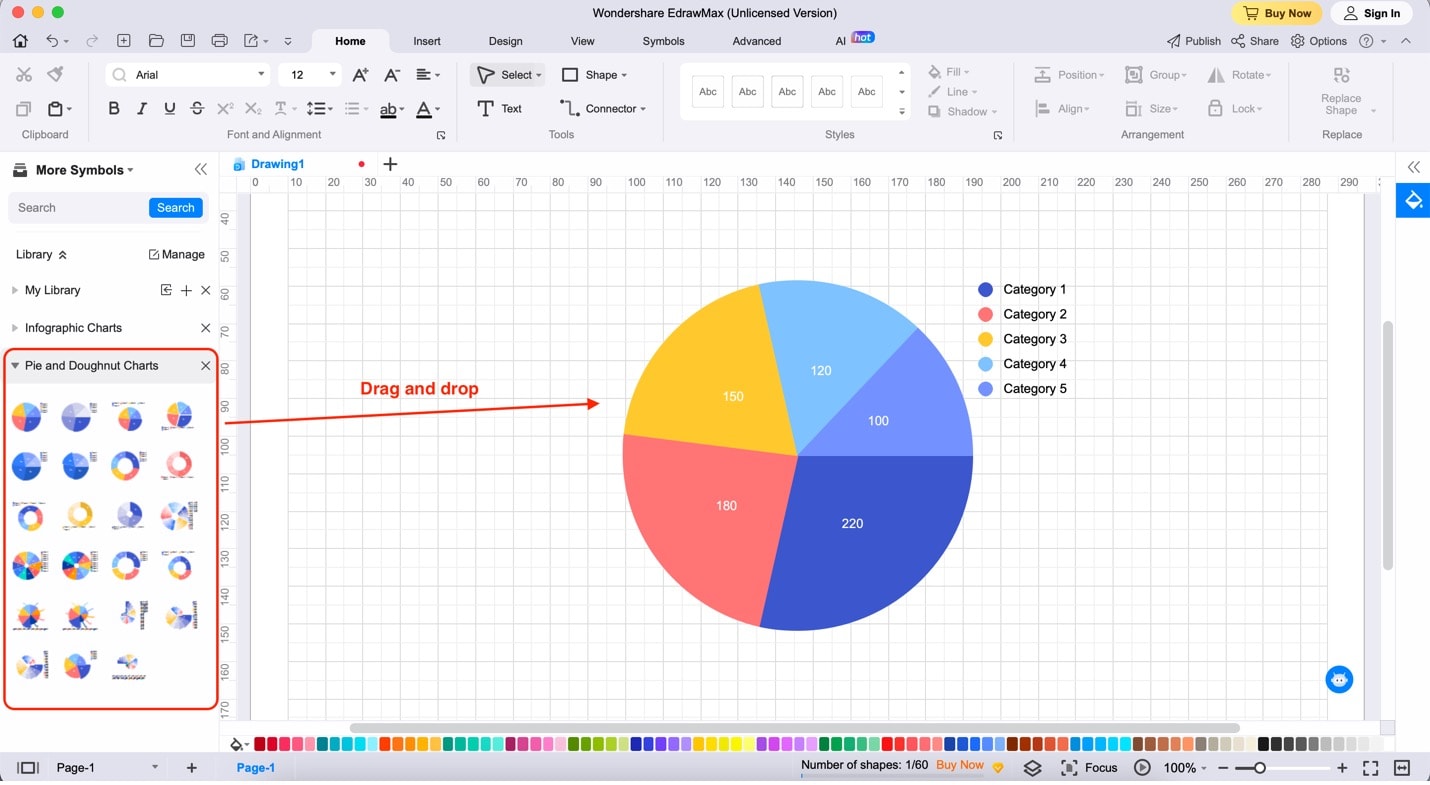
Step 3: Drag and drop any pie chart templates from the left panel to the canvas.
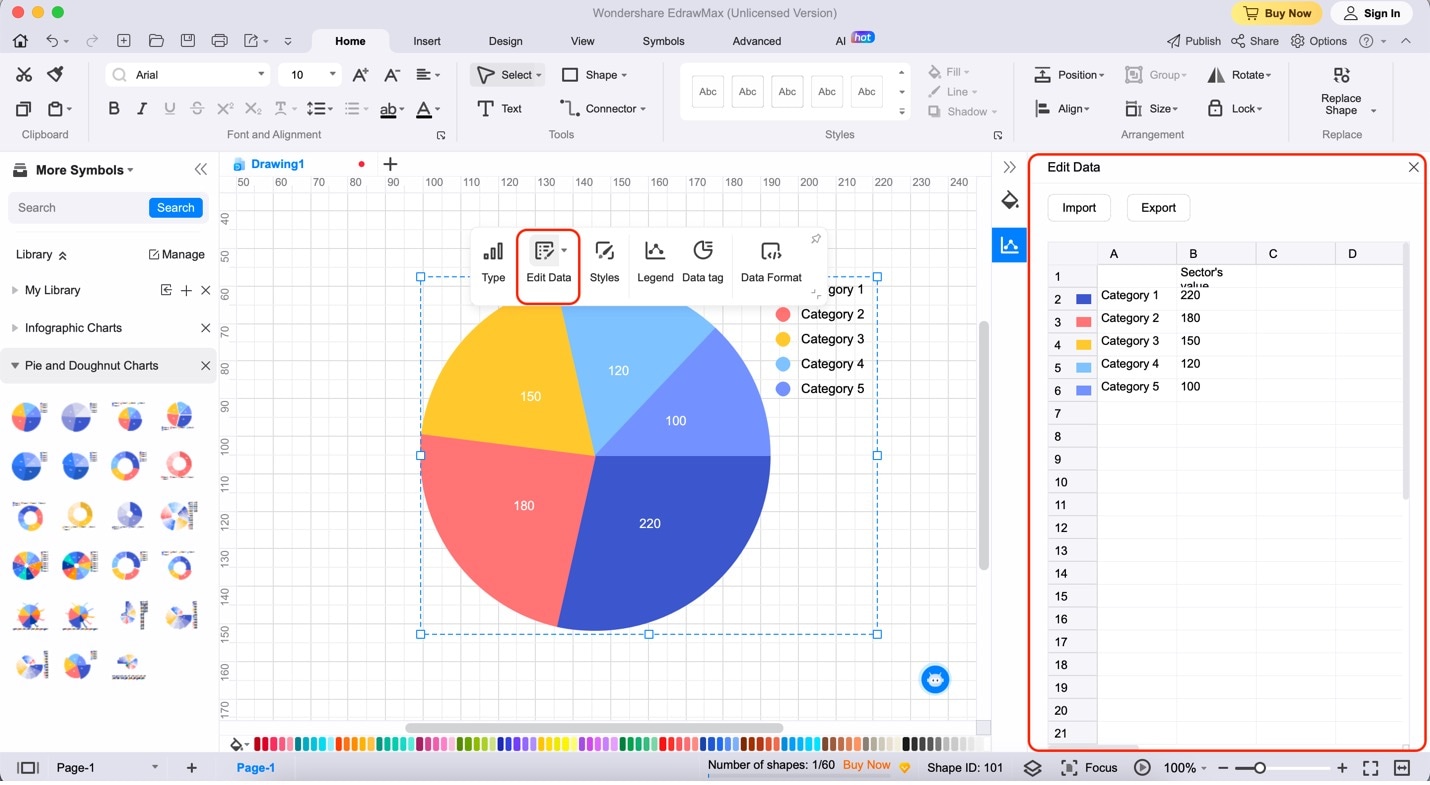
Step 4:To begin adding data to your chart, click the pie chart. Then, select Edit Data on the customization bar. Edit the data names by editing the texts under Cell A. Add values to your chart by changing the numbers under Cell B. Then, change the colors of each pie chart slice by using the color boxes beside the rows.
Part 3. Free Templates To Help You Get Started
If you're having difficulty starting your pie charts, EdrawMax's Template Community comes to the rescue. With many ready-made examples, crafting your charts becomes even more convenient. Explore some pie chart templates that are perfect for various scenarios:
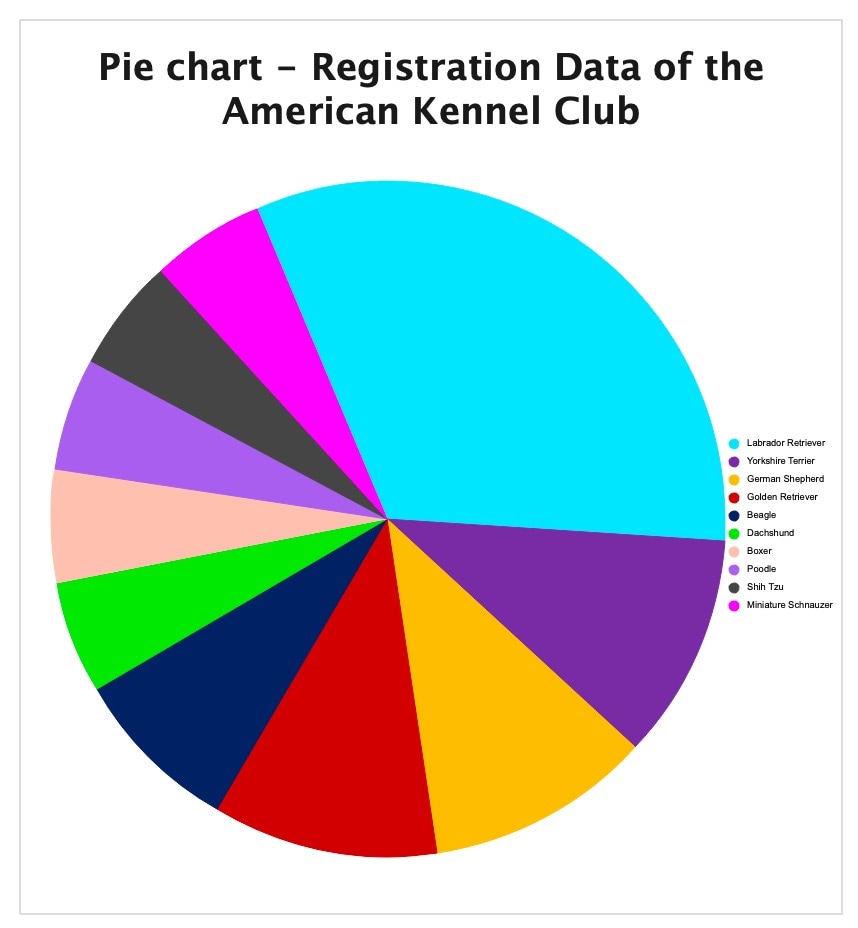
Dog Club Registration Pie Chart
This template showcases the distribution of dog breeds registered within a dog club. Each slice represents a breed, and the size corresponds to the percentage of registrations. This pie chart helps visualize the popularity of different dog breeds among club members.
School Subject Preference Pie Chart
In this template, the pie chart depicts the preferences of students when it comes to school subjects. The slices represent various subjects, with their sizes reflecting the students' likings. This chart provides insights into the subjects most loved by the student population.
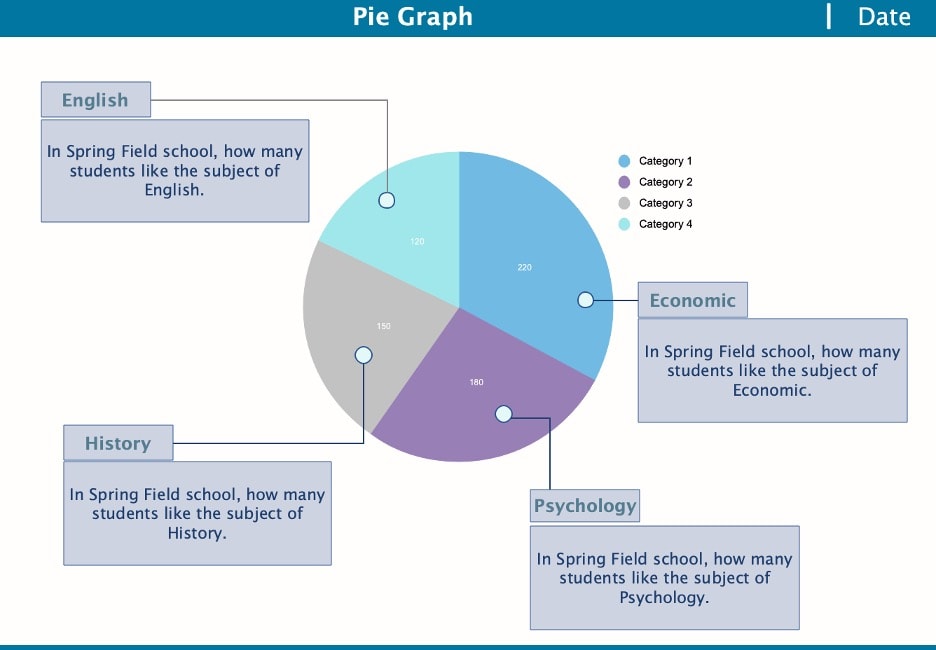
Infographic Pie Chart
The Infographic Pie Chart template adds informative text beside each slice. This additional information explains the data behind each slice. It offers a comprehensive understanding of the chart's content. This template is ideal for presenting data-rich insights in a visually engaging manner.

These templates serve as starting points for your pie charting endeavors. They also illustrate the versatility of EdrawMax's Template Community. Find inspiration for your other diagramming needs through this unique community.
Part 4. Tips for Creating Pie Charts in PowerPoint
Crafting effective pie charts in PowerPoint involves more than just adding slices. Here are some simple yet powerful tips to enhance your pie chart presentations:
Adding Concise Labels
Ensure your labels are clear and succinct. Label each slice with its corresponding data percentage or value, making it easy for viewers to grasp the information at a glance.
Using Distinct and Unique Colors
Opt for distinct colors for each slice to enhance clarity. Unique colors make your pie chart visually appealing and aid in distinguishing different segments effortlessly.
Utilizing Other Microsoft Office Apps
Consider the power of integration. Utilize Microsoft Office apps like Excel to manage your data efficiently before creating the pie chart in PowerPoint. This integration streamlines your workflow and ensures accurate information representation.
Exporting Pie Chart From EdrawMax To Make Things Easier
While creating pie charts in PowerPoint is possible, using specialized tools can enhance your charting experience. EdrawMax can easily create intricate pie charts. Then, you can seamlessly export them to PowerPoint for a polished presentation. This approach combines the strengths of both applications, resulting in visually beautiful and informative pie charts.
Conclusion
Creating pie charts in PowerPoint is possible because of the program's flexibility. Through this article, you've learned how to create pie charts with them. You also learned what makes PowerPoint a popular companion for different needs.
As you've navigated through these, you've also learned that EdrawMax is your reliable companion. Its advanced features, diverse templates, and intuitive interface improve your charting skills. Give EdrawMax a try and unlock a world of possibilities in crafting compelling and insightful pie charts.
AI Diagram Generator
Enter your prompt. Upload files if needed. Generate diagrams, charts, or slides instantly.


