


In the world of engineering and design, simplifying complex systems is essential. That is where functional block diagrams come in – they're like keys that help us understand how things work. Engineers, architects, and designers use these diagrams to show how different system parts interact. Functional block diagrams are helpful for everything from factories to software design.
So here we will dive into functional block diagrams, explaining what they are, why they're helpful, and how to make them. We'll see how these diagrams are used in different industries to understand complex systems, work together in teams, and create clear abstract ideas.

 below.
  below.
 In this article
Part 1. What is a Functional Block Diagram?
At its core, a functional block diagram is a visual representation that encapsulates the interconnections and interactions between various functions within a system. It is a dynamic blueprint that simplifies complex processes by breaking them down into manageable, functional blocks, each representing a specific operation or task.
These blocks are interconnected through lines, demonstrating the data flow or control between them. This graphical representation is a universal language, transcending barriers and allowing engineers and designers to communicate ideas efficiently.
Importance and Benefits of Using Functional Block Diagrams
The significance of functional block diagrams extends across diverse industries. They streamline the design, analysis, and troubleshooting processes by providing a clear overview of a system's functions and relationships. These diagrams enhance communication between multidisciplinary teams, enabling a shared understanding of complex systems. Engineers can identify bottlenecks, potential errors, and optimization opportunities early in the design phase. Additionally, functional block diagrams aid in documentation, making it easier to convey system architecture to stakeholders, clients, and future developers.
Part 2. Elements of a Functional Block Diagram
Function Blocks: These are the building blocks of the diagram, each representing a distinct function or operation. They are often depicted as rectangles with labels describing the process they embody.
Arrows and Lines: The connections between function blocks are represented by arrows or lines. These illustrate the data, signals, or control flow between different functions. The direction of the arrow indicates the flow's path.
Input and Output: Each function block usually has inputs and outputs represented as connection points. Inputs are the signals or data required to operate, and outputs are the results produced by the process.
Interfaces: Interfaces display how function blocks interact with each other. They provide insights into the type of communication between functions, whether it's data transfer, control signals, or feedback loops.
Annotations and Labels: Text annotations and labels provide context and descriptions for function blocks and connections, ensuring clarity in understanding.
Feedback Loops: In some diagrams, feedback loops can be incorporated, illustrating how outputs from certain blocks influence the behaviour of others, creating a dynamic and interconnected system.
Hierarchy and Organization: Functional block diagrams can have hierarchical structures, where higher-level functions are decomposed into sub-functions, clearly representing system complexity.
Part 3. Three Examples of Functional Block Diagrams
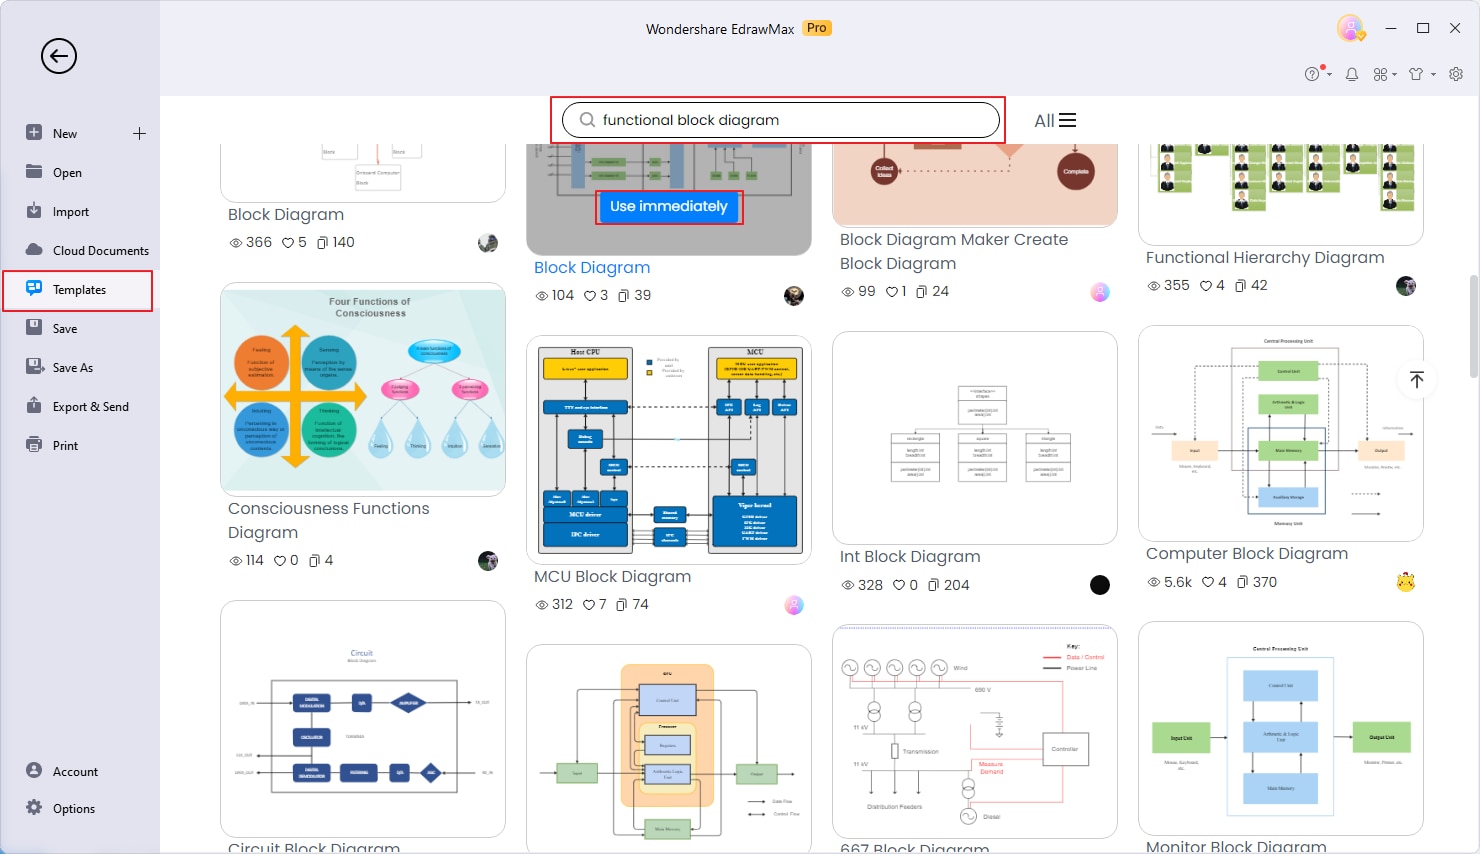
Discover the power of functional block diagrams through the lens of EdrawMax's vibrant templates community. Our platform hosts a plethora of helpful block diagram templates, each meticulously crafted to address a range of industries and applications. These diagrams are ready-made blueprints that streamline your design process and elevate your project's efficiency.
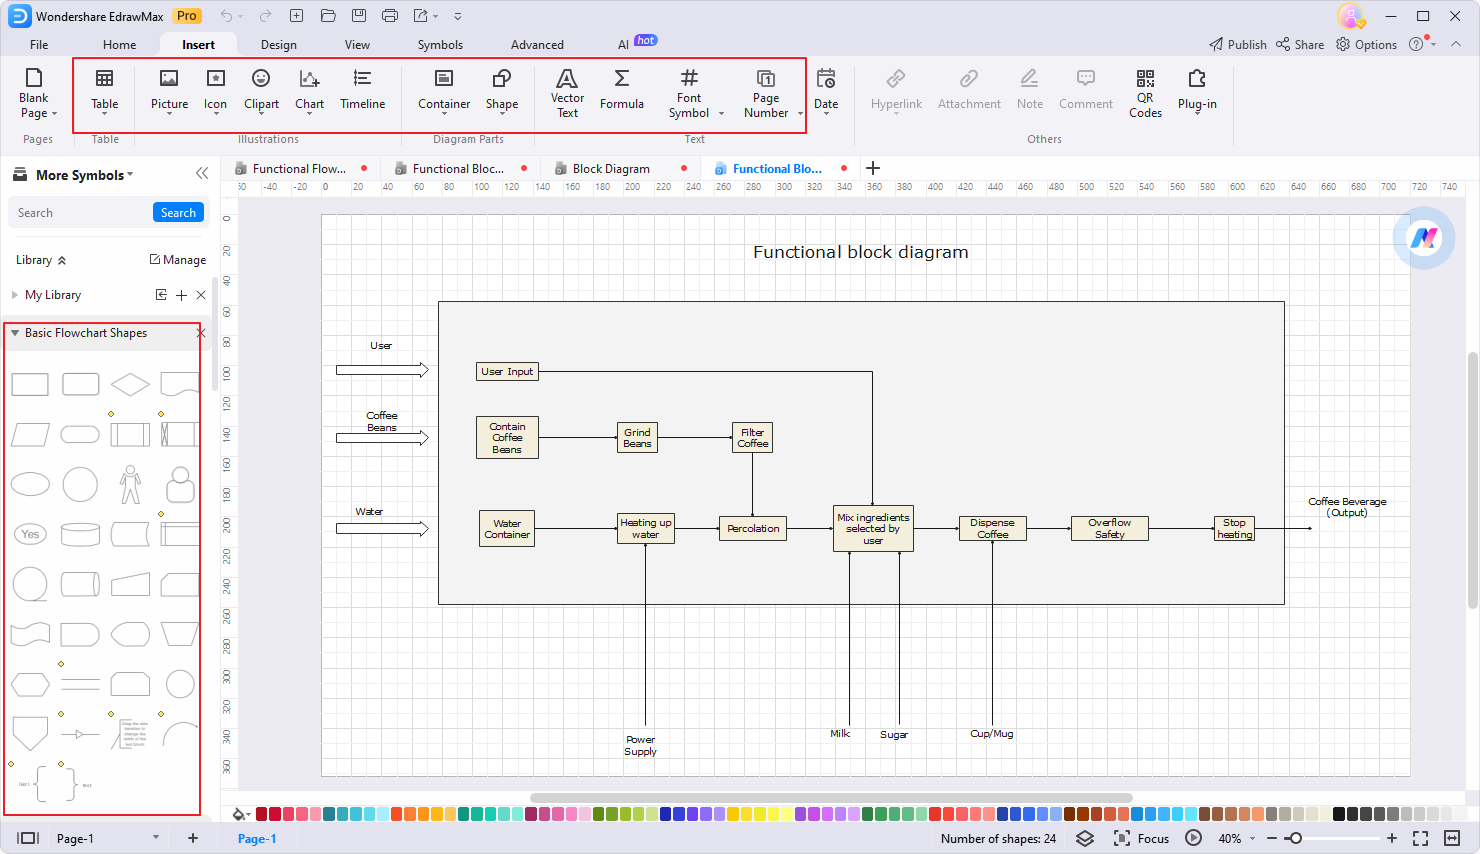
Example 1: Functional Block Diagram for Industrial Production
This functional diagram describes the manufacturing process of coffee production from coffee beans to beverage. It can be easily modified to represent the production process of other industrial products.

Example 2: Functional Block Diagram for District Planning
This functional diagram shows the construction planning of a district, each block representing an area the lines representing the the paths between different areas. You could use the block diagram to depict the layout of an area like a community, a factory, or a school.

Example 3: Functional Block Diagram for Machine Structure
This example shows the relationships between different components of a machine system, each block representing a part of the system like the condenser or the blower. The lines depict the relationship between the parts. An engineer could customize this diagram to describe the machine he develops.

Part 4. How to Create a Functional Block Diagram Within Minutes
Now if you are considering making a functional diagram yourself, you might need a professional diagram maker like EdrawMax. Even if you're a newcomer to diagramming, follow these steps to swiftly and effectively create a stunning functional block diagram:
Step1
Select a template. Begin by launching EdrawMax and exploring its diverse array of templates. To embark on your functional block diagram journey, choose a template that aligns with the scope and nature of your project.
Step2
Drag and drop functions. EdrawMax empowers you to design effortlessly using its intuitive drag-and-drop UI and symbol libraries. Begin by dragging function block shapes onto the canvas. Arrange these blocks in a logical sequence that reflects the flow of your system. You could also insert cliparts, icons, and other objects through the Insert menu on the top navigation bar.
Step3
Personalize your design. EdrawMax's customization options allow you to tailor your diagram's appearance to match your project's aesthetic. Select colors, fonts, and line styles that resonate with your vision, ensuring your chart conveys information and looks visually appealing.
Step4
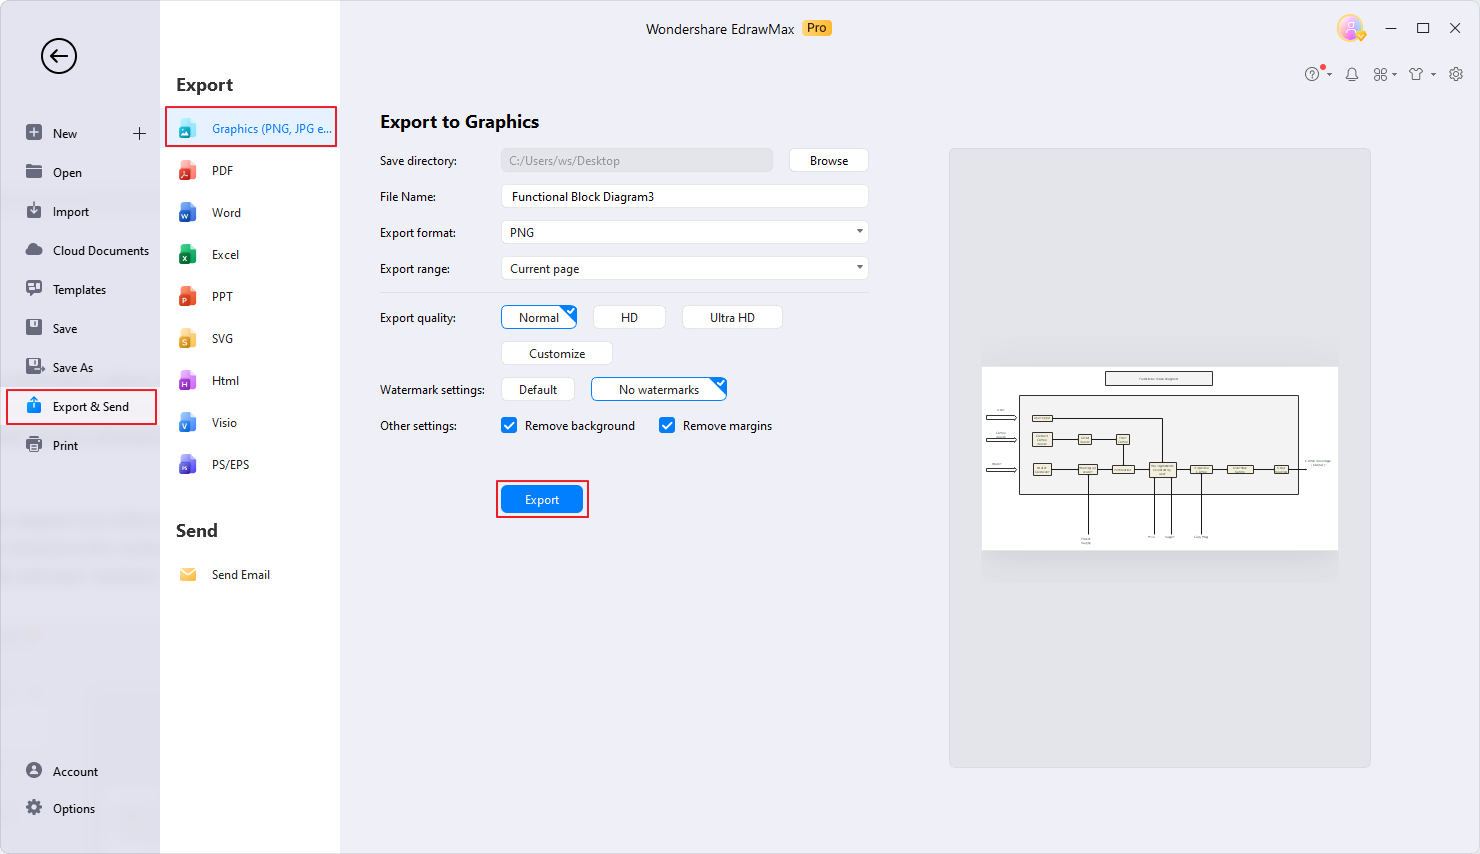
Save and share the diagram. Once your diagram truly reflects your concepts, save it in your preferred format. EdrawMax doesn't just streamline the creation process; it also facilitates collaboration. Share your chart directly with team members or stakeholders from the EdrawMax platform.
Why Choose EdrawMax?
EdrawMax is an exceptional choice for diagramming needs due to its holistic feature set and user-centric approach. Here's why:
- With a simple and intuitive UI, EdrawMax is a beginner-friendly tools you can easily get started with.
- EdrawMax fosters real-time collaboration and integrates seamlessly with cloud storage, making teamwork a breeze.
- It supports a variety of file export formats, making sharing designs a breeze.
- EdrawMax's extensive template library caters to diverse needs. You can easily get inspired with one of the professional made diagrams.
- Its drag-and-drop system empowers beginners and experts to design professional diagrams effortlessly.
Implementing these tips allows you to create workflow charts that effectively communicate processes. Remember, workflow charts promote collaboration and improve organizational efficiency. With EdrawMax's versatile features, you have the tools to take your workflow charts to the next level.
Part 5: Tips and Tricks for Making Professional Functional Block Diagrams
Improve your block diagram-making with these tips:
- Clarity is Key: Focus on communicating essential functions clearly while avoiding unnecessary clutter in your diagram.
- Flow Logic: Arrange function blocks logically to mirror the system's natural processes, enhancing understanding.
- Visual Harmony: Maintain a consistent color palette, font style, and symbol usage for a harmonious and professional-looking diagram.
- Labels and Annotations: Utilize clear labels and annotations to provide context and enhance comprehension.
- Whitespace Utilization: Embrace whitespace to improve readability and keep your diagram organized and visually appealing.
Conclusion
In a world where complex systems dominate industries, functional block diagrams are the universal bridge connecting ideas with understanding. Their significance spans diverse sectors, streamlining processes, enhancing collaboration, and facilitating efficient communication among multidisciplinary teams. And we have illustrated this with some typical examples in this article.
If you are considering making one yourself, why not try out EdrawMax? See how it brings convenience, creativity, and efficiency to your work. Turn complex ideas into clear visuals with EdrawMax. Use its power to transform your diagrams, making them transparent, collaborative, and innovative.
AI Diagram Generator
Enter your prompt. Upload files if needed. Generate diagrams, charts, or slides instantly.


