


In this article
Part 1. Introduction:
A Venn diagram is a graphic representation that shows the relationship between several sets or groups. Each circle in the pattern represents a set, and the overlapped area highlights the items in the Venn diagram sets. Venn diagrams offer a straightforward and comprehensible approach to representing the connections between sets. They help in understanding the interactions and variations among different groups.
In mathematics, physics, and literature, Venn diagrams are used to teach set theory and to show ideas. Venn diagrams are useful tools for knowledge organization and decomposition into more manageable components. They are used to examine social, cultural, and historical information, including discovering the shared passions of many groups of people.
Part 2. 10 Venn Diagram Examples
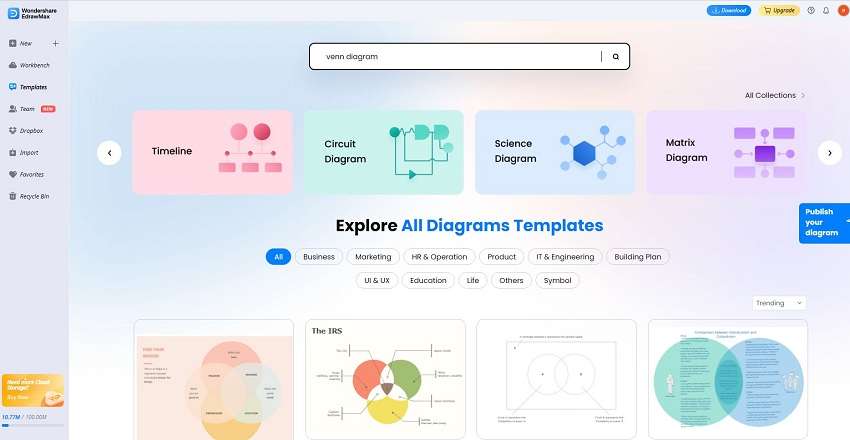
To understand the diagram further, let us take a look at 10 typical examples of 3-set Venn diagrams from EdrawMax, one of the best diagram makers. These examples cover various subjects such as business, health, and education. By analyzing these examples, we can understand the versatility and practicality of Venn diagrams. If you are interested in more examples, go to our Templates Community to find more.
1. Blank Venn Diagram
Below is a typical blank diagram template that offers a structure for classifying and contrasting various elements or groupings of data. The user can add information based on the topic or data. Showing the similarities or features between many solutions can help people make educated judgments.
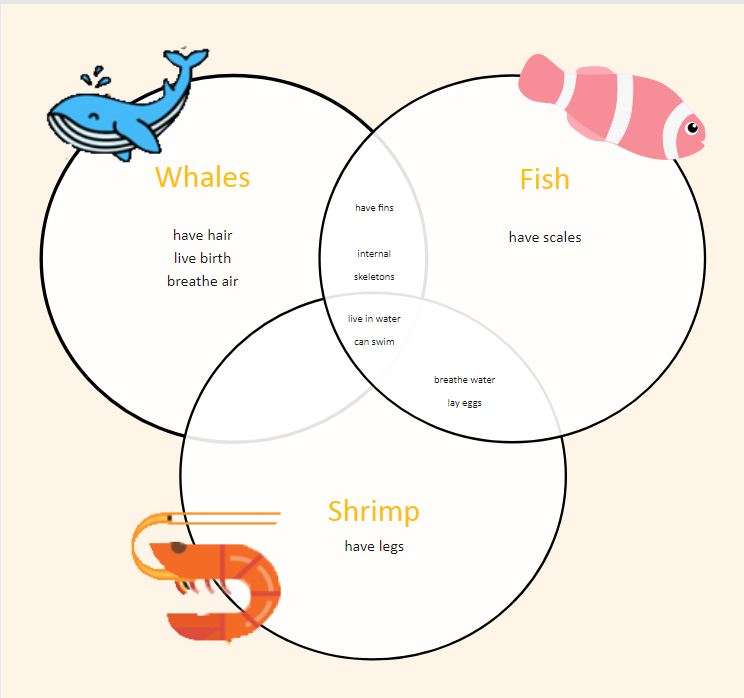
2. Venn Diagram for Animal Comparison
The Venn diagram below incorporates Whales, Fish, and Shrimp as the three sets with properties enlisted within the respective diagram. It also represents the commonalities between the three sets and also between the two sets separately.
In this Venn diagram, users can change the names and colors, rearrange the pieces, and see the intersections of overlapping lines in real-time. Users can also alter the items in the sets. For example, marketers can use this Venn diagram to comprehend the similarities and differences between different consumers groups.
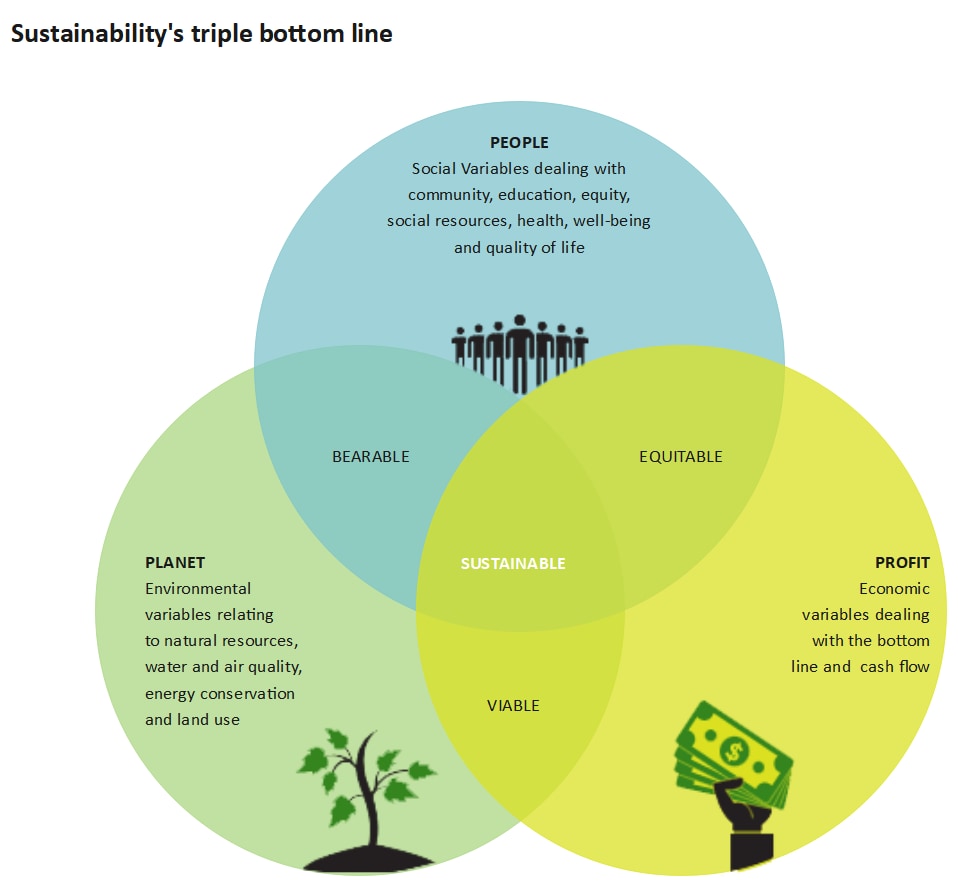
3. Venn Diagram for Sustainability Analysis
The Venn diagram example displays the relationship between the people, the planet, and the profit in making a sustainable development strategy. To balance the factor of the people and the planet, we need to make sure the strategy is bearable to environment. Similarly, it is important to design a viable strategy that guarantees equitable life for the same reasons.
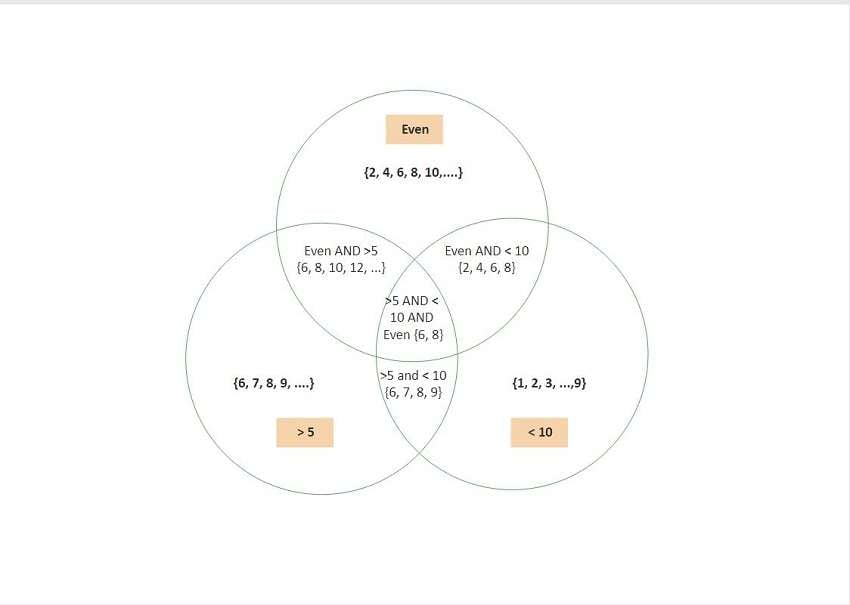
4. Venn Diagram for Number Analysis
In mathematics, a Venn diagram can show how several sets or groups of components relate to one another. The diagram can illustrate set operations like union, intersection, and complement. It may be used to describe the logical connections between different assertions or hypotheses and show how logical reasoning works.
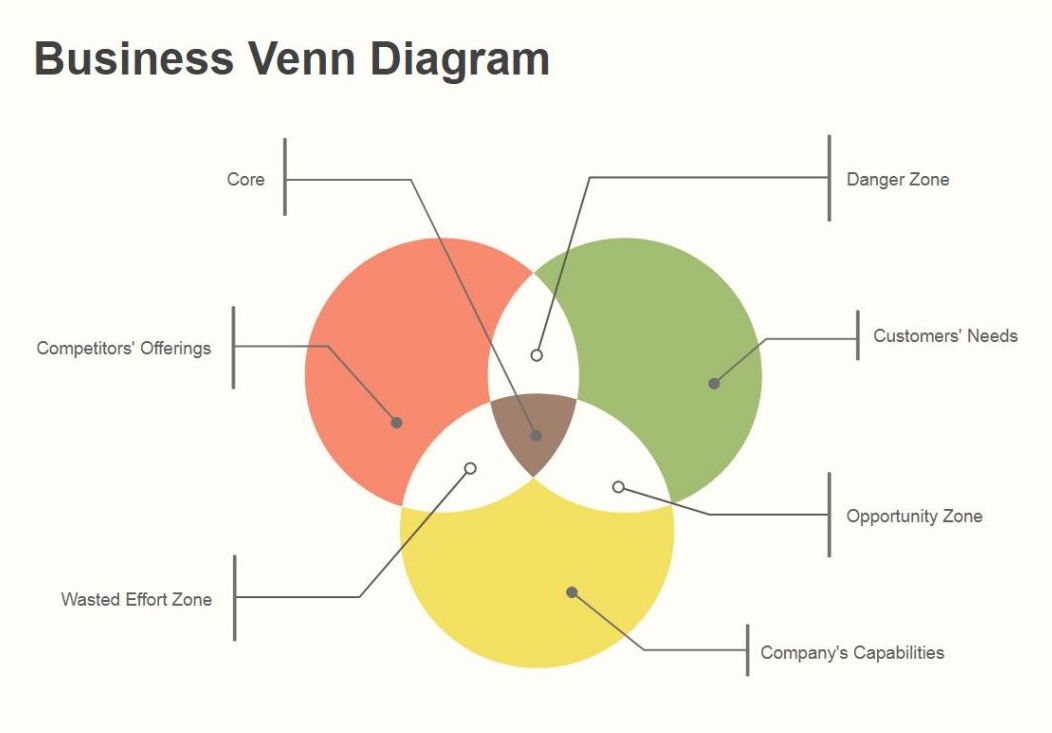
5. Venn Diagram for Business Analysis
The Venn diagram below is a graphic illustration that demonstrates the connections between elements like a company’s abilities, competitors’ offerings, and customers’ needs. It can show where a company can find the best development opportunities and where it would its time and efforts through analyzing the relationship of the three factors.
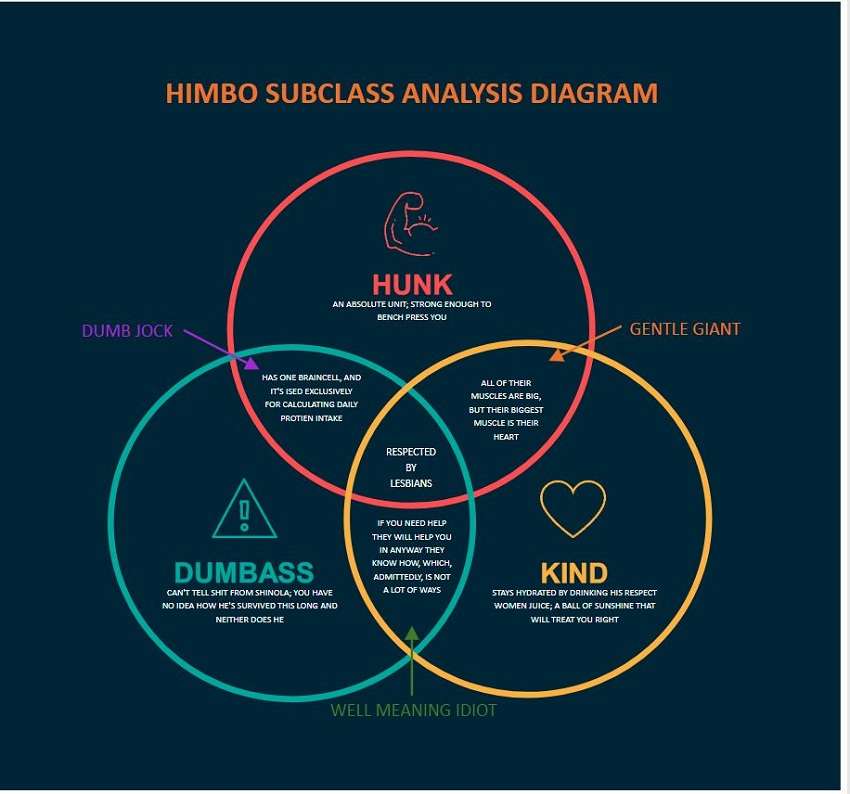
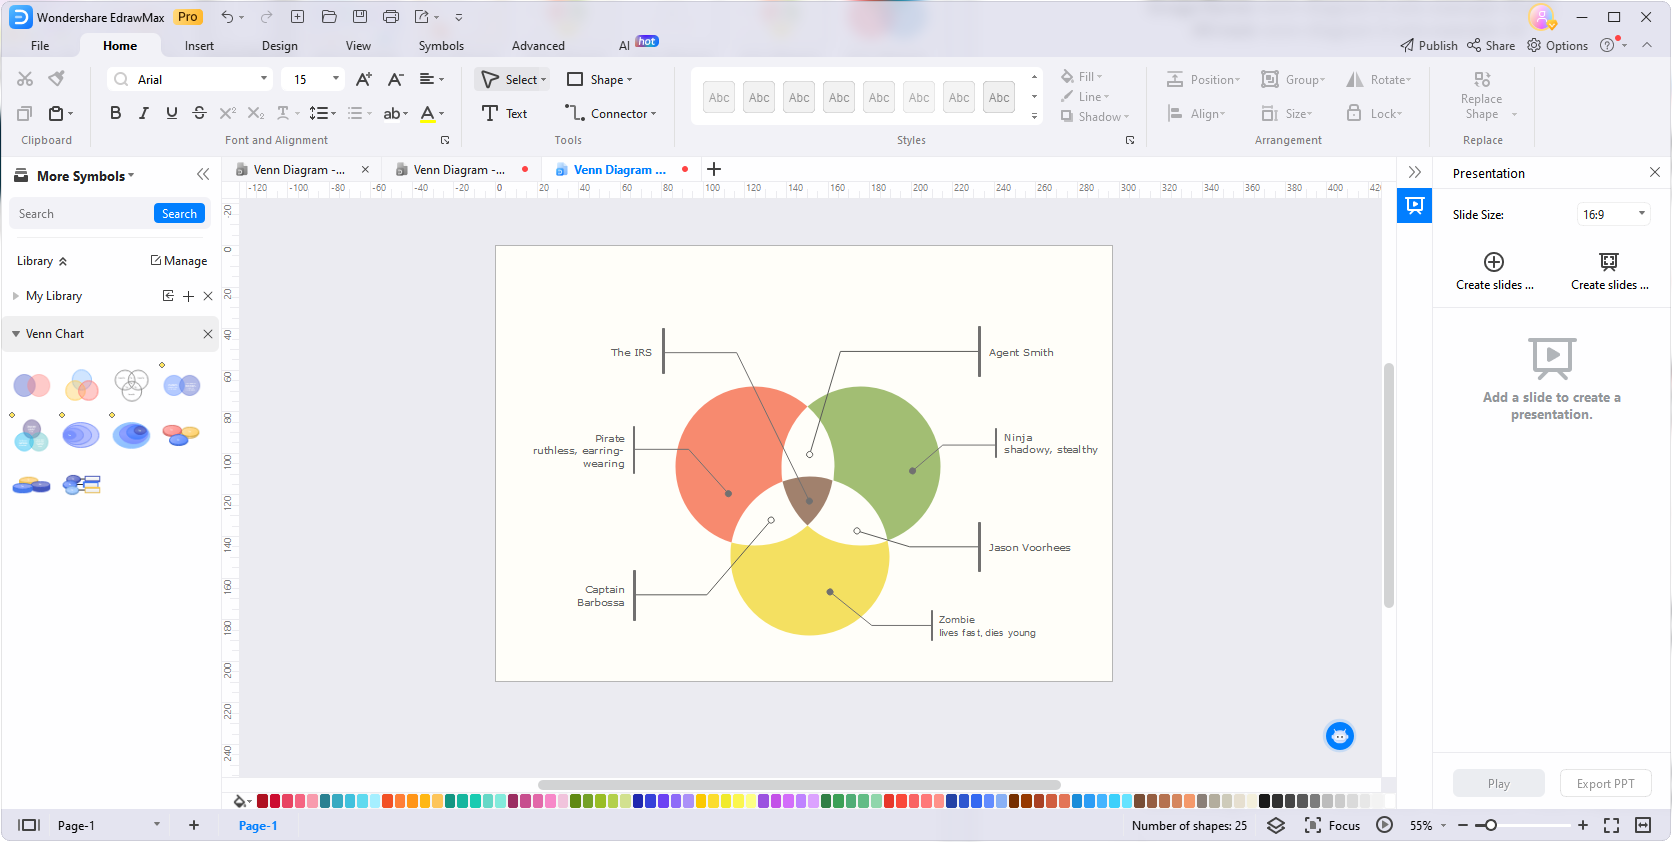
6. Himbo Venn Diagram
A hilarious or sarcastic representation of the "himbo" culture is the himbo Venn diagram. It may serve as a lighthearted example of how the phrases "nice person" and "dumbass" intersect, as well as other attributes or qualities connected to the stereotype of an elegant but foolish man.
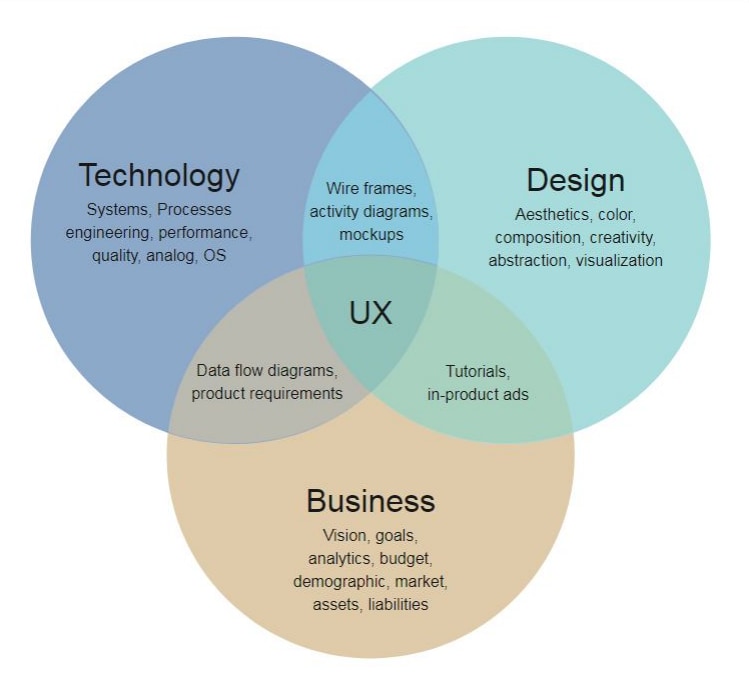
7. Venn Diagram for UX Analysis
Optimize your UX analysis with this Venn Diagram template. This versatile tool features three circles representing technology, design, and business, three respects that should be taken into account in UX design. Inside each aspect, there are some factors to consider. For example, for technology, you need to think about aesthetics, color, composition, creativity, abstraction and visualization. The intersection of two circles point out the issues which factors of both circles are related with. For instance, when designing Tutorial or in-product ads, you need to take into factors of design and business.
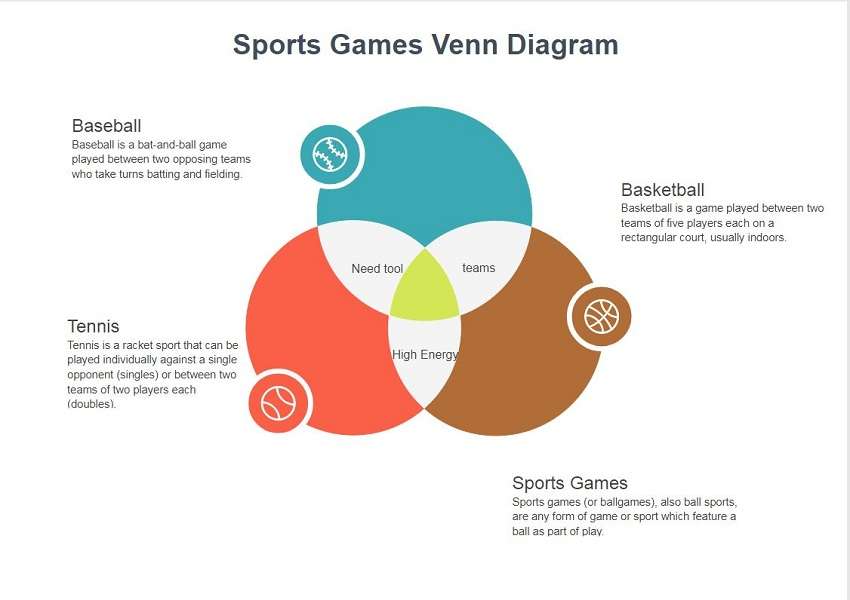
8. Venn Diagram for Sport Analysis
Sports enthusiasts can utilize the Venn diagram to their advantage. Whether they enjoy team sports or individual challenges, the sports Venn diagram sets can help them discover sports that align with their preferences. Researchers may also use the Venn diagram to observe modifications in sports participation and choices, providing valuable insights for sports organizations and policymakers.
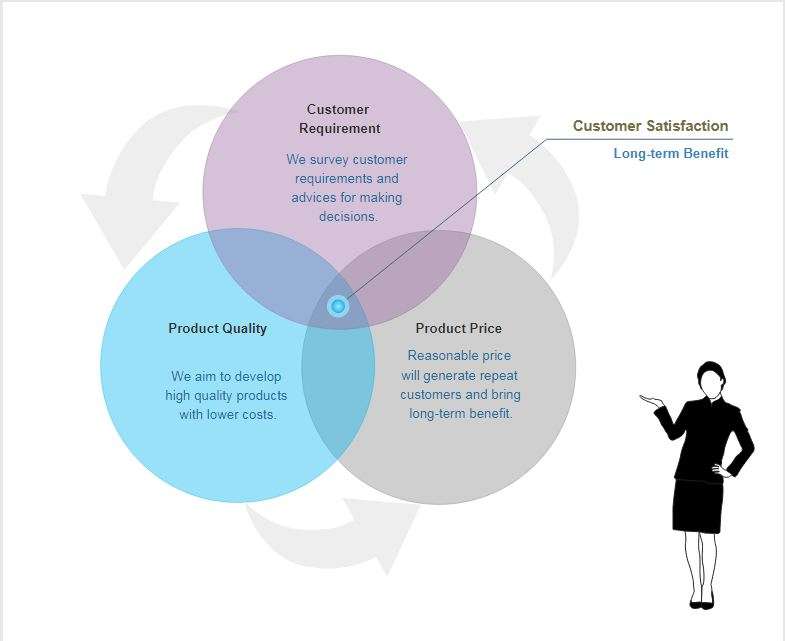
9. Venn Diagram for Customer Satisfaction Analysis
A Customer satisfaction Venn diagram is a graphic illustration that helps in the analysis of the variables influencing customer satisfaction. The diagram can classify client input and identify the factors influencing the satisfaction of clients. Businesses may use the Venn diagram as a framework for customer surveys to gather input on the various variables reflected in the sets.
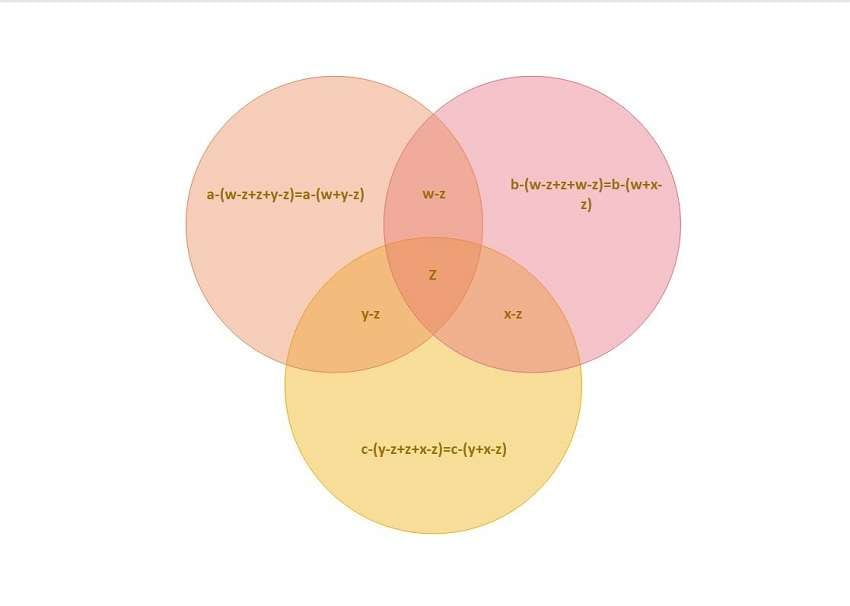
10. Venn Diagram for Formula Analysis
This Venn diagram for formulas analysis illustrates the relationships and connections between different mathematical formulas, analyzing the shared variables or components among multiple formulas. This diagram provides insights into mathematical relationships. It can assist in solving complex math problems involving various formulas.
Part 3. How to Make a Venn Diagram within Minutes?
Users can try out EdrawMax's features without purchase due to its free trial offer. It enables customers to explore the software and its features before buying. Beginner and professional users may easily construct Venn diagram sets using EdrawMax's simple and user-friendly interface.
A wide range of free templates are available from EdrawMax, including a number of Venn diagrams. With over 280 types of diagrams, 15,000+ built-in templates, and 26,000+ symbols, the diagramming tool is all-in-one diagram maker for all your needs.
A Step-by-step Guide to Making a Venn Diagram:
Step1:Download or Try Online
Go to the website of EdrawMax you can download the software for free or use it on the website. On the EdrawMax website, you can find the proper version for your operating system (Windows, macOS, or Linux).
Step2:Select a Template
Open the software interface and click on the template. Enter the Venn diagram and sets examples in the search bar. Choose a Venn diagram template from the selections presented. If you prefer, you may begin with a new page by choosing "New Blank Document."
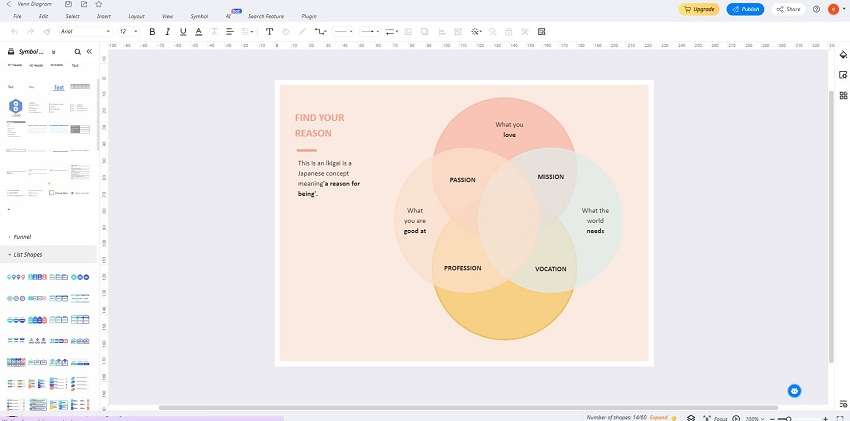
Step3:Customize the Venn Diagram
You may begin customizing your Venn diagram after choosing a template or a blank page. Go to the "Symbol Library" on the left sidebar and "Basic Shapes" to add circles. To make your Venn diagram, drag & drop the shapes into the canvas.
Step4:Export and Share
Save your work after you feel satisfied with your Venn diagram. You may share it immediately or export it to several file types PDF, docx, ppt, SVG, etc. To export, click on the file and then choose that option.

Conclusion
In conclusion, we have explored 10 Venn diagram sets, each displaying the flexibility and usefulness of this powerful tool in learning environments to data analysis and problem-solving situations. The most recommended suggestion is EdrawMax. It enables users to easily create professional-grade Venn diagrams and other visualizations because of its user-friendly interface, a large collection of ready-made templates, and advanced functionality.
AI Diagram Generator
Enter your prompt. Upload files if needed. Generate diagrams, charts, or slides instantly.


