


A Venn diagram is a visual illustration of similarities and differences between data sets. These diagrams use interacting and non-interacting circles to represent the relationship between data or groups of data. Also known as logical diagrams, these tools are excellent for implementing and portraying logic operations, such as union or intersection.
However, one might find it hard to find inspirations in diagramming and expect some Venn diagram examples as references. So here are 6 popular Venn diagram templates including examples of math you should have a look at.
Part 1. 6 Venn Diagrams Examples for Different Scenarios
1. Two-Circle Venn Diagram

 below.
  below.
 A two-circle Venn diagram example shows the relation between subjects using two circles. These diagrams have two circles or ovals closed in a rectangle (universal set) representing each data set. Mostly, the overlapping part of the diagram is vertically aligned in the center, with the two circles on its left and right sides.
The two-circle diagrams are best for math problems and educational lectures. They are the easiest example of a Venn diagram that plots and represents the commonalities and differences between two data sets. They are widely used in union, intersection, absolute (complement) problems, and symmetric word problems in Mathematics.
2. Three-Circle Venn Diagram


As the name suggests, the three Venn diagram example represents the relationship between three subjects or data sets. These figures have a similar placement to the two-circle diagrams, with an additional oval below the two. The intersection between these data sets is often done horizontally. This can be in the upward and downward direction.
These diagrams are widely popular in business presentations and education lectures. Part of the reason is that they have a great scope to visualize the comparison between three entities and how they influence each other. Most marketers use these for market analysis, product comparisons, and competitor analysis.
3. Four-Circle Venn Diagram

Four-circle is yet another Venn diagram example, famous for its ability to compare complicated and intricate relationships. As the name suggests, these diagrams portray the relationship between four data sets. They have an unusual symmetry with four ellipses representing the overlapping between the subjects.
The four-circle diagrams are popular among professionals for their scope to predict the occurrence of events. Similarly, these diagrams are a great way to represent complex differential elements. For instance, the differences in the themes of a novel or the similarities between the characters of a play.
4. Multi-Layered Venn Diagram

Finally, the most complex Venn diagram example on this list would be multi-layered diagrams. Unlike other traditional types of Venn diagrams, these use the out-to-inward approach. It means that they have multiple smaller circles or ovals enclosed in one big circle.
The good thing about multi-layered Venn diagrams is that they can be used in any application. This includes business meetings, educational presentations, product comparisons, and mathematical problems. The only thing different in these relationships is that they belong to data sets from a certain family.
Part 2. How to Create a Venn Diagram with EdrawMax
EdrawMax is a diagram tool that allows you to create, edit, and modify technical figures like Venn diagrams. Here is a step-by-step process for creating a Venn diagram using this tool.
Why Choose EdrawMax to Make Venn Diagrams?
TEdrawMax is one of the simplest tools to create Venn diagrams. It has a large number of customization tools, a template community with more than 15,000 templates for you to start with, not to mention a collaborative workspace for you to benefit from. Here is a breakdown of its useful tools that can help you cut the time in making Venn diagrams.
- Symbol Library: You can pick and choose from unlimited shapes and icons from the symbol library. They only need to intuitively drag and drop the symbols on the editing panel and start working.
- Ready-Made Templates: There are over 15,000 existing templates on EdrawMax. You can utilize and edit them just how they like.
- Automatic Formatting: EdrawMax has a wide variety of fonts, styles, and themes. All these elements give your Venn diagram an aesthetic finish and professional attire when combined with auto-formatting.
- Support Multiple File Formats: The Wondershare EdrawMax supports multiple file formats. This includes everything from Visio, PDF to PPT, JPEG, PNG and more. The options are flexible.
How to Create a Venn Diagram on EdrawMax
Step1Create a File
Begin the process by downloading the EdrawMax application on your laptop and setting up an account. It will not take more than two minutes. Once the account is active, you can access it through both the desktop or web-based version.
Now, you can dive right into the journey of creating Venn diagrams. Open the EdrawMax main menu and click New > Basic > Basic Diagram > Venn Diagram.
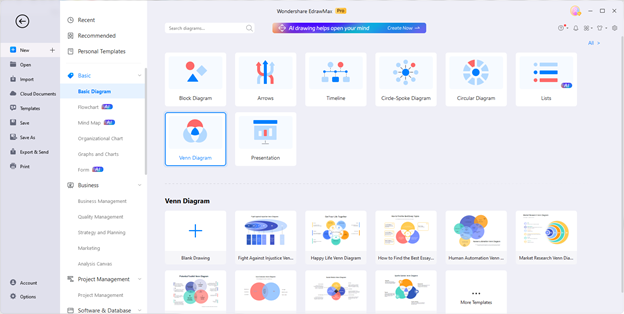
Step2Choose a Venn Diagram Template to Start with
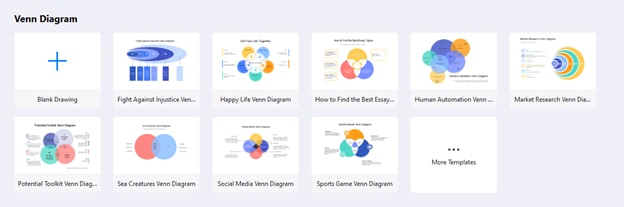
Upon clicking, you will see a number of ready-made templates. These are editable model examples that allow you to personalize the existing Venn diagrams. Moreover, you can always press the More Templates option at the right corner to explore endless options in the Template community.
Scroll down and check which template suits your task best. Next, click Use Immediately once you are clear about using a template of your choice from the collection. It will export all diagram elements onto the editing panel, from where you can further make changes and customize it to your liking.
Another way you can build your own Venn diagram on EdrawMax is from scratch. For this, click the “+” icon just below the Venn Diagram section. Doing so will open the editing panel. Here you can drag and drop the shapes, choose categories, and change the appearance of your diagram.
Step3Customize Venn Diagram Template
Now, customize the template you have chosen. There are numerous tools to make the diagram engaging for the viewers. Change the color of shapes or font of text any other settings. You could also add or remove icons and symbols.
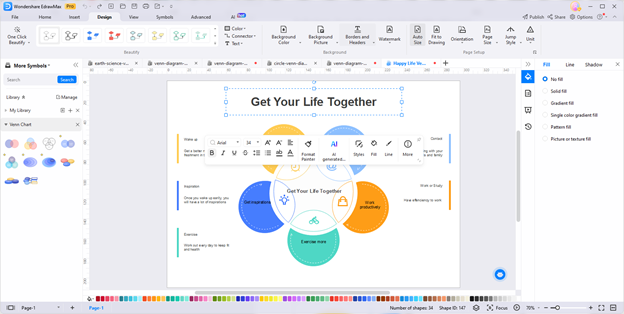
Once the editing is complete, make sure to group the elements of the diagram so they don’t move from one place. And voila, your Venn diagram is in the final shape.
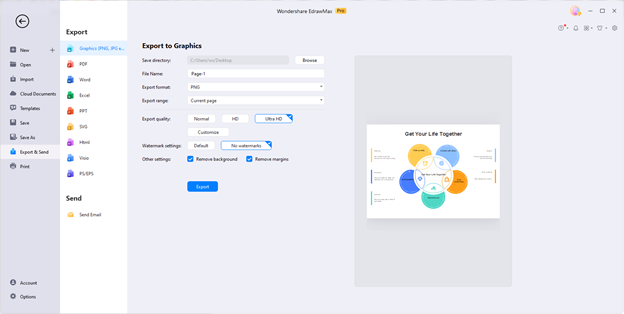
Step4Export Your Work
EdrawMax is a cloud-based software application that allows you to export your work in multiple formats and access it anywhere, anytime. You can go to the top-left corner and press File > Export and Send > Your Preferred Format.
Conclusion
Now, it takes no time to create technical diagrams like a Venn diagram with software assistance like EdrawMax. Its intuitive interface, cutting-edge AI tools, and rich resources set it apart from all other Venn Diagram tools. Try it for free today!
AI Diagram Generator
Enter your prompt. Upload files if needed. Generate diagrams, charts, or slides instantly.


