


Unlock the power of visualizing data flow with online tools. In this concise guide, we'll demonstrate the seamless process of crafting a Data Flow Diagram online digitally. Discover the advantages of online platforms, grasp the essential components of a DFD, and gain practical insights for effective diagram creation.
Streamline your understanding of information flow in just a few clicks!
Contents of the article
What are the different DFD levels and layers?
Data flow diagrams are structured into various levels and layers, each offering a progressively detailed view of the system's processes:
Level 0 DFD (Context Diagram):
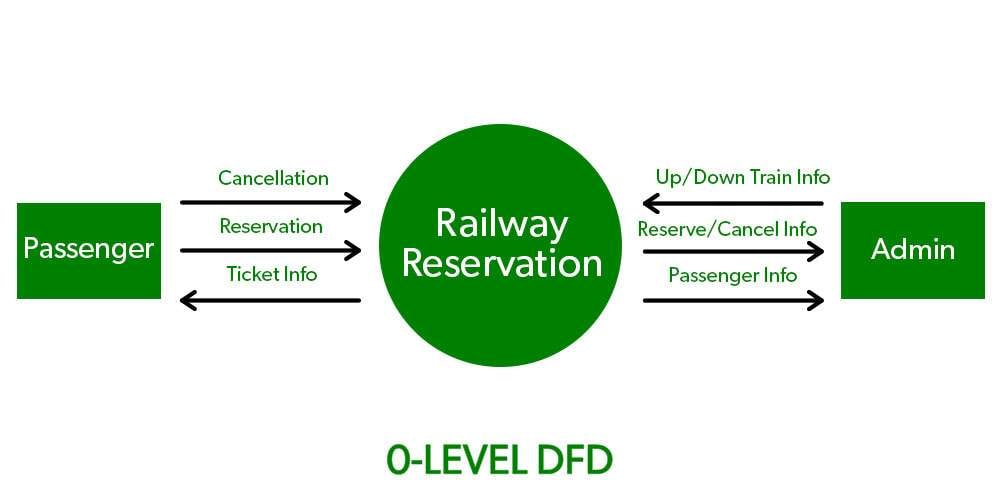
The highest-level view of a system, Level 0 DFD illustrates how the system interacts with external entities. It portrays the system as a single process with inputs and outputs from external sources and destinations.
Level 1 DFD:
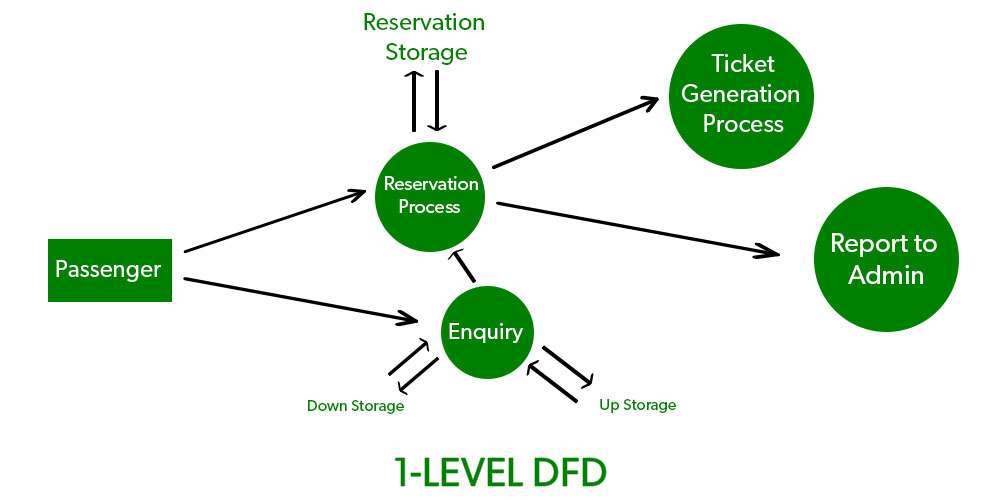
Level 1 DFD expands on the context diagram by breaking down the single process into more detailed sub-processes. It provides a deeper understanding of the internal functions and interactions within the system.
Level 2 DFD:
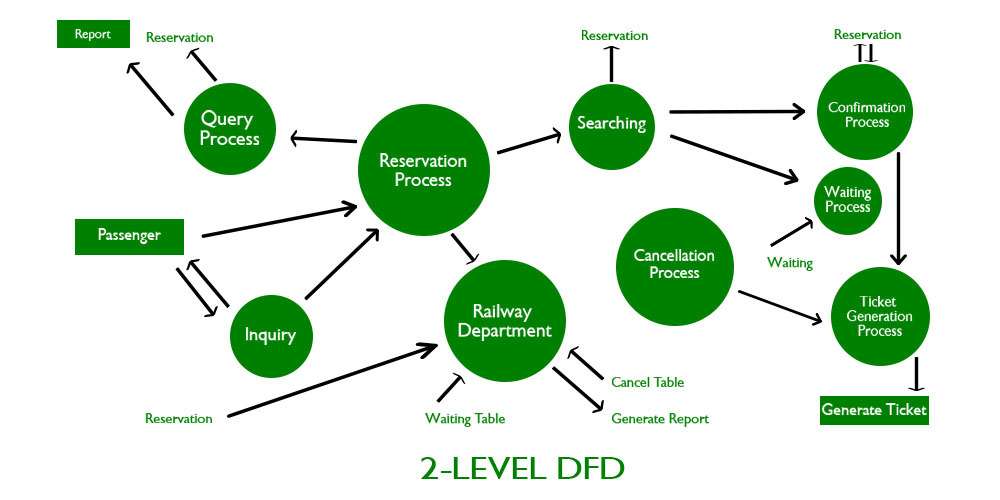
At this level, each subprocess in the Level 1 DFD is further decomposed into more detailed processes. Level 2 DFD delves into the specifics of how data moves within these subprocesses, providing a finer-grained view.
How are data flow diagrams used?
Data Flow Diagrams (DFDs) are visual tools that simplify complex systems. They depict how data moves within a process or a system. Analysts, developers, and stakeholders use DFDs to understand, analyze, and improve information flow. They're vital for designing systems, identifying bottlenecks, and ensuring efficient operations.
DFDs clarify communication among team members, making them essential in software development, business process analysis, and system documentation.
Advantages of a DFD
Utilizing Data Flow Diagrams (DFDs) confers several key advantages in understanding, optimizing, and communicating complex information processes:
- Simplicity: DFDs offer a clear, visual representation of complex systems, making them easy to understand for stakeholders and team members.
- Process Understanding: They provide a comprehensive overview of how data moves within a system.
- Communication Aid: DFDs facilitate effective communication among team members, ensuring everyone has a shared understanding of the system's workings.
- Problem Identification: They help pinpoint bottlenecks, redundancies, or potential issues in data flow, enabling timely resolution.
- System Design: DFDs serve as a blueprint for designing or modifying systems, ensuring they meet desired functionality and efficiency requirements.
- Documentation: They act as essential documentation for system processes, aiding in maintenance, updates, and future development efforts.
Data flow diagram symbols
A data flow diagram (DFD) uses different symbols to represent the flow of information within a system. Here is a brief overview:
- External Entity: Represents an external source or destination of data, such as a user, system, or organization, interacting with the system.
- Process: Signifies a function, operation, or task that transforms input data into output data within the system.
- Data Store: Represents a repository where data is stored and retrieved by the system, such as a database, file, or memory storage.
- Data Flow: Depicts the movement of data from one part of the system to another, showing the path it takes during processing or storage.
When Can You Use A DFD?
You can use a Data Flow Diagram (DFD) in various contexts:
- In Business: DFDs are valuable for modeling business processes, illustrating how data moves within an organization, and aiding in process optimization and communication among stakeholders.
- In Software Engineering: DFDs help in software development by visualizing data inputs, processes, and outputs, facilitating system design and requirements analysis.
- In System Structures: DFDs can be applied to depict the high-level structure of complex systems, showing how data interacts with various components and helping in system understanding and design across different domains.
How To Create A DFD With Edrawmax?
Wondershare EdrawMax streamlines the process of creating Data Flow Diagrams (DFDs) with its user-friendly interface and rich set of features. The software offers a wide range of DFD templates and a comprehensive library of symbols, allowing users to quickly build and customize their diagrams.
The drag-and-drop functionality, coupled with smart connectors, simplifies the task of arranging and connecting elements, making it accessible to both beginners and experienced diagram creators.
Overall, these features collectively contribute to a streamlined workflow, significantly reducing the time required to create comprehensive and accurate Data Flow Diagrams.
Here are the steps to create a data flow diagram online using Wondershare EdrawMax:
Step 1: Open EdrawMax on your computer. Click on the "New" button to start a new diagram. Select Flowchart> Data Flow Diagram.
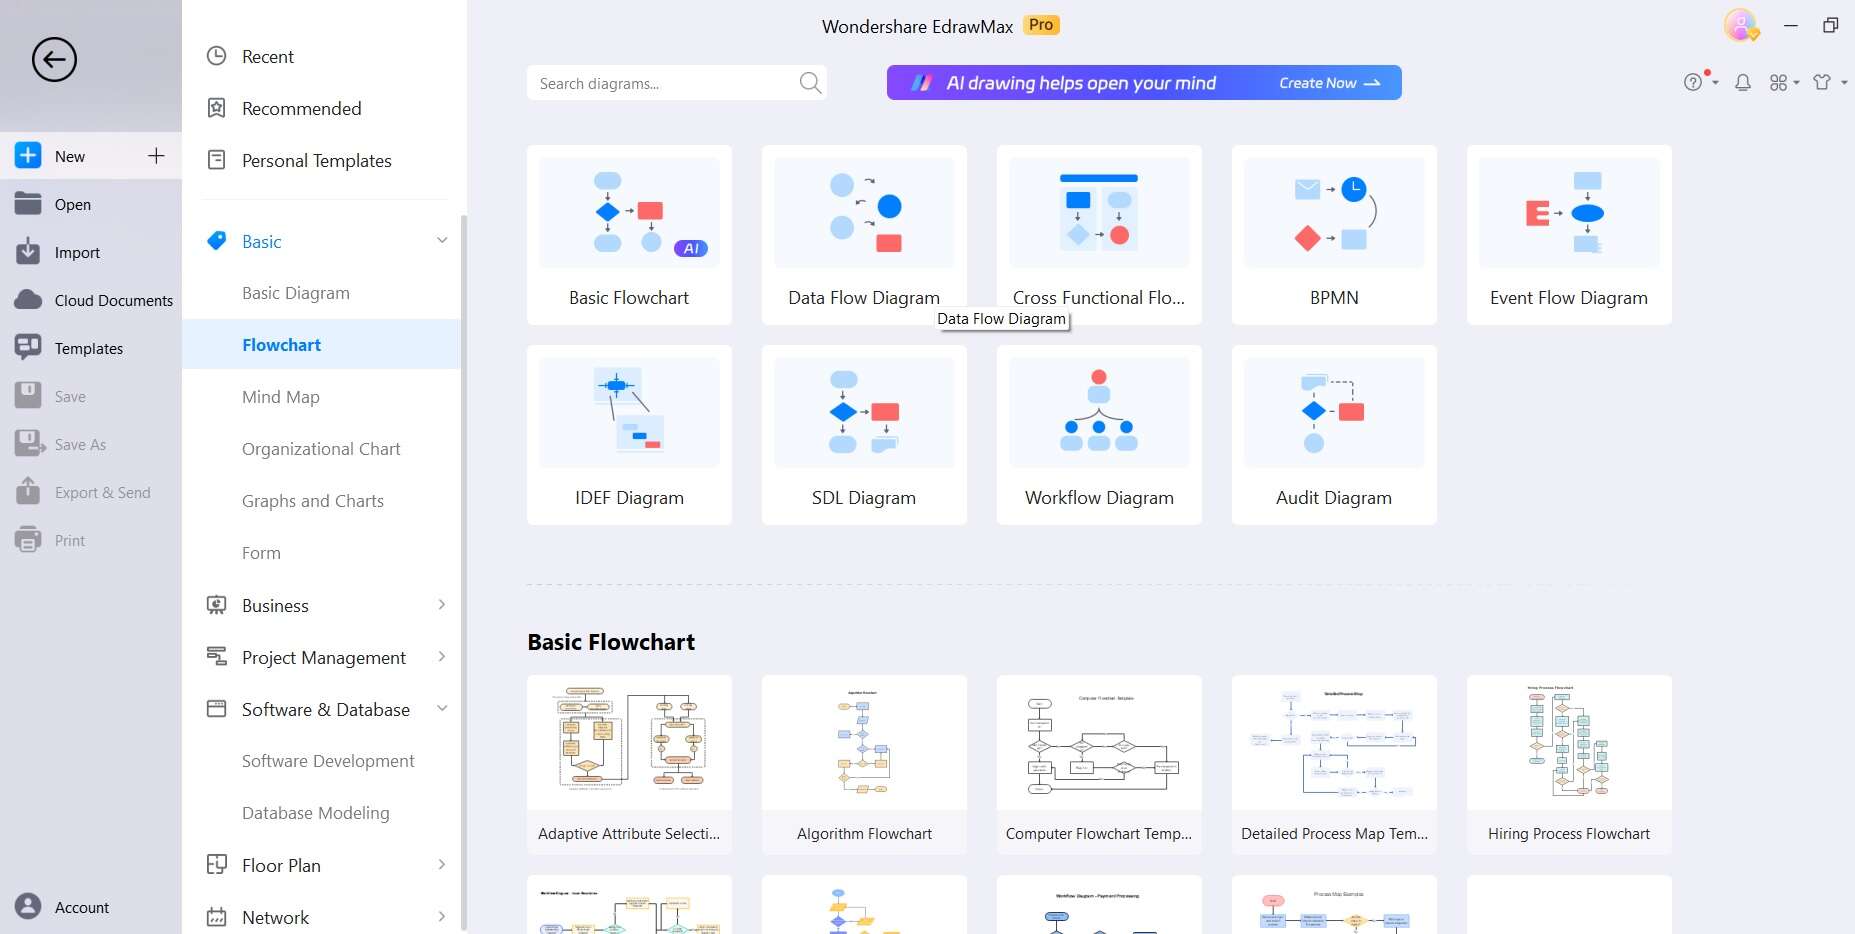
Step 2: Alternatively, you can also scroll through the available templates. This will provide a basic structure for your DFD. Switch to the “Templates” section from the left menu pane. Search for “Data Flow Diagram”. Choose a Data Flow Diagram template that best fits your needs.
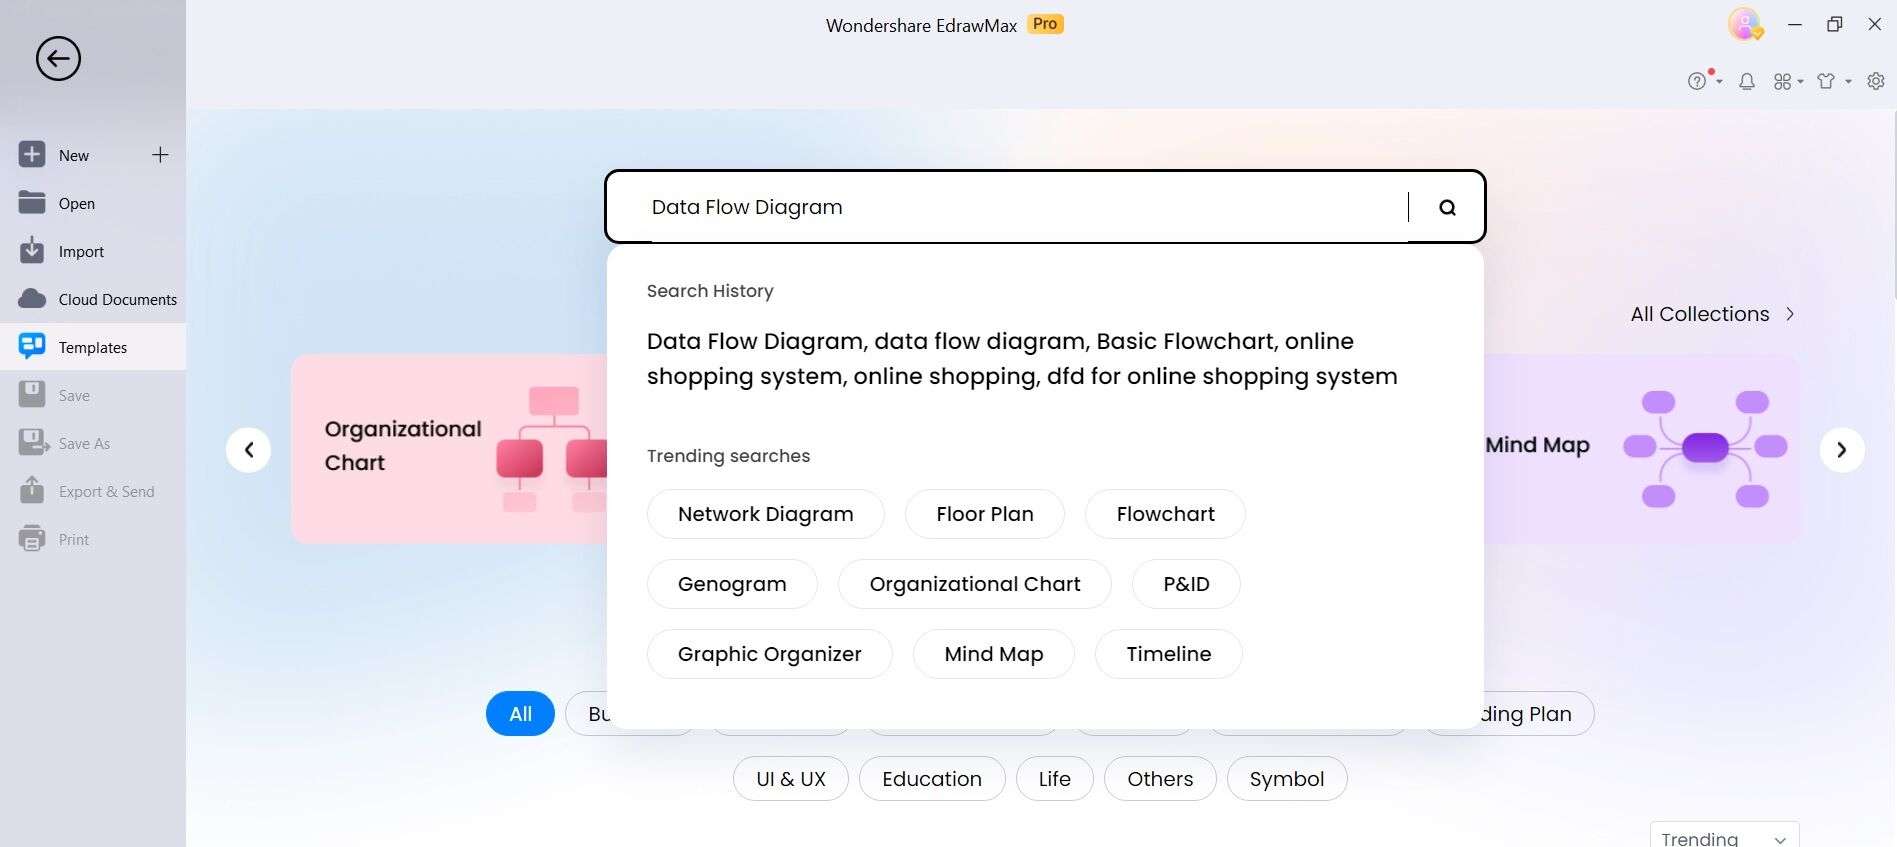
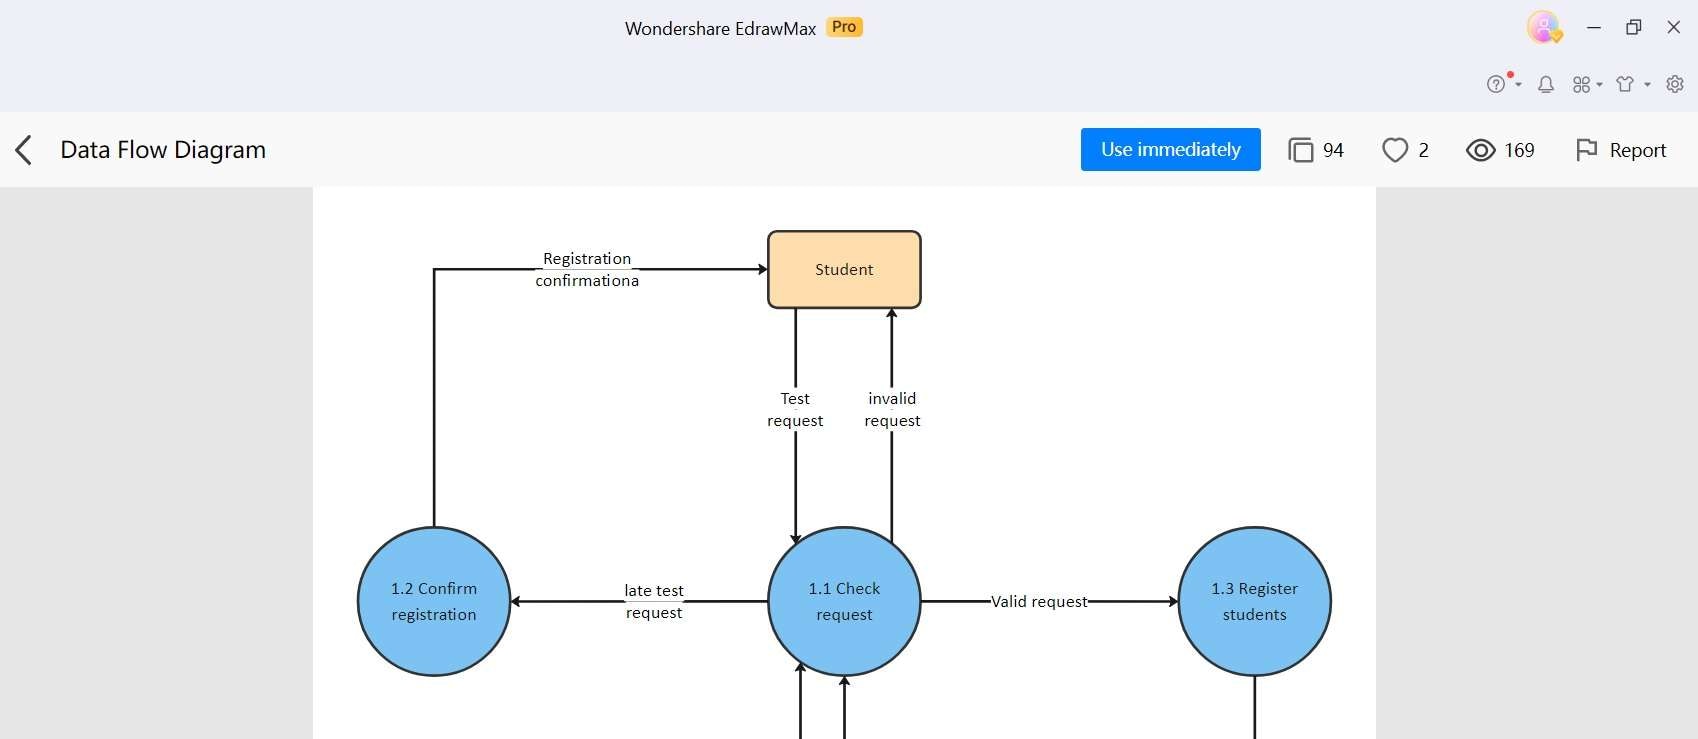
Step 3: Hit on the “Use Immediately” button. The chosen template will now be imported to EdrawMax’s canvas.
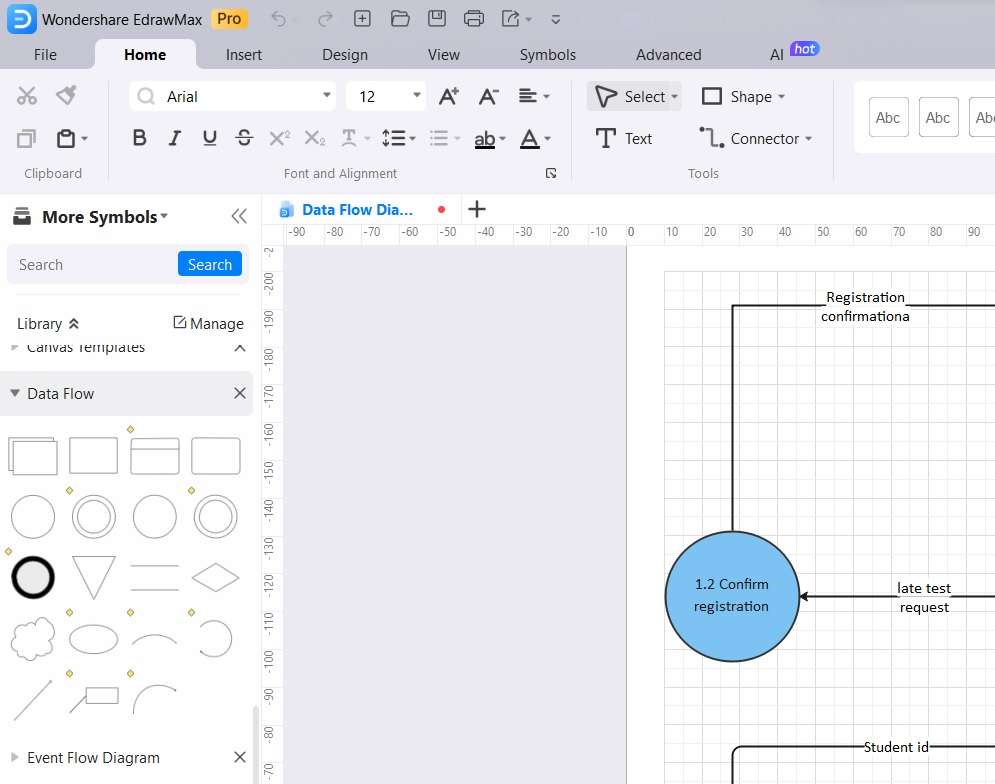
Step 4: Drag and drop the predefined symbols for entities and processes onto the canvas. These represent the key components of your system. Customize them by double-clicking and editing their labels.
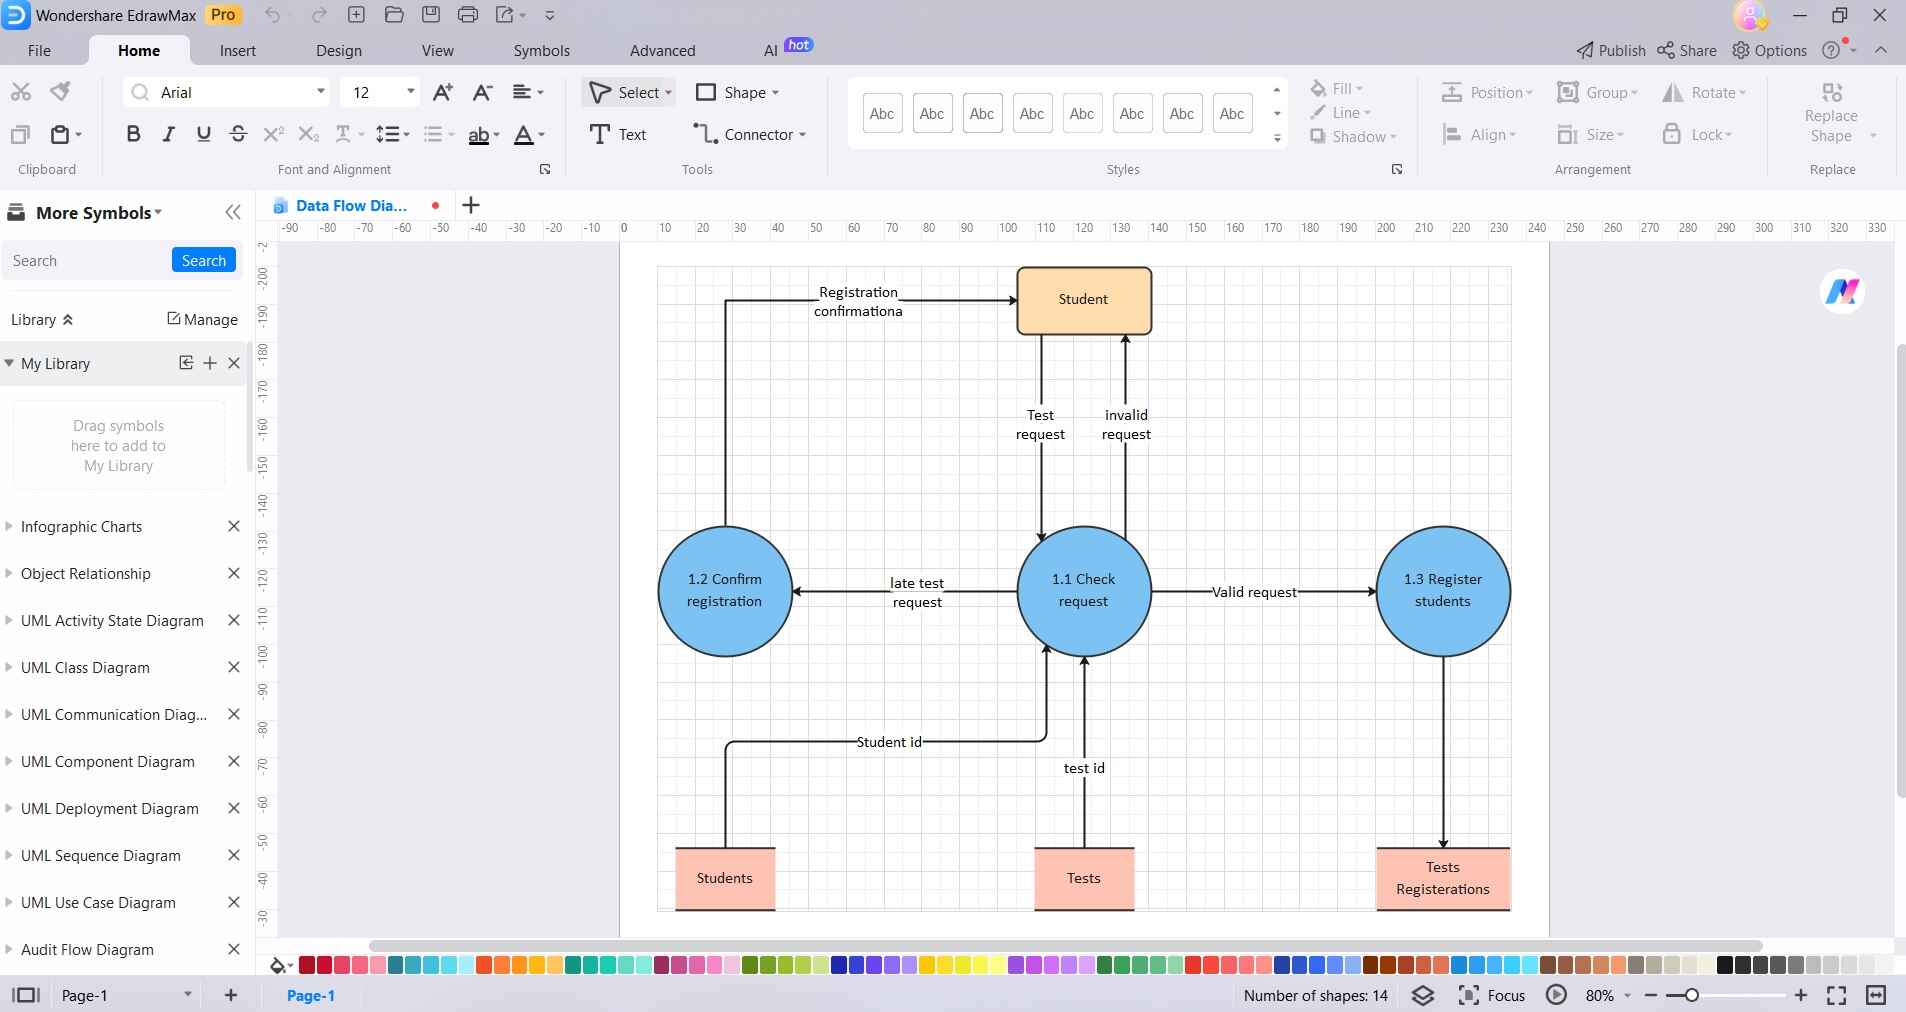
Step 5: Use arrows or connectors to link the entities and processes. These represent the flow of data between them. Drag connectors from one symbol to another to establish connections.
Step 6: Add any additional details, such as formatting descriptions or annotations, to provide clarity and context to your DFD.
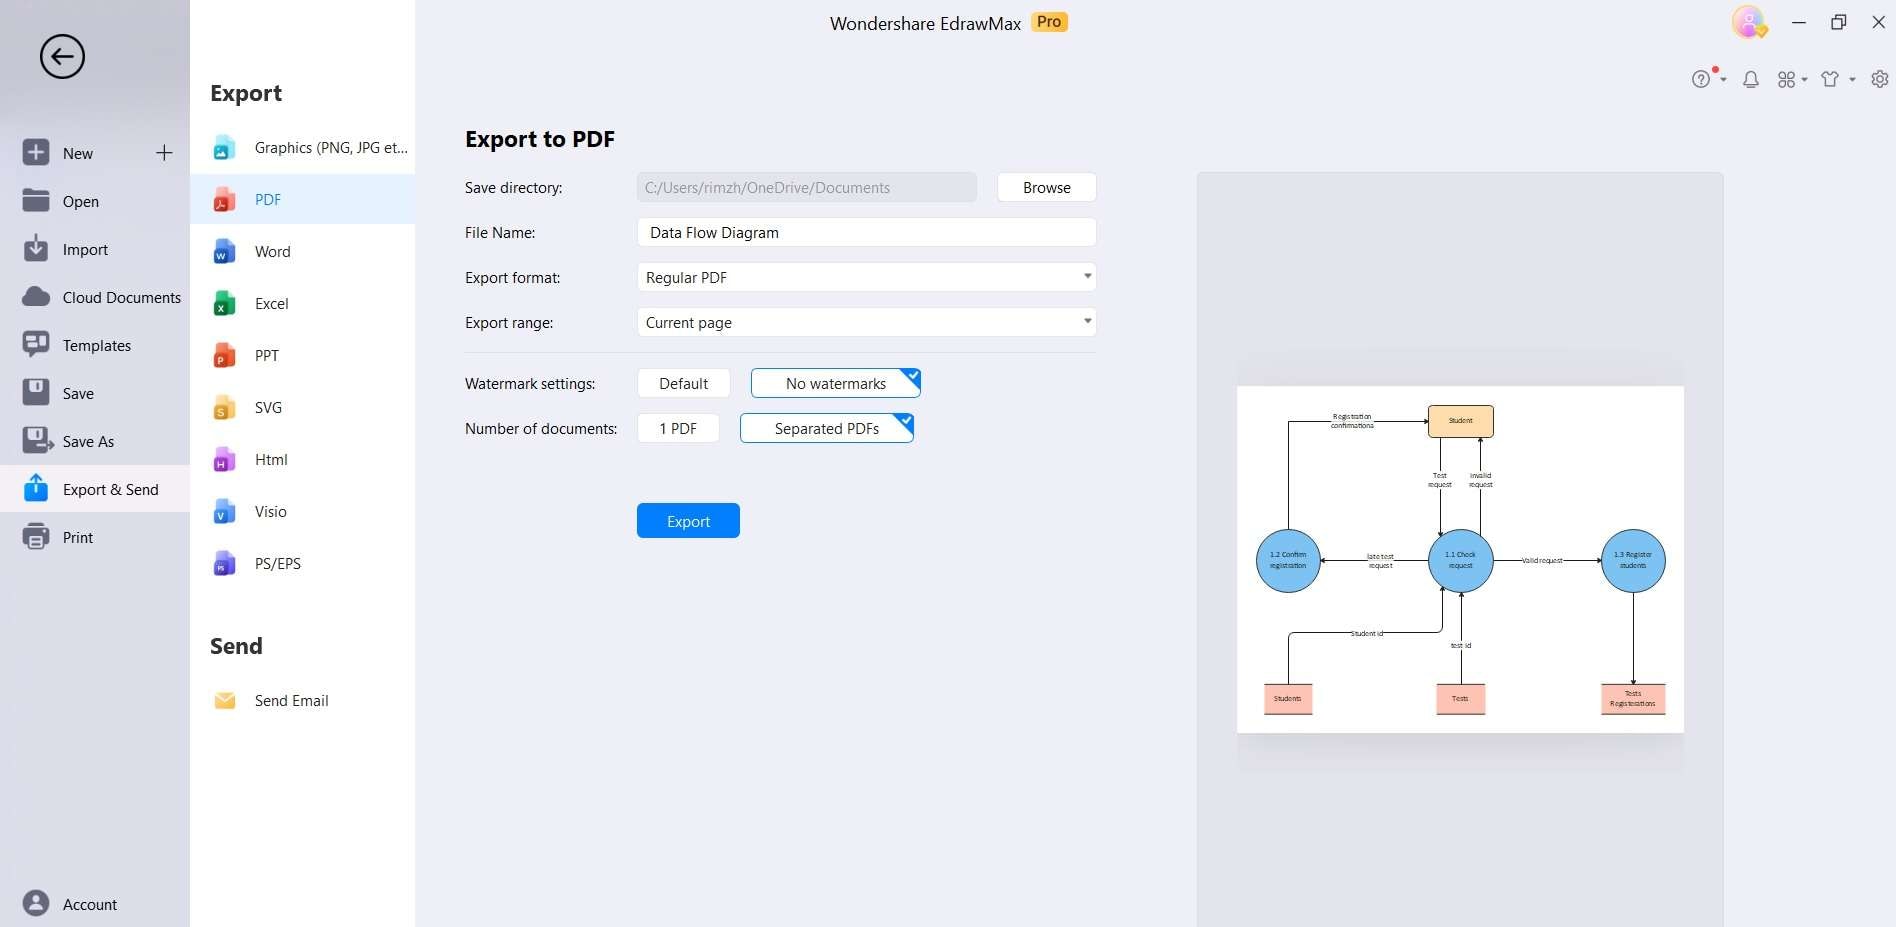
Step 7: Once you're satisfied with your DFD, click on "File" and select "Save" to save your work. You can also export the diagram in various formats if needed.
Final Thoughts
Creating a Data Flow Diagram online brings a host of advantages. It streamlines collaborative efforts, allowing teams to work seamlessly across distances. The accessibility and intuitive interfaces of online platforms simplify the creation process, even for beginners.
Furthermore, the ability to instantly share and receive feedback enhances communication and accelerates project timelines. With secure cloud storage, data is safeguarded and accessible from anywhere. It's a pivotal tool in modern business and software development landscapes.
AI Diagram Generator
Enter your prompt. Upload files if needed. Generate diagrams, charts, or slides instantly.


