


Mastering the creation of Information Flow Diagrams is pivotal for effective communication in complex systems. This guide outlines a systematic approach, breaking down the process into clear, actionable steps. Whether you're mapping a digital process or visualizing data flow, these steps will empower you to construct diagrams that convey information seamlessly. Let's explore this process of crafting diagrams that illuminate the flow of information with precision and clarity.
In this article
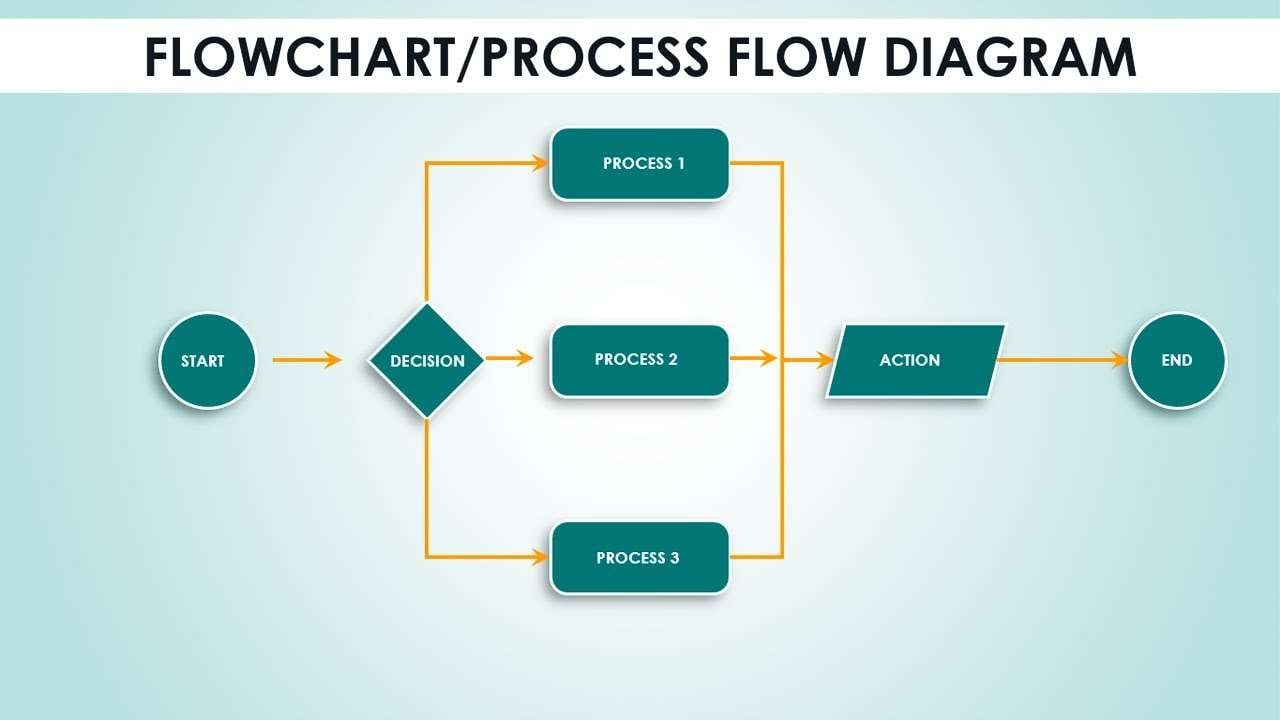
What is an IT Flow Chart, or Workflow?
An IT flow chart, or workflow, is a visual representation of a series of steps or tasks within an Information Technology (IT) process. It outlines the sequence of actions, decisions, and interactions involved in executing a specific IT operation. These charts provide a clear and structured overview, helping to identify bottlenecks, dependencies, and potential areas for optimization.
By mapping out IT workflows, teams can streamline processes, improve efficiency, and ensure smooth execution of tasks, making them essential tools in IT management and optimization.
Primary Benefits of Using Information Flow Diagram
- Develop Standardized Process for Security Updates: Information Flow Diagrams establish a standardized process for efficiently managing security updates, ensuring timely and consistent protection against emerging threats.
- Reference Flow Charts to Aid in Application Development: These flow diagrams serve as invaluable references during application development and deployment, offering a visual guide to streamline processes and enhance overall efficiency.
- Implement Data Storage and Management Processes: They facilitate the implementation of robust data storage and management processes, ultimately leading to improved data quality and integrity within the system.
Steps of an IT Organization Process Flow Chart:
- IT Procurement: Acquiring necessary hardware, software, and services in a cost-effective and efficient manner.
- IT Project Management: Planning, executing, and overseeing IT projects to ensure successful outcomes and timely delivery.
- Application Development & Support: Creating, maintaining, and enhancing software applications to meet organizational needs.
- Network Administration: Managing and maintaining the organization's network infrastructure for seamless connectivity and communication.
- Systems Analysis: Evaluating and optimizing IT systems to enhance performance, functionality, and efficiency.
- IT Security: Safeguarding digital assets and sensitive information from cyber threats and ensuring compliance with security standards.
- Business Intelligence (BI): Utilizing data analytics and reporting tools to extract valuable insights for informed decision-making.
- User Support & Services: Providing assistance, troubleshooting, and technical support to end-users for uninterrupted operations.
Use EdrawMax Creating Information Flow Diagram
Wondershare EdrawMax plays a crucial role in creating information flow diagrams due to its exceptional features and user-friendly interface. It streamlines the process in several ways. Firstly, EdrawMax offers a wide range of pre-designed templates and shapes specifically tailored for information flow diagrams. This expedites the initial setup and ensures a professional and visually appealing end result.
Additionally, EdrawMax allows for easy customization, enabling users to quickly add, modify, or rearrange elements within the diagram. Its drag-and-drop functionality simplifies the placement of nodes, connectors, and labels, significantly reducing the time and effort required compared to manual drawing.
Here are the steps to craft an information flow diagram using the advanced capabilities of Wondershare EdrawMax DFD tool:
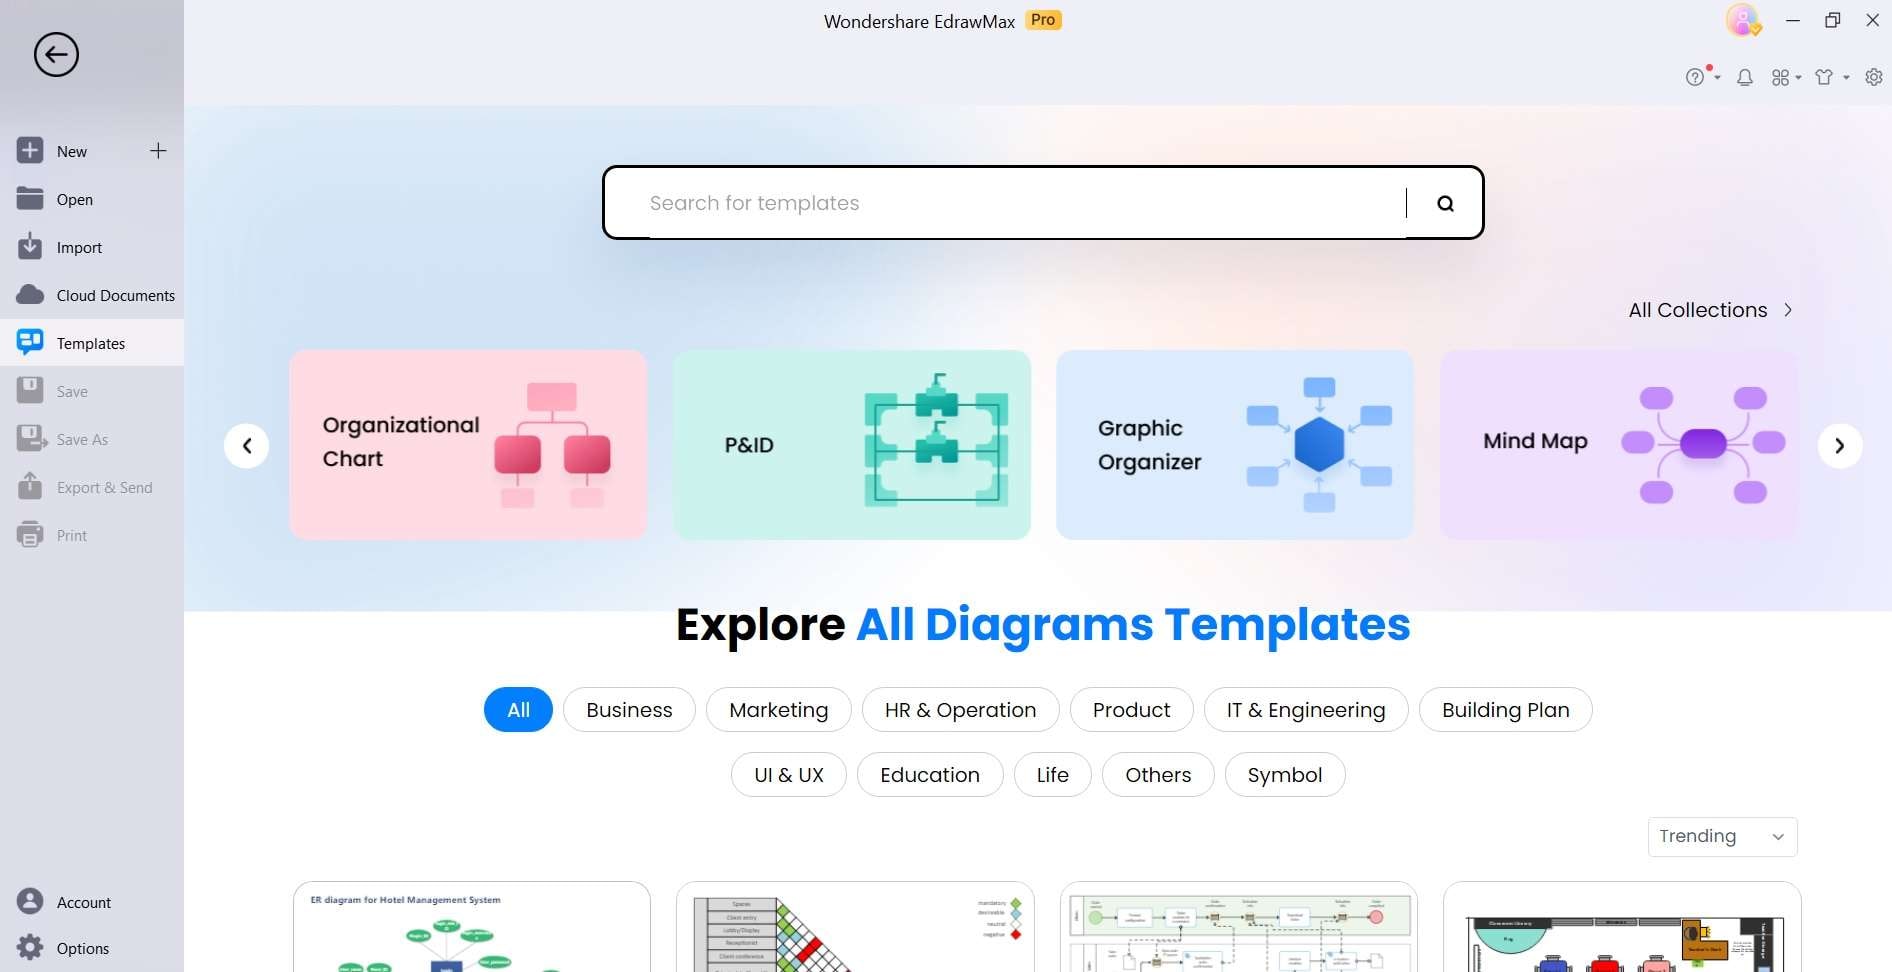
Step 1: Launch Wondershare EdrawMax on your PC.
Step 2: Select New> Blank Drawing to begin. Alternatively, you can also navigate to the template gallery and select the "Data Flow Diagram" category. Browse through the available templates and choose one that closely aligns with your specific information flow requirements. This pre-designed template will serve as a starting point for your diagram, saving you time and ensuring a structured approach to the visualization process.
Step 3: You will now be redirected to the canvas space. Begin by placing the main process or entity in the center of the canvas, representing the core function of the system. Add external entities around the central process to denote the sources and destinations of data. Connect them to the central process using intuitive connectors.
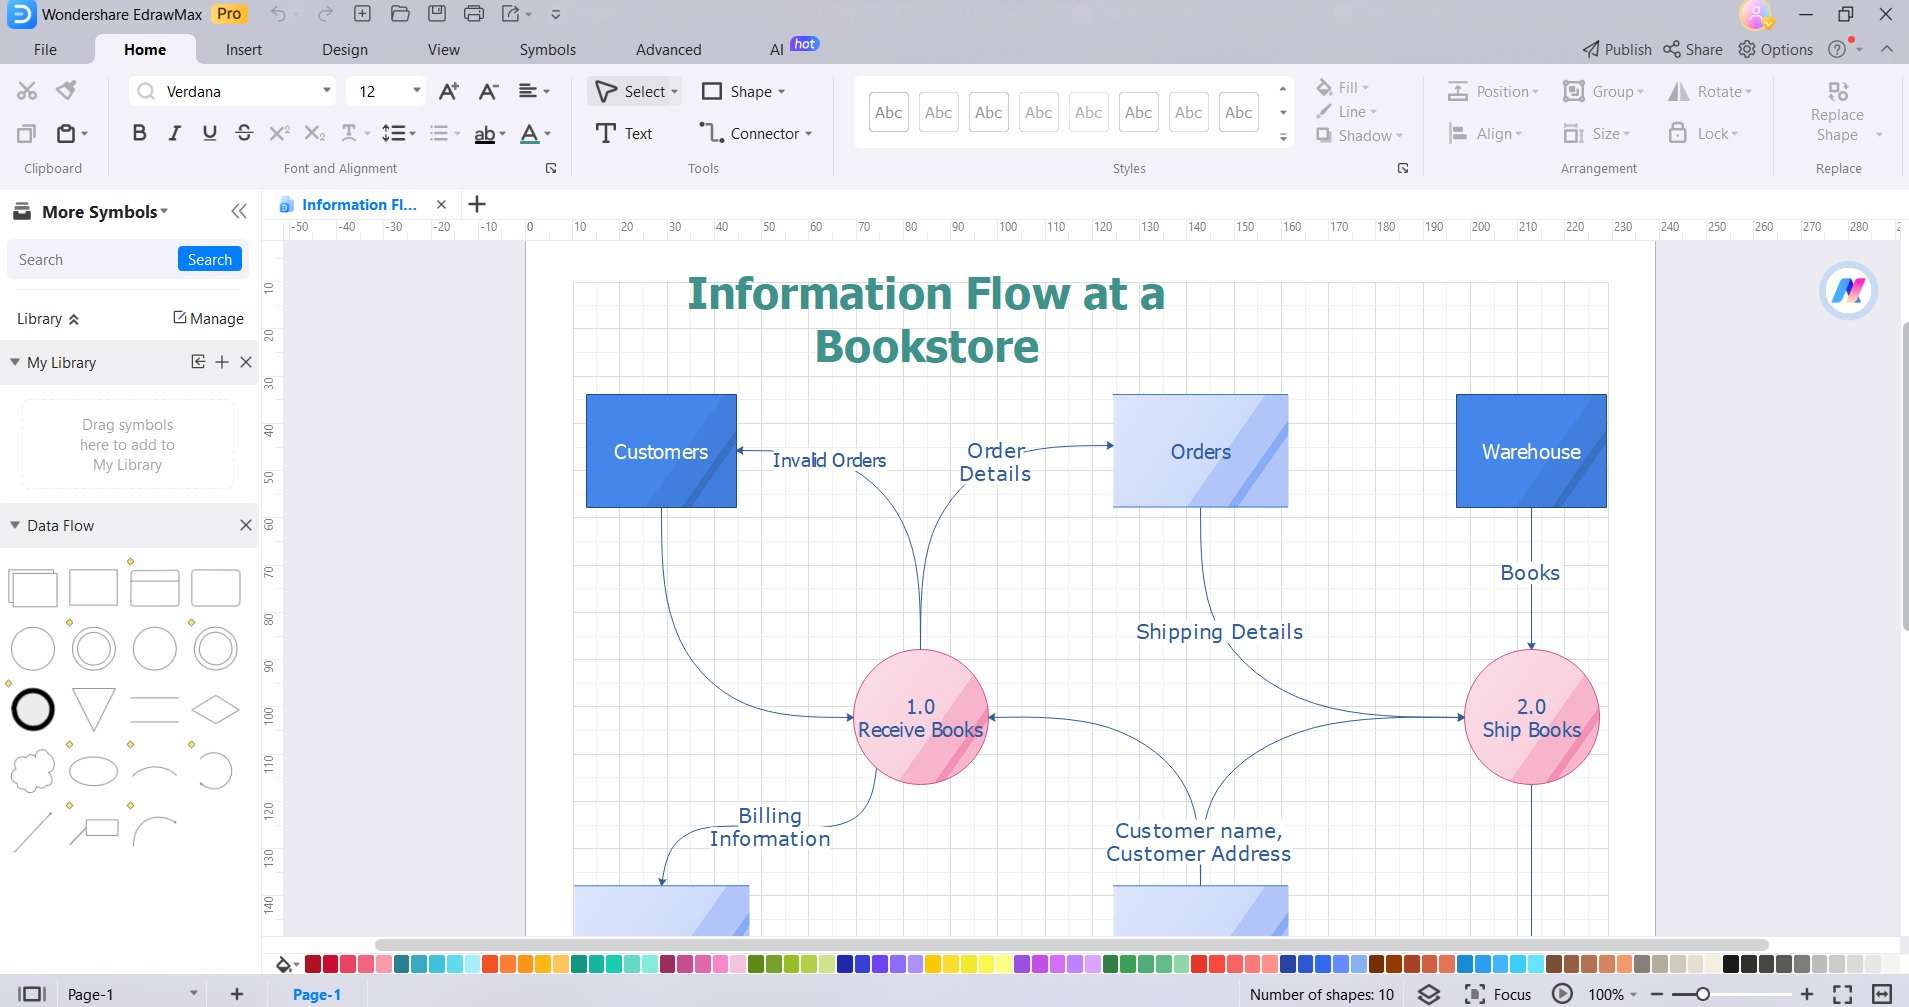
Step 4: Label each element with clear and descriptive text to provide context and clarity to the diagram.
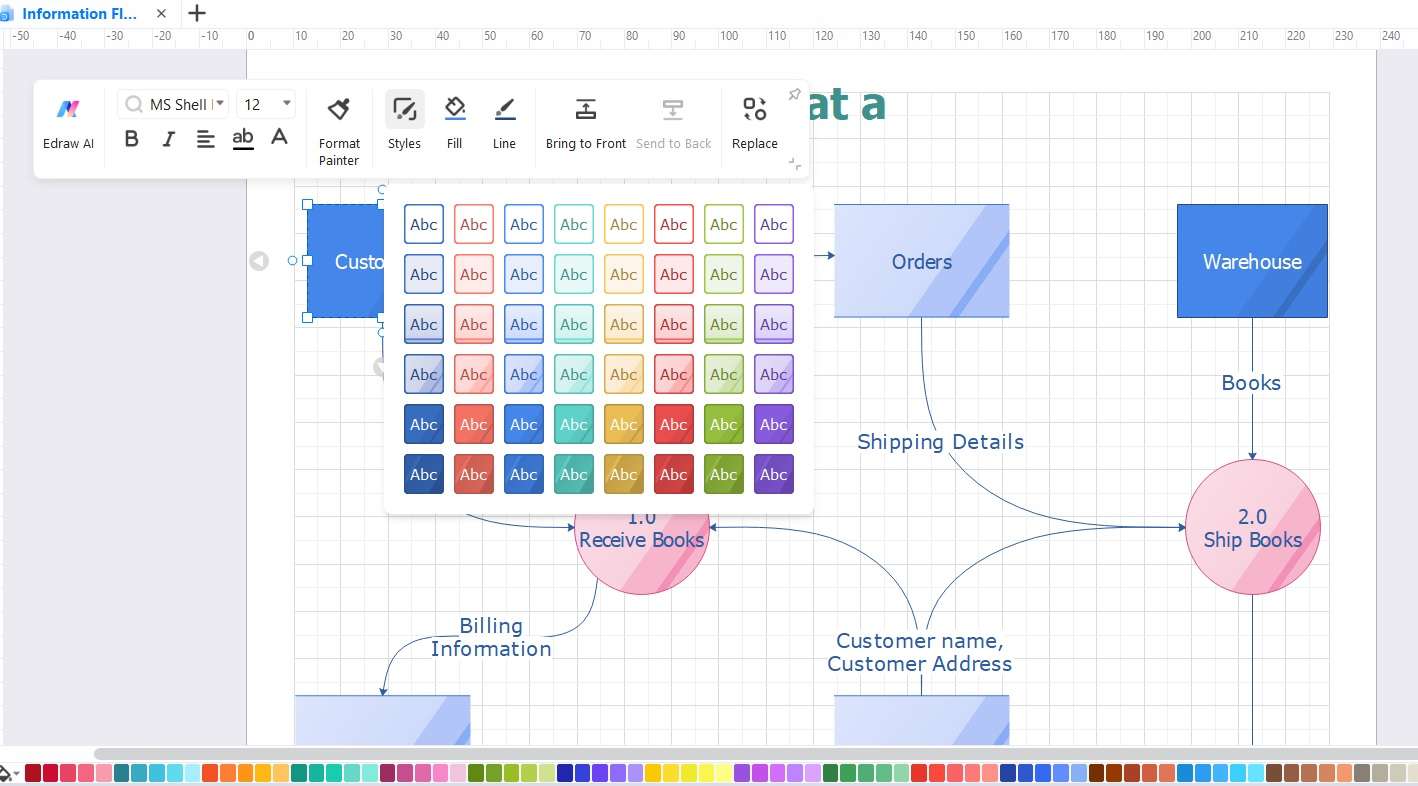
Step 5: Utilize EdrawMax's formatting tools to enhance the visual appeal of the diagram. Adjust colors, shapes, and fonts to improve readability and aesthetics.
Step 6: Review and refine the diagram to ensure it accurately represents the information flow within the system.
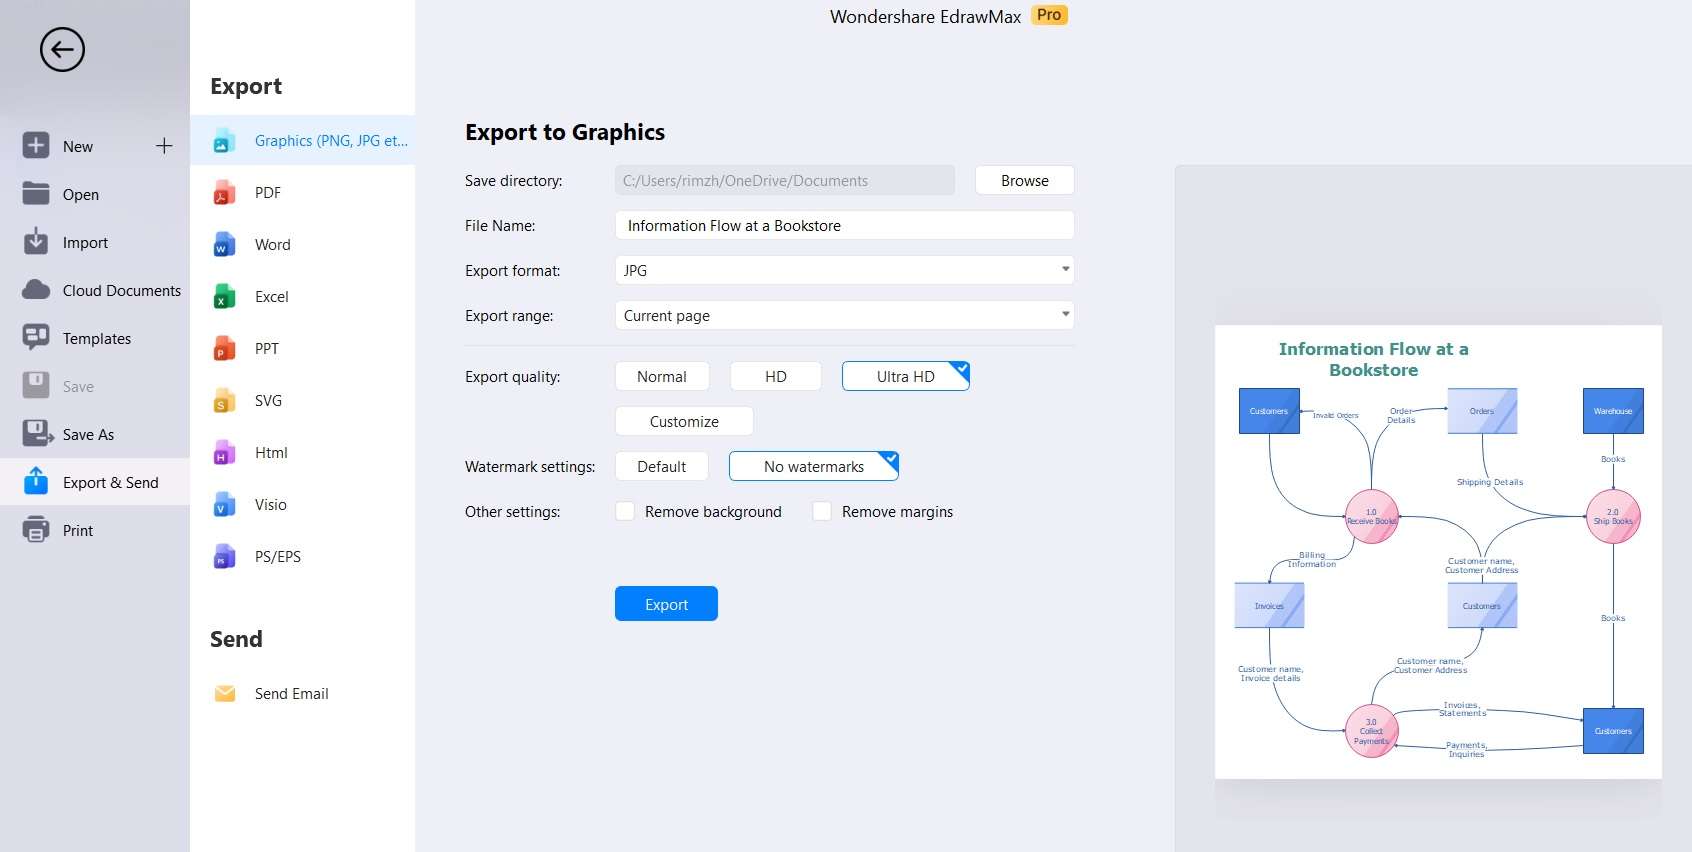
Step 7: Save the diagram in a preferred format or export it for easy sharing and collaboration with team members and stakeholders.
Key Takeaway: With its extensive template library, intuitive drag-and-drop interface, and robust customization options, EdrawMax empowers users to efficiently convey complex information in a clear and engaging manner.
Additionally, its collaborative features and export capabilities make it a versatile tool for team projects and presentations. Overall, EdrawMax enhances productivity and effectiveness in diagram creation, allowing users to focus on content and communication rather than technicalities.
Conclusion
Mastering the art of crafting clear and effective Information Flow Diagrams is a crucial skill for effective communication in complex systems. This guide has provided a systematic approach, breaking down the process into actionable steps.
By following these guidelines, one can create diagrams that convey information seamlessly, aiding in decision-making and process optimization. Remember, precision and clarity are paramount. With practice and attention to detail, you'll be adept at producing diagrams that serve as invaluable tools in understanding, managing, and improving information flows within any system. Elevate your communication and organizational effectiveness with well-crafted Flow Diagrams.
AI Diagram Generator
Enter your prompt. Upload files if needed. Generate diagrams, charts, or slides instantly.


