


Navigating complex data structures can be daunting, but with Lucid Chart, the process becomes a breeze. In this guide, we'll walk you through the step-by-step process of creating a data flow diagram. From defining inputs to mapping out processes and outputs, we'll cover it all. By the end, you'll have a clear, insightful visual representation of your data flow, ready to inform your decision-making process.
In this article
What is a Lucid Chart DFD?
A Lucid Chart DFD is a visual representation that illustrates the flow of data within a system. It uses standardized symbols and shapes to depict processes, data stores, data flow, and external entities. Lucid Chart provides a user-friendly platform for creating DFDs, allowing users to design clear and insightful diagrams that facilitate understanding of how data moves through a system, aiding in effective decision-making and process optimization.
How Does DFDs Help In Streamlining Process?
- Visualize a system: Lucid Chart DFDs offer a clear visual representation, simplifying the understanding of complex data flow within a system.
- Use the right symbols and notation: Lucid Chart provides standardized symbols and notation, ensuring accurate representation and easy interpretation of processes and data flow.
- Let the advanced features do the work: Lucid Chart's advanced features automate complex tasks, saving time and ensuring precise DFD creation.
- Become an expert right away: The user-friendly interface of Lucid Chart allows users to quickly grasp and utilize its powerful capabilities in creating DFDs.
- Share and present: Lucid Chart enables easy sharing and presentation of DFDs, ensuring effective communication and collaboration among stakeholders.
- Collaborate with your team: Lucid Chart facilitates real-time collaboration, allowing team members to work together seamlessly on DFD projects, enhancing productivity and accuracy.
Example: Data Flow Diagram for School Management System

A Lucid Chart Data Flow Diagram for a School Management System visually represents the flow of data within the system, illustrating how information moves between various components such as students, teachers, administrators, and databases. The student information system flowchart outlines the processes involved in tasks like enrollment, attendance tracking, grade management, and communication.
This dfd for student information system provides a clear and structured overview of the system's data flow, aiding in understanding, optimizing, and making informed decisions about the management of school-related information. It is a valuable tool for schools and educational institutions to streamline operations, enhance communication, and improve overall efficiency in managing academic processes.
Create a Lucid Chart Data Flow Diagram Using Wondershare EdrawMax
Wondershare EdrawMax holds significant importance in creating Lucid Chart Data Flow Diagrams (DFDs) due to its user-friendly interface and intuitive tools. Its accessibility caters to users of all technical proficiencies, ensuring a seamless experience. This software empowers individuals, regardless of their familiarity with DFDs, to effortlessly design comprehensive diagrams.
Additionally, EdrawMax offers a vast library of templates and standardized symbols, expediting the diagramming process. Its versatility makes it a valuable tool in academic, professional, and collaborative settings, allowing users to convey complex data flow concepts effectively. Whether for educational purposes, project planning, or team collaboration, EdrawMax proves highly beneficial in simplifying DFD creation.
Here are the steps to create a lucid chart data flow diagram using Wondershare EdrawMax:
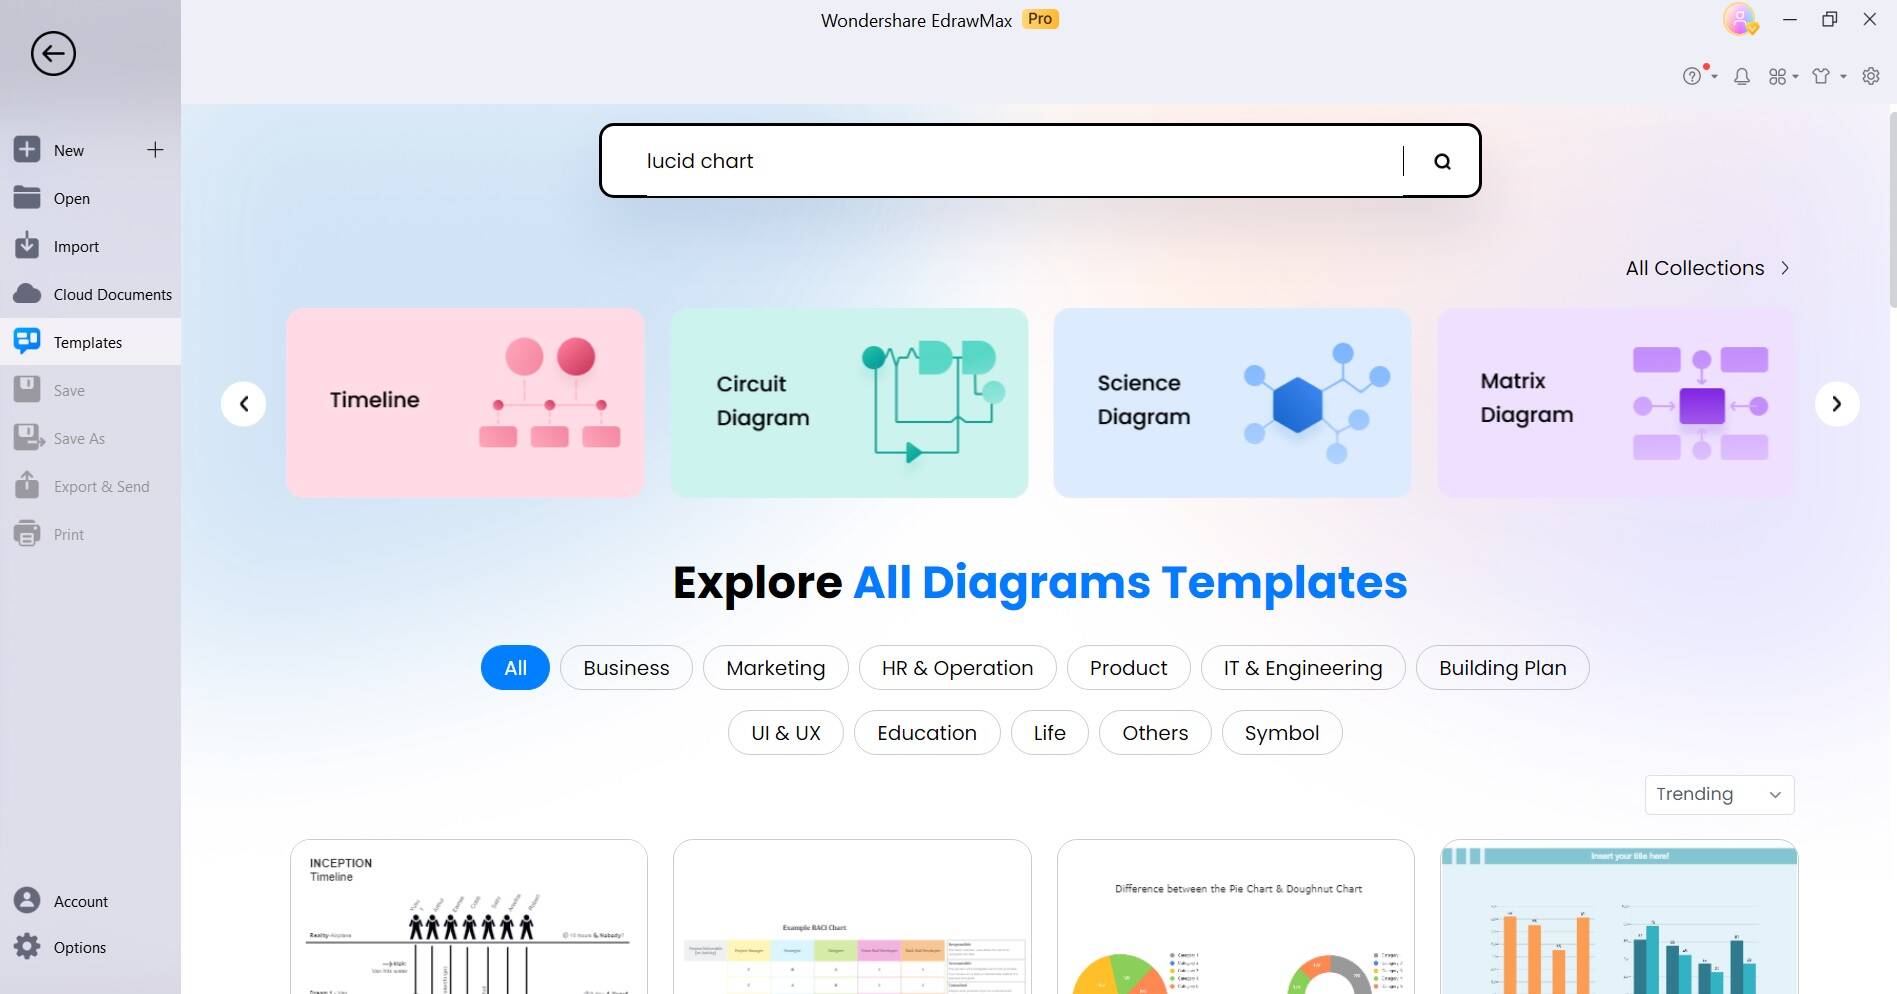
Step 1: Open Wondershare EdrawMax, click on the 'Flowchart' category, and select ‘Data Flow Diagram’ to start from scratch. Alternatively, you can also choose a template of a lucid chart that suits your needs by accessing the Template gallery.
Step 2: Utilize the extensive symbol library by dragging and dropping shapes onto the canvas. These shapes represent processes, data stores, entities, and data flow. Customize them further by adjusting attributes like color, size, and labels.
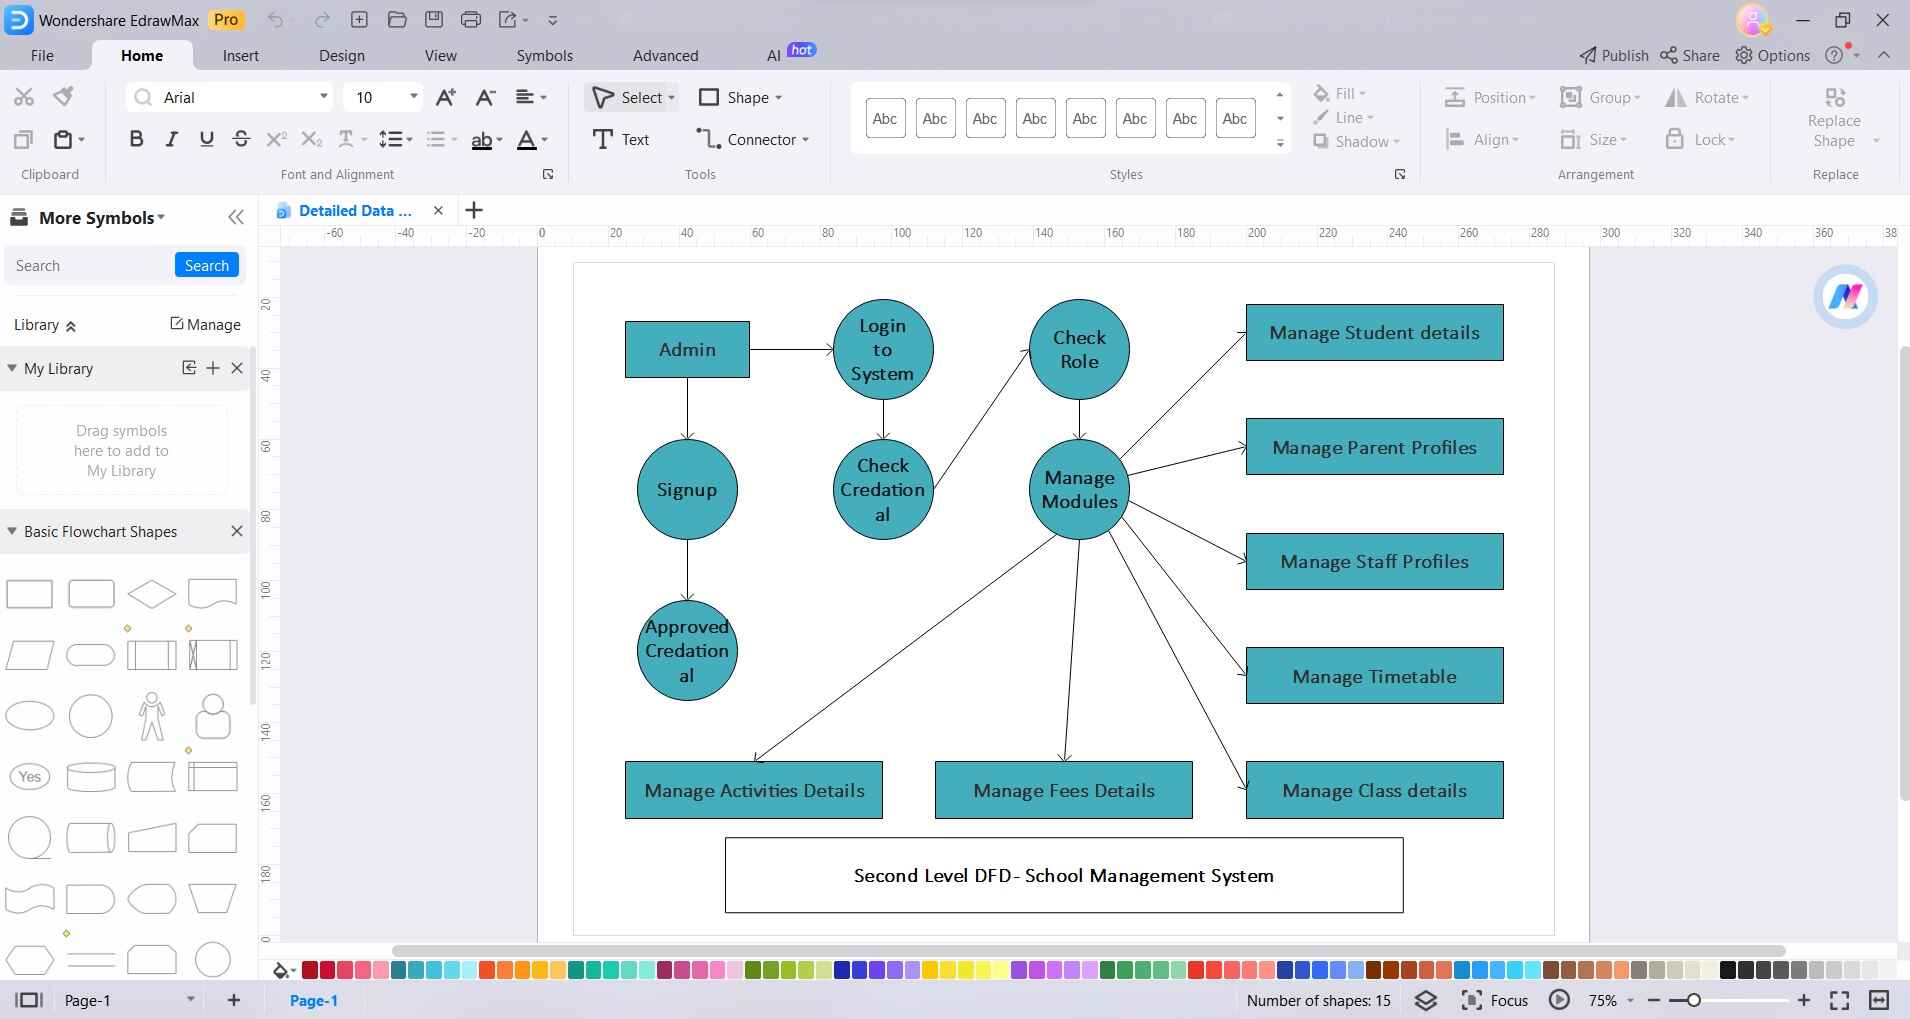
Step 3: Establish connections between the shapes using intuitive lines and arrows. These elements depict the directional flow of data within the system.
Step 4: To ensure a tidy and organized layout, employ alignment and arrangement tools. This step is crucial for enhancing the visual clarity and comprehensibility of the Lucid Chart diagram.
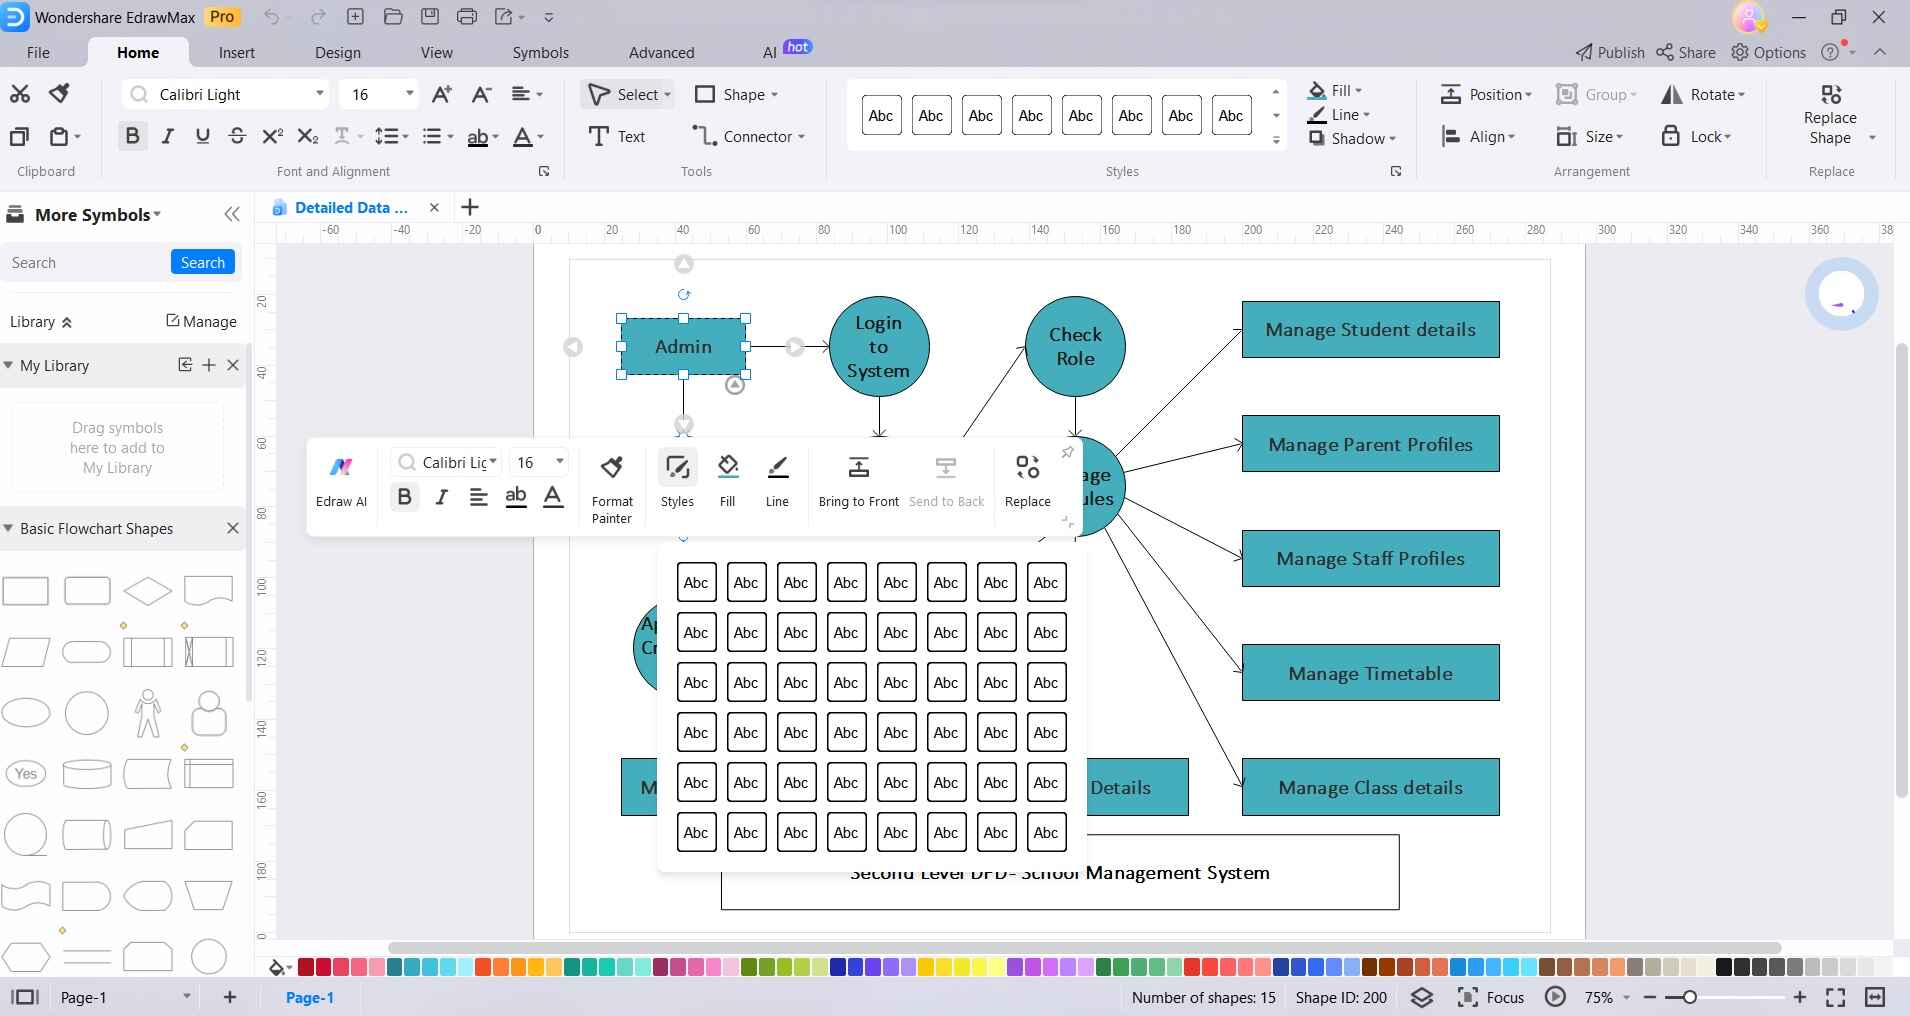
Step 5: Add any necessary textual information or annotations to provide context and clarity. Utilize text boxes to label processes, data stores, or any specific elements of the diagram.
Step 6: Incorporate images or icons from EdrawMax's extensive library to further illustrate elements within the Lucid Chart diagram.
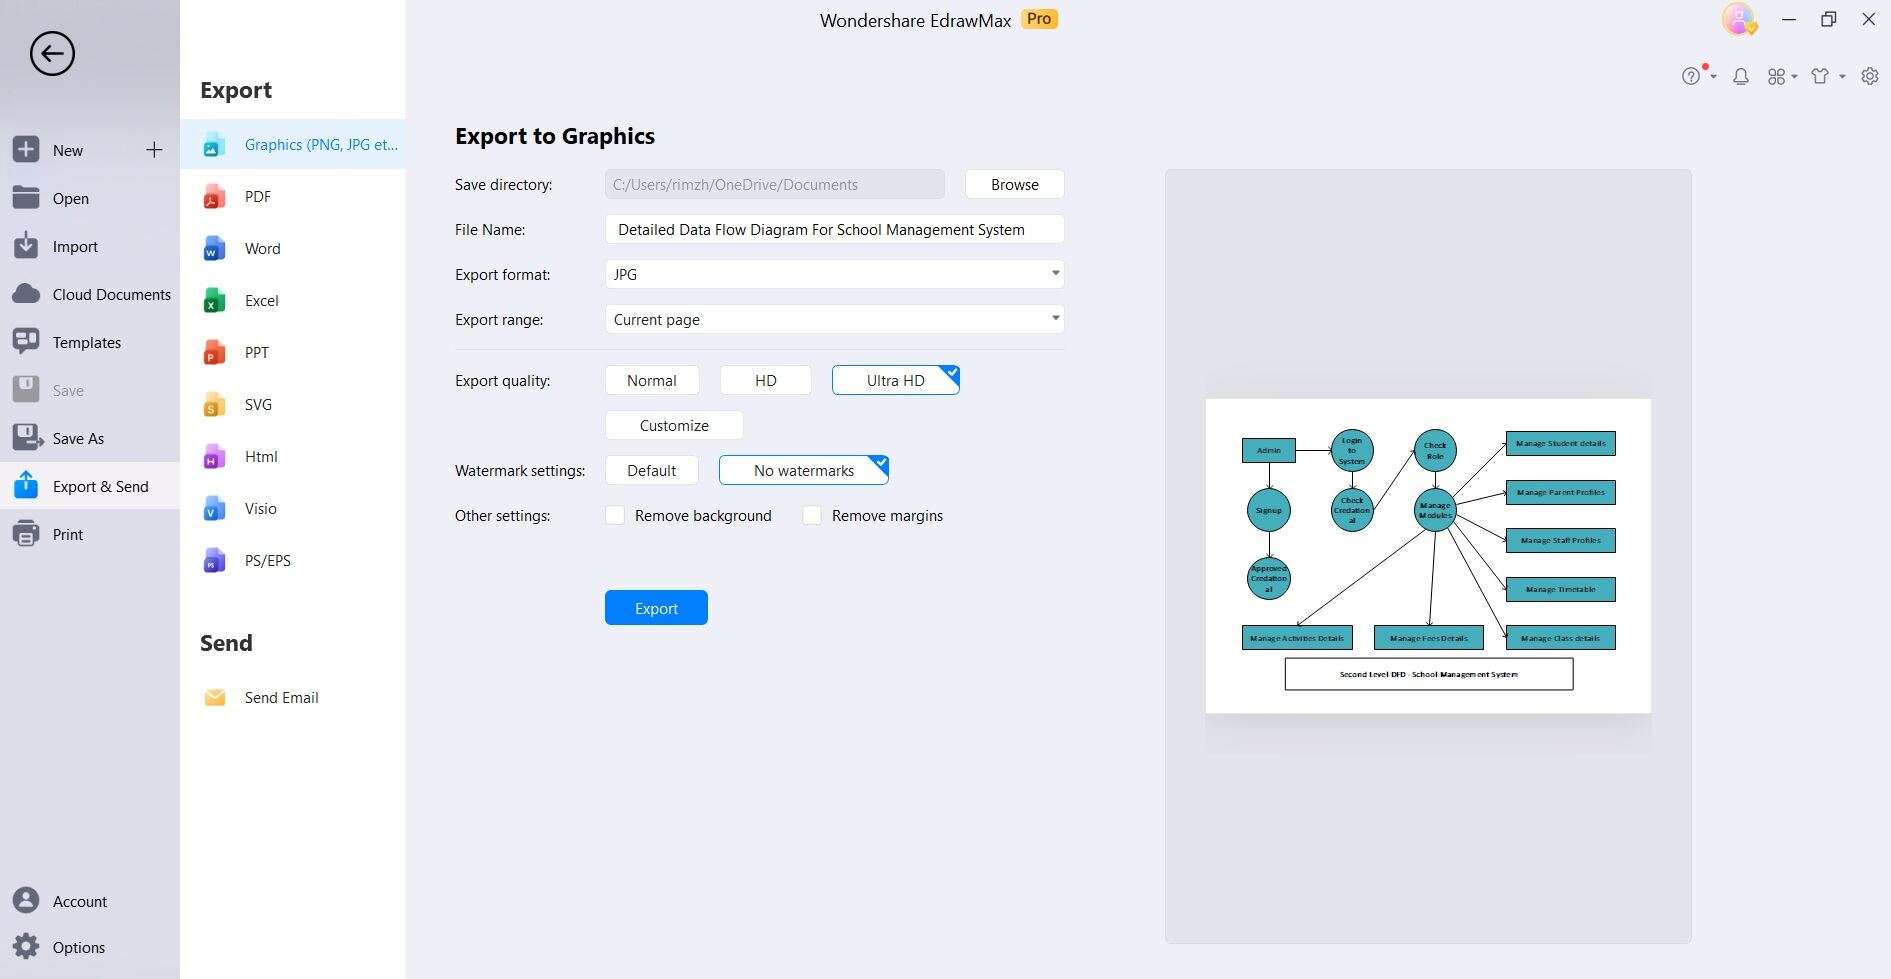
Step 7: Review and refine your Lucid Chart diagram for accuracy, coherence, and visual appeal before saving or exporting it for use. This step ensures that the diagram effectively communicates the data flow within the system. Once you’re satisfied with the results, tap on File>Export and Send to save your project.
Key Takeaway: The primary advantage of using EdrawMax for crafting Lucid Chart Data Flow Diagrams lies in its user-friendly interface and extensive library of symbols and templates. This software simplifies the process, allowing users of varying technical proficiencies to create comprehensive and visually appealing diagrams.
EdrawMax's intuitive tools streamline the design process, ensuring an accurate representation of data flow within a system. Its versatility and collaborative features make it a valuable tool for educational, professional, and team-oriented environments, ultimately enhancing the clarity and effectiveness of communication through Lucid Chart DFDs.
Conclusion
Learning the steps to create a Lucid Chart Data Flow Diagram empowers individuals and teams to efficiently analyze and communicate complex data processes. Through careful planning and execution, one can harness the visual power of Lucid Chart to represent data flow with precision and clarity. Utilizing the right symbols and notation ensures accurate depiction, while advanced features simplify intricate tasks.
Moreover, EdrawMax's user-friendly interface and extensive library of templates streamline the process, making it accessible to users of all levels of proficiency. By following these steps, one can harness the full potential of Lucid Chart in creating insightful and informative Data Flow Diagrams that enhance decision-making and optimize processes.
AI Diagram Generator
Enter your prompt. Upload files if needed. Generate diagrams, charts, or slides instantly.


