In the digital era, online examinations are reshaping assessment methods. Data Flow Diagrams (DFDs) are key to understanding this shift. This article makes it easier to create a DFD for an Online Examination System. It offers a clear guide for architects, developers, and enthusiasts who want to understand how this important educational technology functions.
Further, we will explore the foundation of modern assessment systems with the power of a data flow diagram.
Contents of the article
What is an Online Examination System?
An Online Examination System is a digital platform that allows individuals to take tests or exams using the Internet. This article explores the use of Data Flow Diagrams to visually represent how information moves within this system. Understanding this flow gives readers insights into constructing and improving online assessment platforms for testing that are both efficient and effective.
So, a DFD can be categorized in the following forms:
1. Context diagram: This is the highest-level view of a system that shows the entire process in a single diagram. It represents how the system interacts with external entities, such as users or other systems.
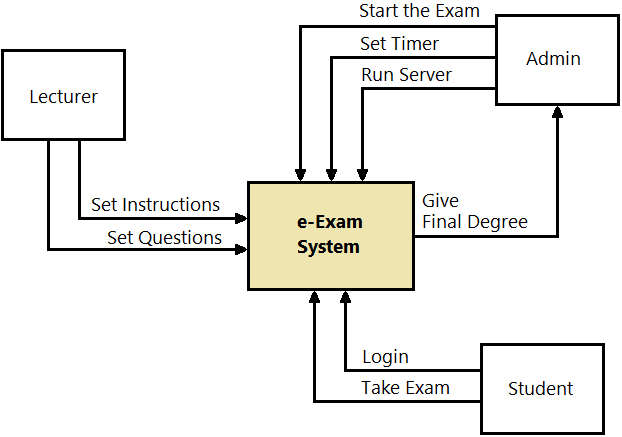
2. First-level DFD: This breaks down the context diagram into more detailed sub-processes, providing a clearer picture of how data flows within the system. It shows major processes and their interactions with data sources and sinks.
Importance of Examination DFD
DFDs for examinations are vital because they visually depict how information circulates within an assessment system. They offer a clear blueprint for architects and developers, ensuring smooth operation. DFDs make system design and optimization effective by simplifying intricate processes into understandable visuals.
This leads to streamlined online examinations, improving accessibility and efficiency for both examiners and examinees.
Online Examination System DFD
- 0 Level DFD for Online Examination System
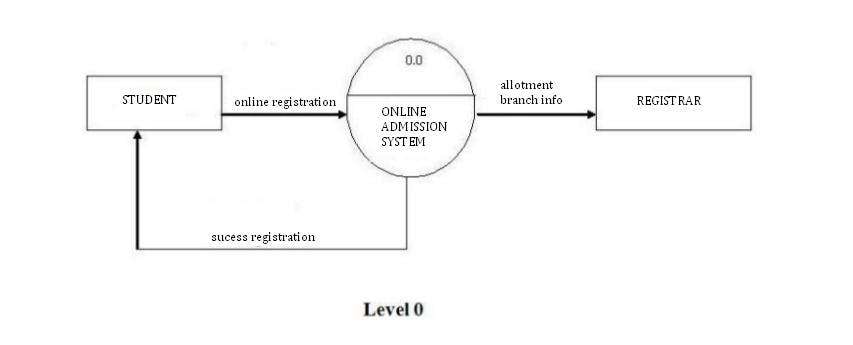
Depicts the entire system's interaction with users and the database. It showcases how the system interacts with external entities like users and databases.
- Level 1 DFD for Online Examination System
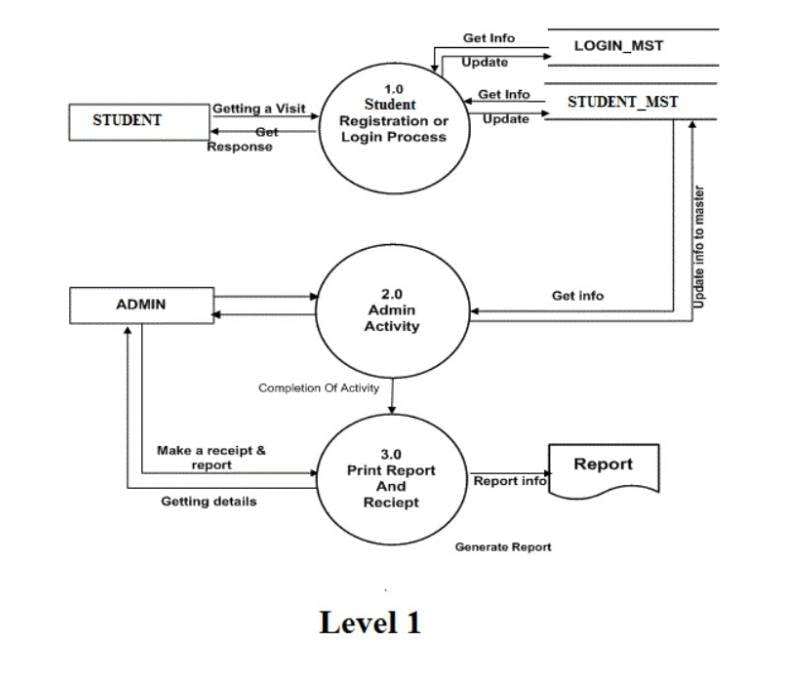
The level 1 data flow diagram for the examination system manages user accounts, question banks, generating reports and exam scheduling. It may also oversee exam sessions, handle user authentication, and record responses.
- Level 2 DFD for Online Examination System
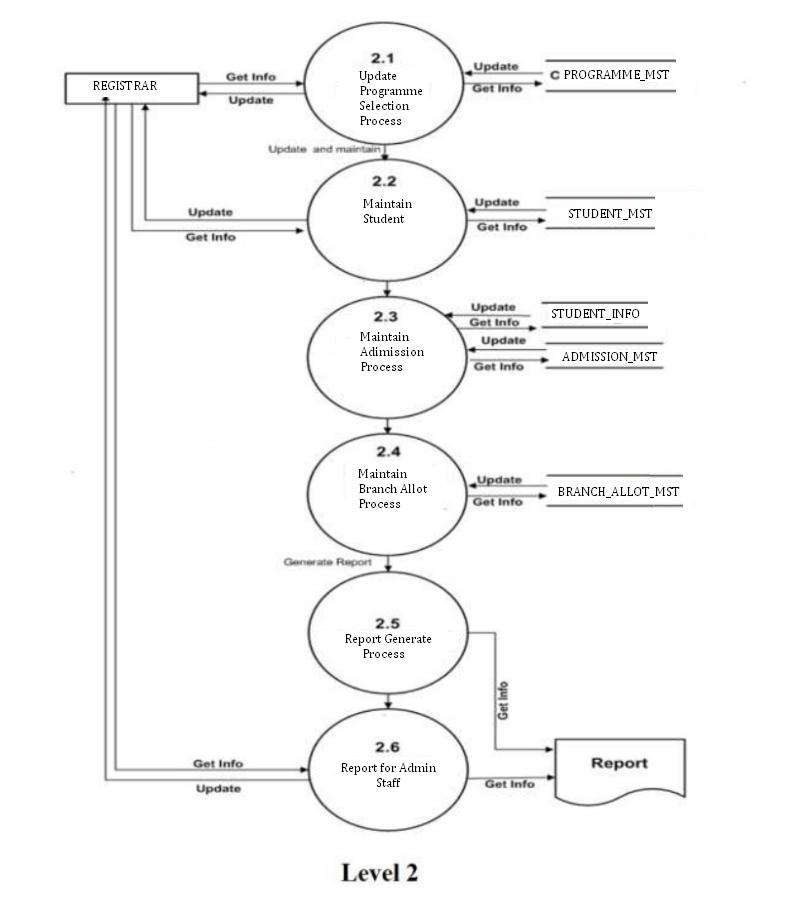
Involves tasks like user registration, login, and profile updates. Deals with creating, editing, and deleting questions. May also include specific functions like setting up and assigning exams to users or groups.
Create DFD for Online Examination System
Wondershare EdrawMax greatly simplifies the creation of a Data Flow Diagram (DFD) for an Online Examination System. Its user-friendly interface and intuitive drag-and-drop functionality simplify the creation of entities, processes, and data stores.
The vast collection of pre-designed shapes and symbols tailored for DFDs enables swift customization.
EdrawMax's collaborative features also enable seamless teamwork on the diagram. In summary, this tool offers an efficient and effective platform for visualizing information flow within the system. It proves to be an invaluable resource for architects, developers, and system analysts.
Here are the steps to use Wondershare EdrawMax to create a sample data flow diagram for an online examination system:
Step 1: Start by launching Wondershare EdrawMax on your computer.
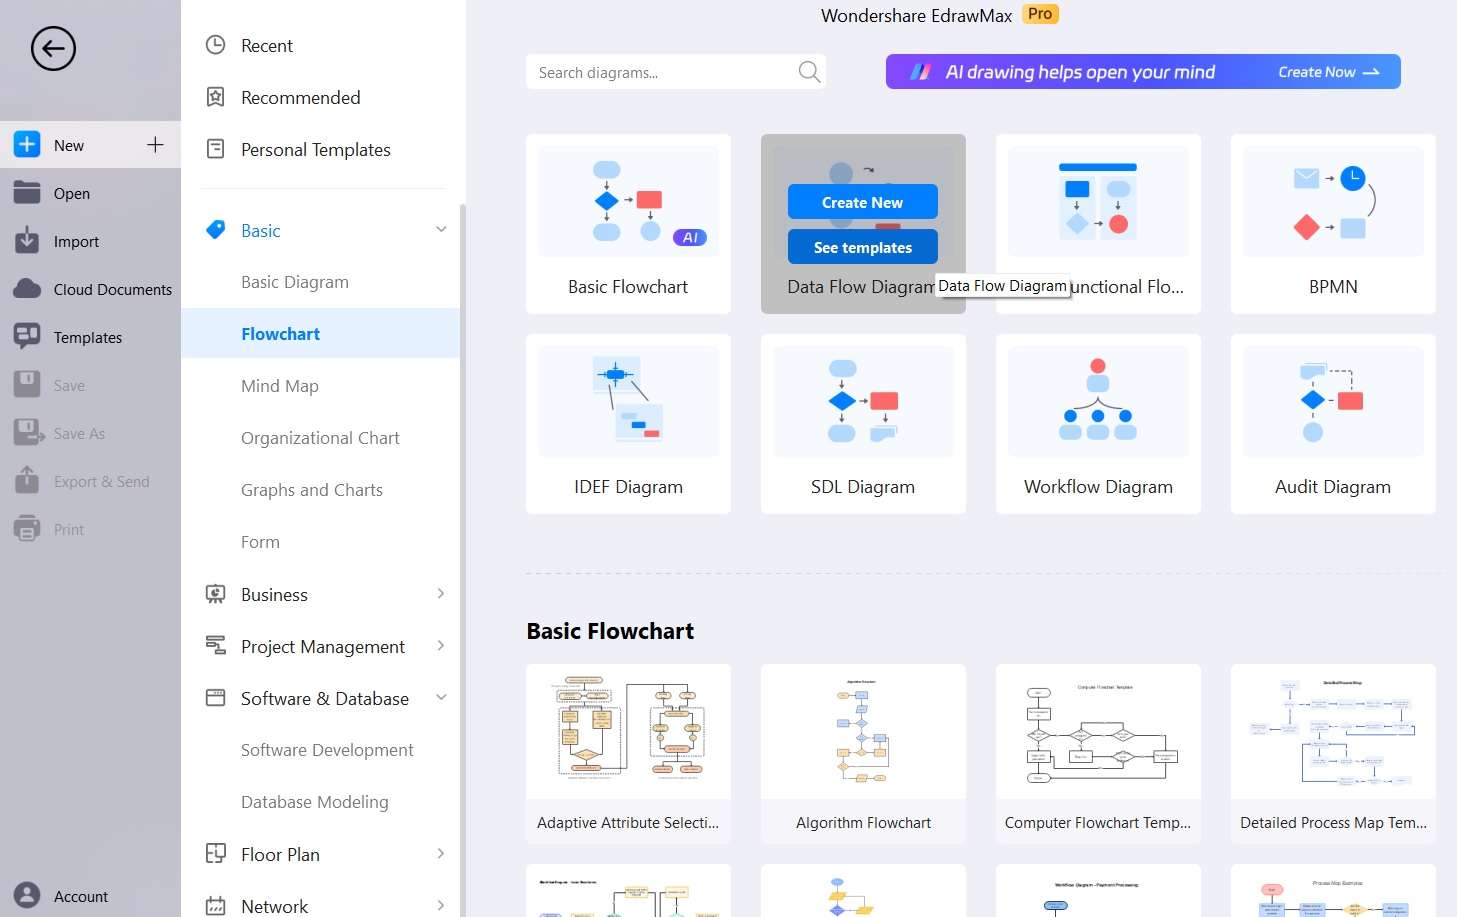
Step 2: Tap on New> Basic> Flowchart to get started. Select Data Flow Diagram (DFD) from the available options. Click on “See Templates” and see if you are able to find any related results.
Step 3: Now, on the canvas of EdrawMax, begin by adding entities such as 'User', 'Administrator', and 'Database' to the canvas. Incorporate processes like 'User Authentication', 'Exam Conducting', and 'Result Processing' to represent system functionalities.
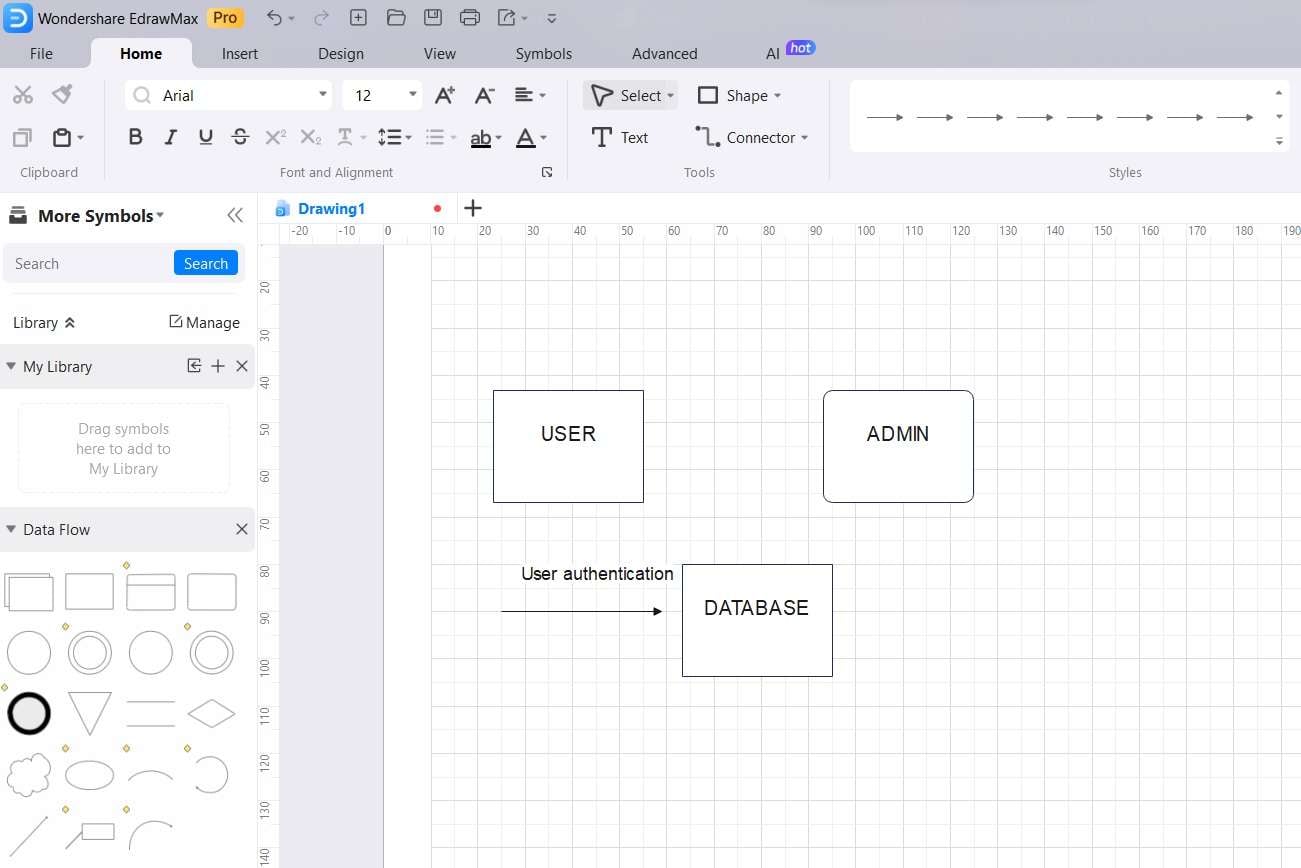
Step 4: Use arrows or lines to connect entities and processes, illustrating the flow of data between them. Ensure the connections accurately represent how information moves within the Examination System.
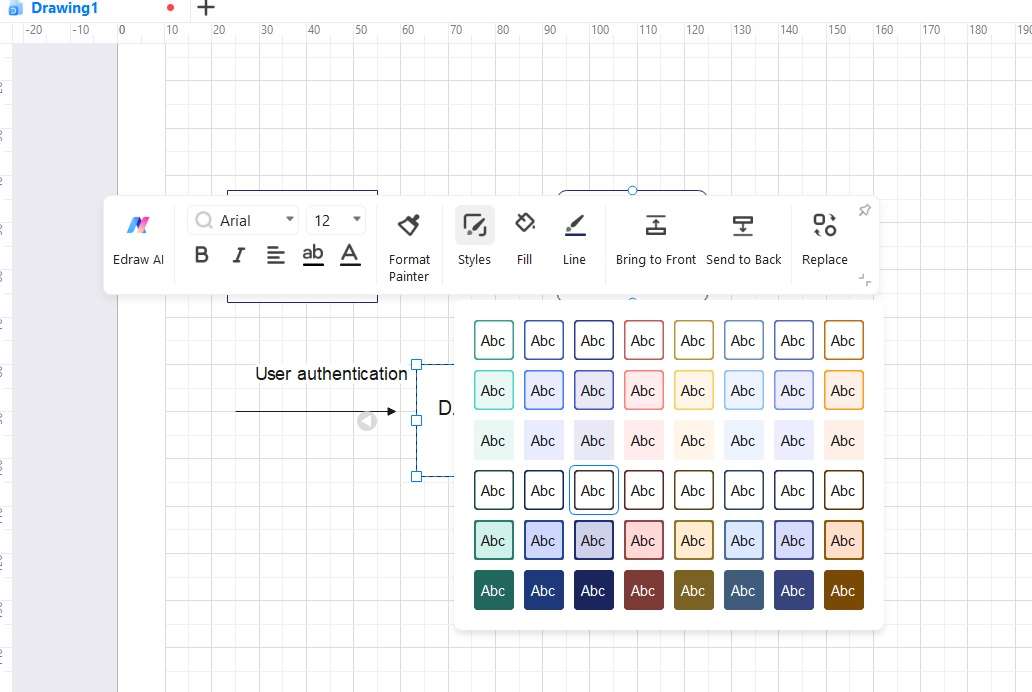
Step 5: Modify or format shapes, labels, and text to enhance clarity and make the diagram more visually appealing. To do so, simply select an entity and click on “Styles”.
Step 6: You can also take advantage of EdrawMax's extensive library of pre-designed symbols specific to DFDs for quick and easy customization.
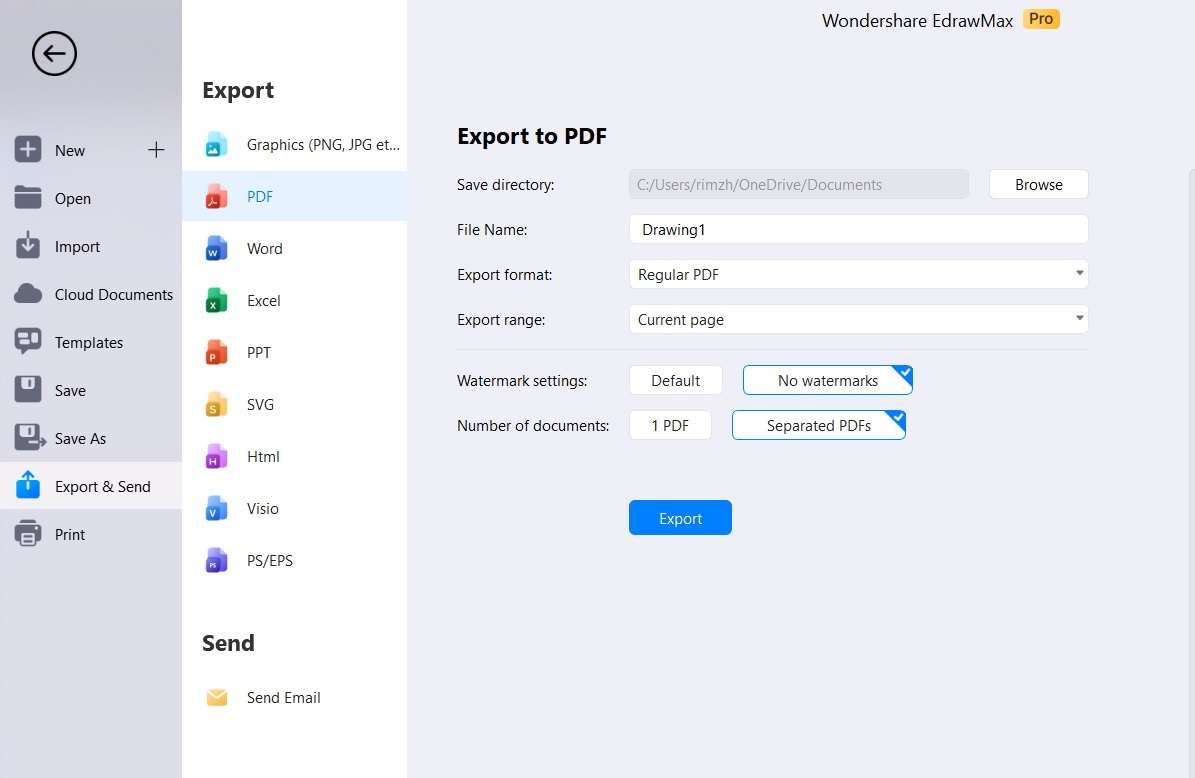
Step 7: Take a moment to review the DFD for accuracy and coherence, making any necessary refinements for a polished final product. Save and export the DFD in your preferred format for easy sharing and integration. Tap on File> Export & Send.
So, yes, by following these steps, you can efficiently create a sample Data Flow Diagram for an Examination System using Wondershare EdrawMax.
Key Takeaway : The primary benefit of employing Wondershare EdrawMax for crafting a Data Flow Diagram (DFD) for an online examination system is the notable ease and efficiency it introduces to the process. EdrawMax's intuitive interface, a comprehensive library of DFD-specific symbols, and collaborative functions simplify diagram creation. This enables users to visually depict complex systems with clarity and accuracy.
EdrawMax allows architects, developers, and system analysts to save time and effort, ensuring a well-organized and easily understandable DFD for optimizing and enhancing examination systems.
Conclusion
Data Flow Diagram (DFD) serves as a pivotal tool in comprehending the inner workings of an Online Examination System. This diagrammatic approach simplifies system design, ensuring efficiency and effectiveness in online assessments. With a thorough understanding of data flow, we stand poised to shape the future of online assessments, offering a seamless and accessible means of evaluation in the digital age.
Only added this section because it was a part of the approved outline. It can be omitted as well if not required.


