


In the digital age, visualizing data flow is crucial for efficiency. Data Flow Diagrams (DFDs) offer a clear view of information movement within a system. This guide will walk you through the process of crafting a DFD using Microsoft Visio, a user-friendly tool with powerful capabilities.
With the aid of Visio, you'll be equipped to create a Visio data flow diagram. Get ready to enhance your data management and decision-making processes efficiently.
In this article
The Components of Data Flow Diagrams
Data Flow Diagrams (DFDs) comprise the following key components:
- Processes: These represent activities or functions that manipulate data.
- Data Stores: Locations where data is stored for retrieval and use.
- Data Flows: Arrows depicting the movement of data between processes and data stores.
- External Entities: Represent external sources or destinations of data.
- Annotations: Additional details or descriptions that enhance understanding.
Together, these elements form a visual blueprint, enabling a clear comprehension and analysis of data flow within a system or organization.
Steps to Create a Data Flow Diagram Using Microsoft Visio?
Here are the steps to create a Visio data flow diagram in no time:
Step 1: Open Microsoft Visio on your computer.
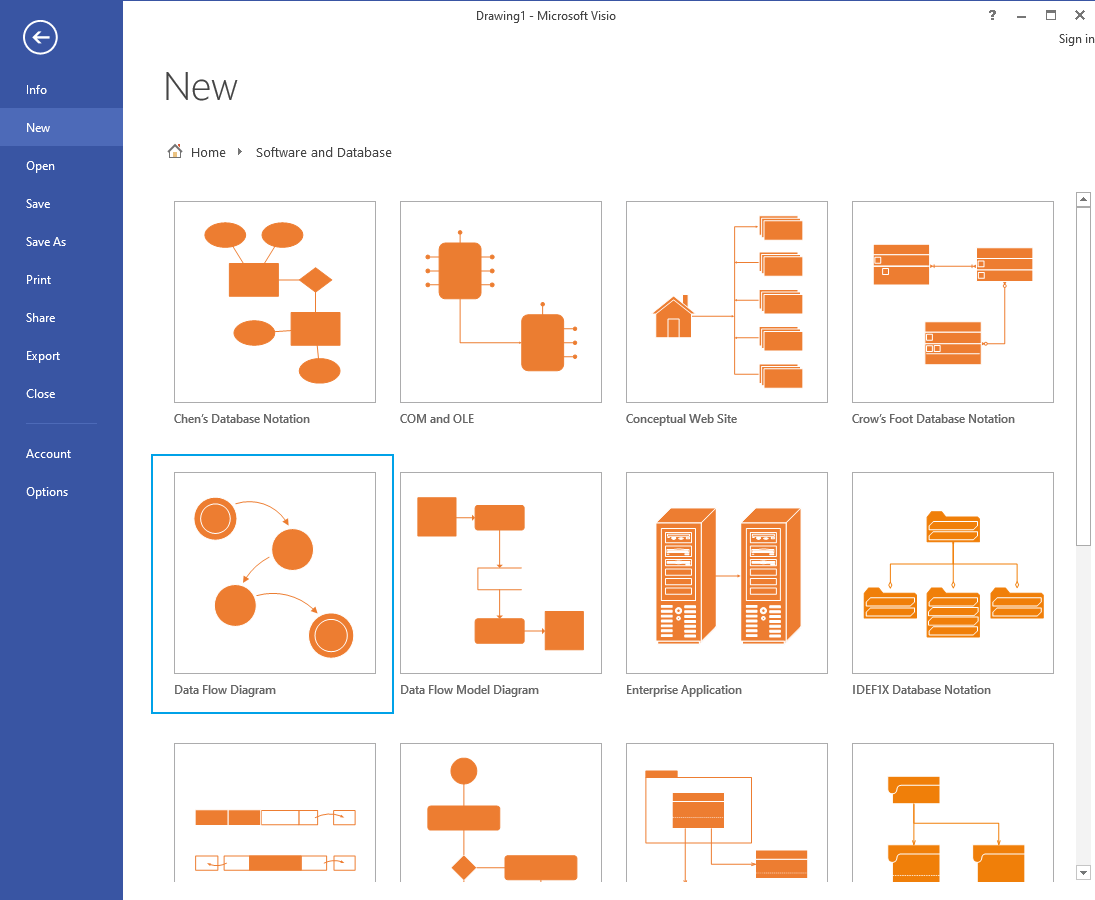
Step 2: Microsoft Visio provides a range of pre-designed templates for your convenience. Simply access the 'New' tab to explore and select from the available templates.
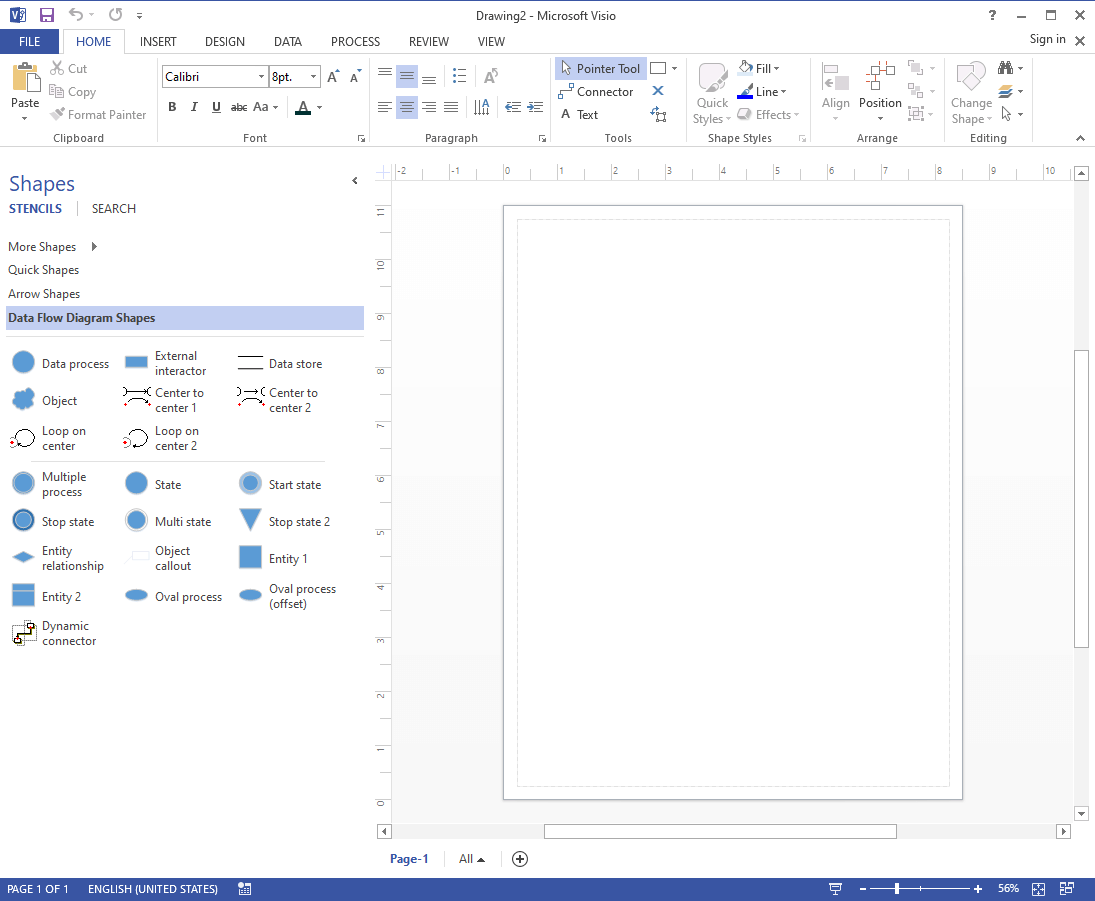
Step 3: Drag and drop process shapes for activities, data stores for storage, external entity shapes, and data flow arrows onto the canvas. Connect these shapes using arrows to represent the flow of data.
Step 4: Apply any additional formatting or styling to enhance visual appeal.
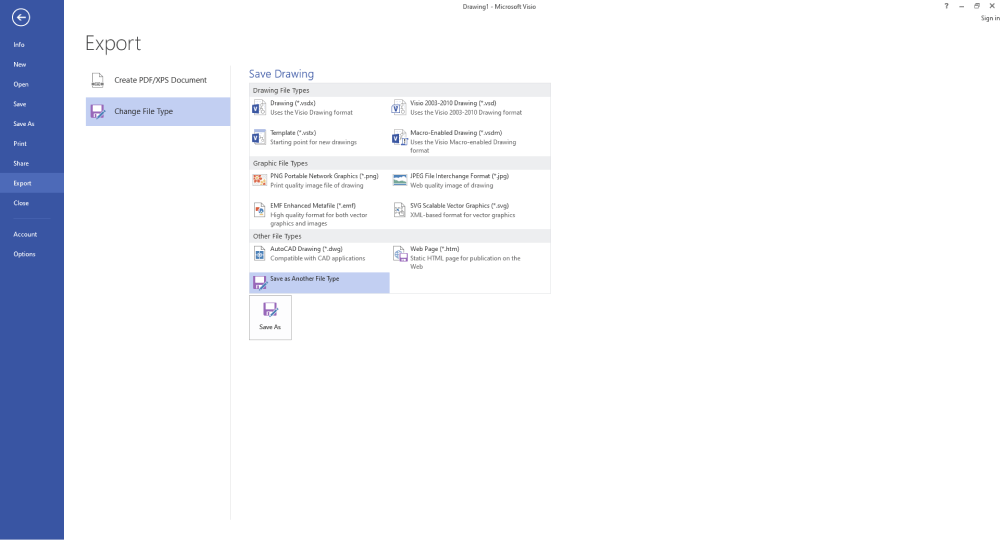
Step 5: In Visio, you have the flexibility to select from a diverse range of entities and connectors for your data flow chart. Additionally, there are various options available to enhance the visual appeal of your work. To save your progress, simply click on "File" and then select "Save As" when you're finished.
By following these steps, you'll have successfully created a Data Flow Diagram using Microsoft Visio, providing a visual representation of data movement within your system or process.
How to Make a Data Flow Diagram Online Easier?
Creating a Visio data flow diagram can be a complex and time-consuming process, especially for beginners who need to familiarize themselves with the software and its tools. This learning curve can significantly delay your task.
However, if you're looking for a seamless experience in generating effective data flow diagrams, Wondershare EdrawMax Online offers a solution. This all-in-one diagramming tool simplifies the process, providing a comprehensive platform for creating various diagrams, from flowcharts and P&ID to UML diagrams and floor plans.
With over 280 diagram types supported, EdrawMax offers a versatile solution for your diagramming needs.
Here are the steps to create a data flow diagram using EdrawMax:
Step 1: Launch the Wondershare EdrawMax tool on your PC.
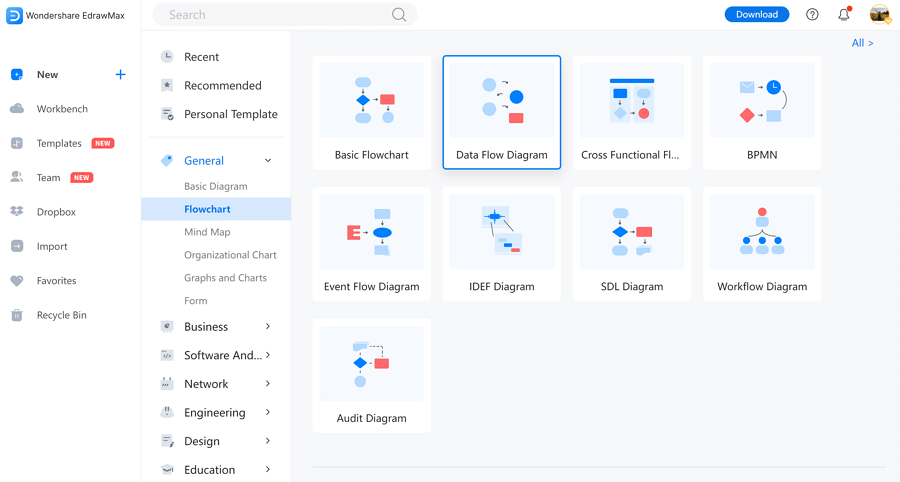
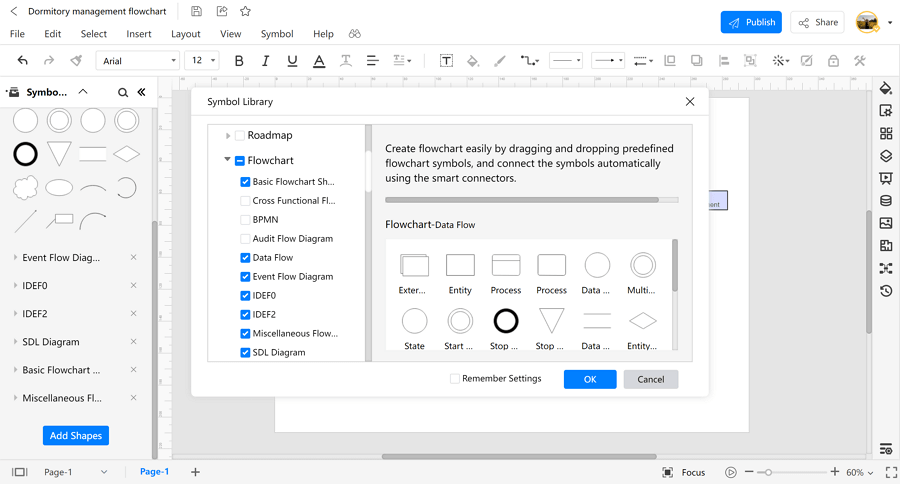
Step 2: After launching the application, access the "Flowchart" category, then proceed to select "Data Flow Diagram." At this point, you can choose to either initiate a new data flow diagram or browse through a selection of templates according to your preference.
Step 3: In the left libraries, you'll discover a range of symbols including flowchart and data flow elements. It's worth noting that all these pre-set symbols are available for Edraw users to freely incorporate into their diagrams.
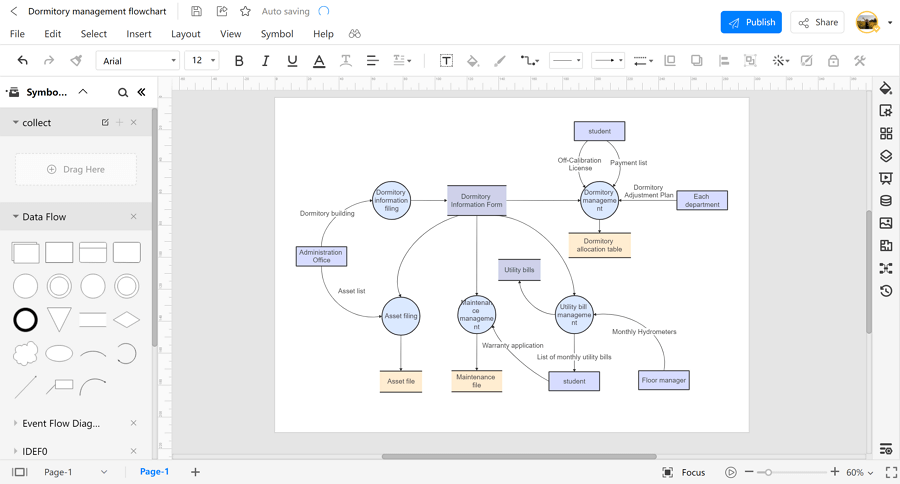
Step 4: Label the symbols that hold significance in the process with descriptive text. Also, add various formatting styles, if required.
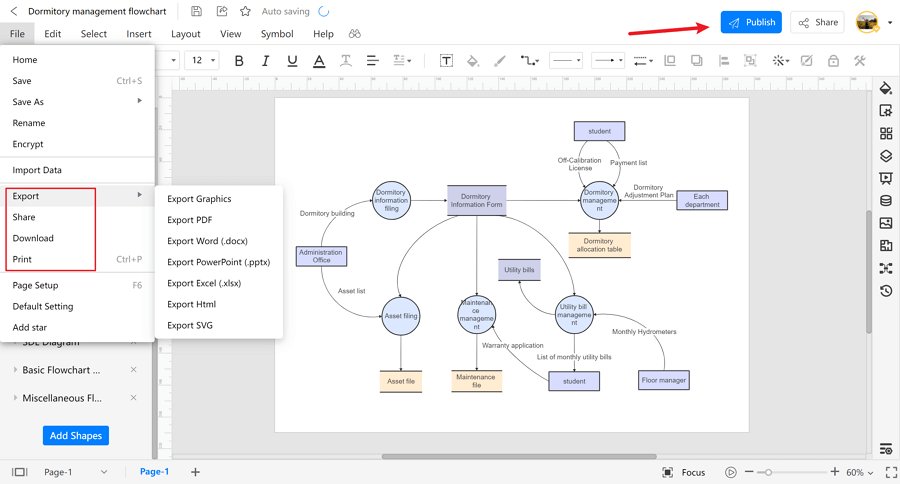
Step 5: After finalizing your data flow diagram, it's time to export it. You have the option to save it in various formats such as PNG, PDF, VSDX, PPTX, and more. Additionally, you can directly export your diagram as a Visio file.
Data Flow Diagram Visio Examples
Below are a few Visio data flow diagram examples that you can directly edit or customize to suit your specific needs.
Example 1: Data Flow Diagram Level 0
This context diagram visio illustrates the highest level of abstraction, presenting an overview of the entire system and its major processes. It offers an overview of data flow within the system's architecture from a high-level perspective.
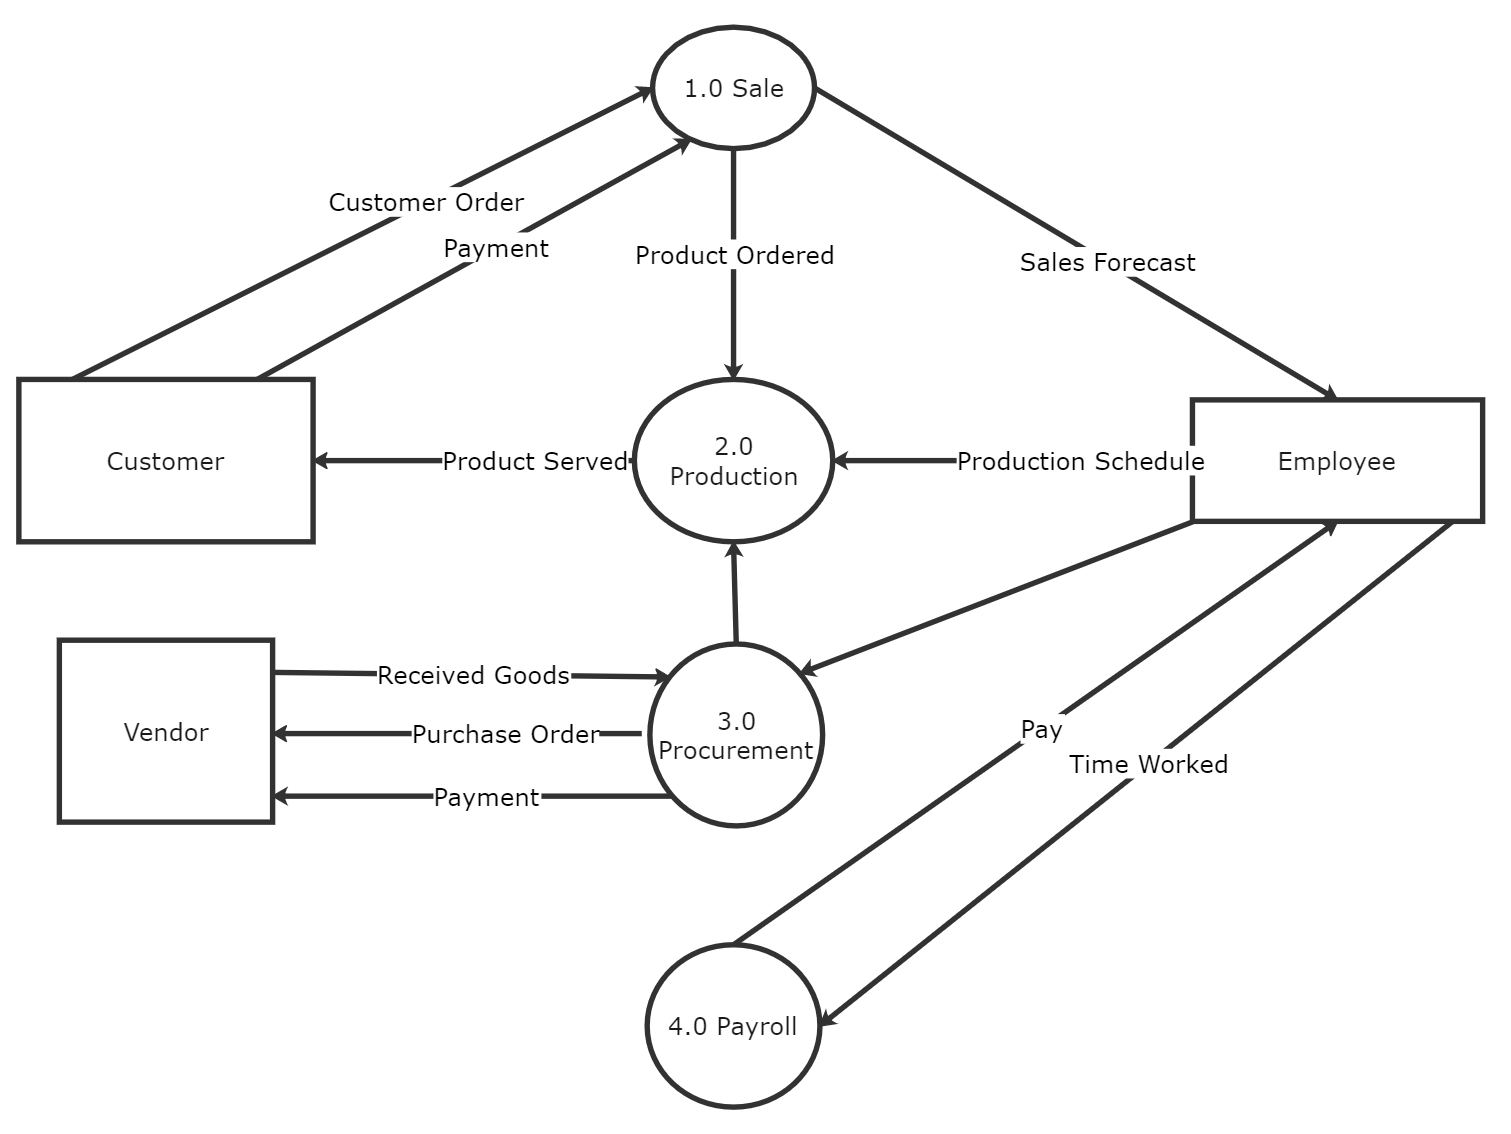
Example 2: Data Flow Diagram Level 1
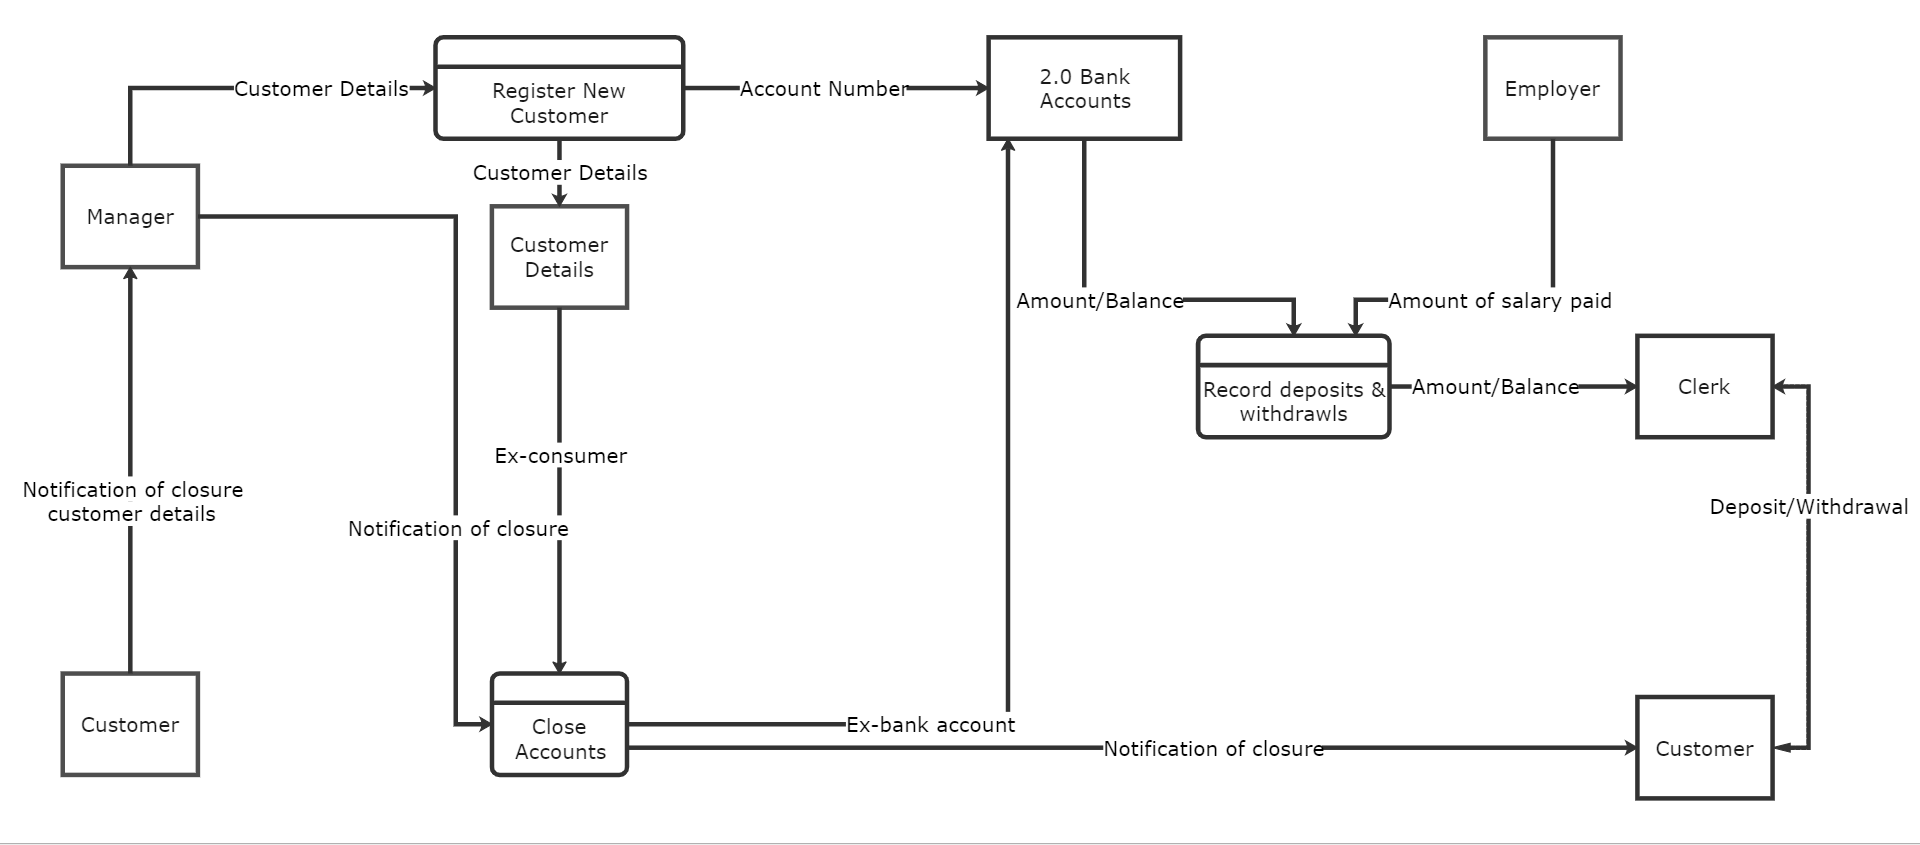
At Level 1, the DFD delves deeper into the processes outlined in Level 0. It breaks down each major process into sub-processes, offering a more detailed view of data flow, interactions, and dependencies.
Example 3: Data Flow Diagram for Online Shopping
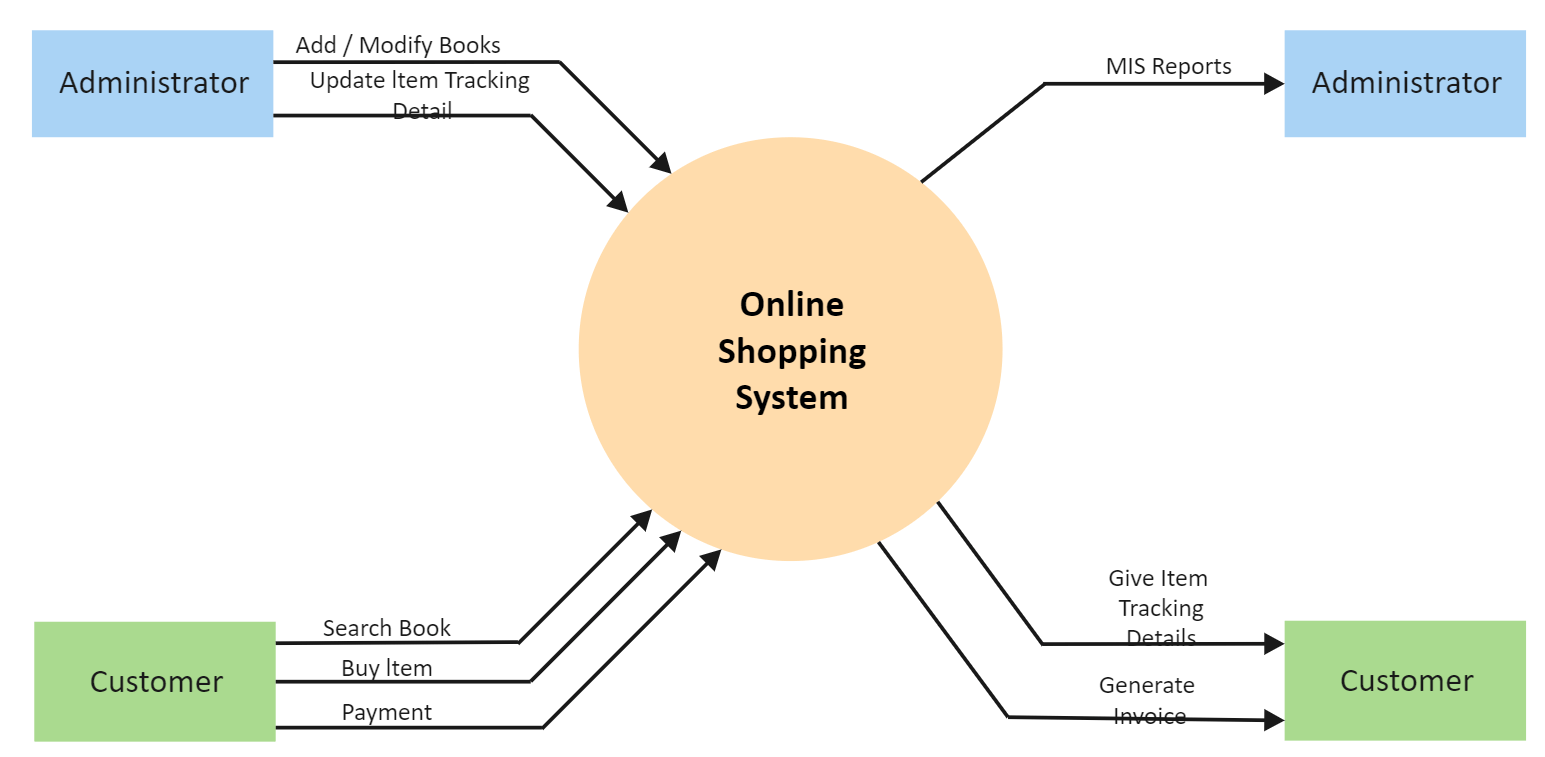
Specifically tailored for e-commerce platforms, this DFD outlines the flow of data in an online shopping system. It illustrates how users interact with the website, how orders are processed, and how data moves between various components of the platform.
Conclusion
Learning the skills of creating a Visio Data Flow Diagram empowers individuals and organizations to gain invaluable insights into their data processes. With careful consideration of components, precise connections, and thoughtful formatting, these diagrams become powerful tools for enhancing data management and decision-making.
The efficiency and clarity offered by EdrawMax's intuitive interface make it an indispensable asset in the realm of process visualization. By following the steps outlined in this guide, you now possess the knowledge and skills to effectively represent data flow within your systems. Make the most of this proficiency to drive efficiency, streamline operations, and ultimately, propel your projects towards success.
AI Diagram Generator
Enter your prompt. Upload files if needed. Generate diagrams, charts, or slides instantly.


