Are you handling the complicated world of data management, where structure and visualization of information is critical? Flowcharts serve as powerful visual aids, simplifying a system's intricate web of data relationships. These visual representations play a very important role in enhancing the efficiency.
This article explains the fundamentals of database flow diagrams online and will tell more about their components, symbols, and best practices for creating them. By the end, you'll understand how these diagrams can streamline data management and simplify the knowledge of intricate data relationships.
In this article
What is a Data Flow Diagram?
A Data Flow Diagram (DFD) also known as a database flowchart it is a graphical depiction of a system or process that depicts the flow of data through it. This flowchart explains how data enters, processes, and departs a system or database. It makes it a valuable tool for comprehending complex data interactions.
DFDs uses symbols and arrows to show many data elements and their relationships and makes the difficulty of data management and transformation easier to understand. DFDs support successful communication, analysis, and system design by providing a clear and organized overview of data flow. DFD ensures that users can better perceive and control the flow of information inside a particular process or database.
Elements of a data flow diagram
A typical DFD (Data Flow Diagram) has four basic components.
- Processes: These are represented by rectangles and represent the system's essential tasks, activities, or processes. Processes are responsible for altering, transforming, or creating data as required.
- Information Stores: Those are represented as open-ended rectangles and as a data repository. Databases, files, and even actual papers are examples.
- Data Flows: Data flows, depicted as arrows, depict the complicated channels through which data travels between processes, data storage, or external entities. These directional arrows are quite helpful in tracing the data path throughout the system.
- External Entities: These are depicted as squares or rectangles and represent external components or systems that interact with the system under investigation.
Symbols to make database flowchart
The symbols are standardized to guarantee simplicity and uniformity in the depiction of data flows. A few often-used make database flowchart symbols are:
- Curved rectangles: These represent system processes.
- Open-ended rectangles: Denote information storage locations in data repositories.
- Arrows: Data flows are depicted, and arrows indicate the data transport path.
- Squares or rectangles: Denote the presence of outside actors engaging with the system.
How to Create a Data Flow Diagram with Your Team?
Creating flowcharts is part of the process of creating a database. Suppose you and your team want to make data management easier. Select Wondershare Edrawmax it is an easy-to-use tool for creating flowcharts. Make a goal then customize your canvas by adding elements such as processes and connecting them with ease. This tool simplifies complexity and converts frustration into success. It is an asset in overcoming database issues and assist your team to reach its full data management potential.
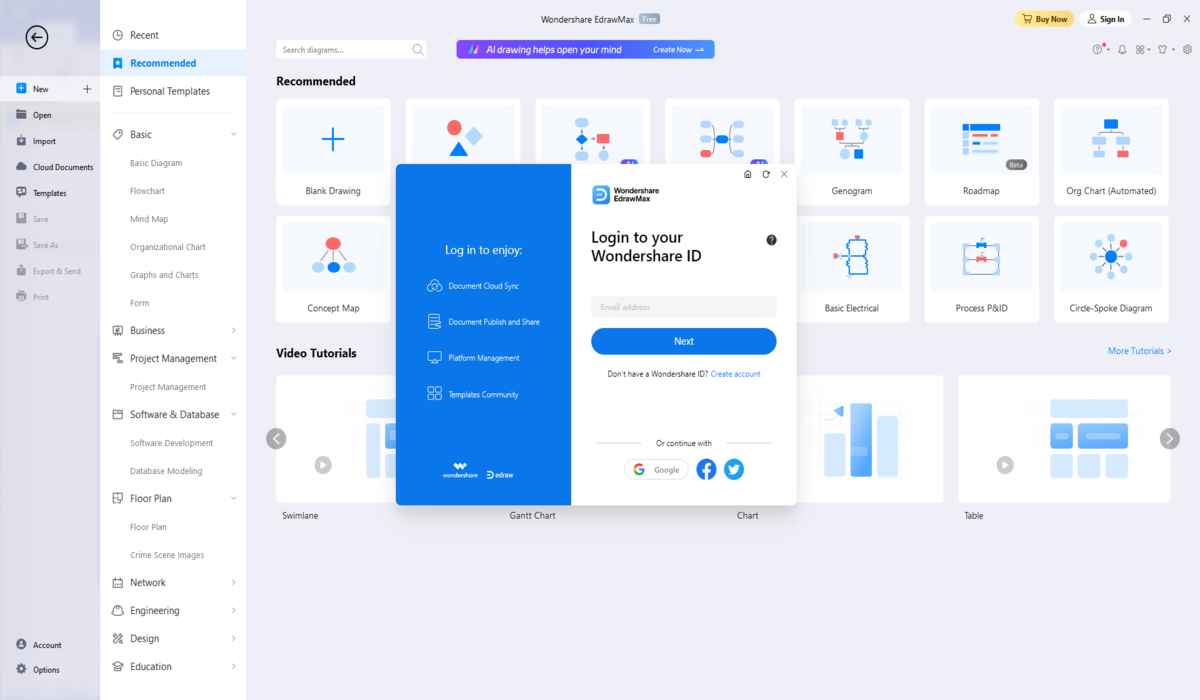
Step 1: Download Edrawmax and Login
Establish the goals and boundaries of your data flow diagram first. Choose the process or system you want to analyze and decide the individual elements you want to include in the diagram.

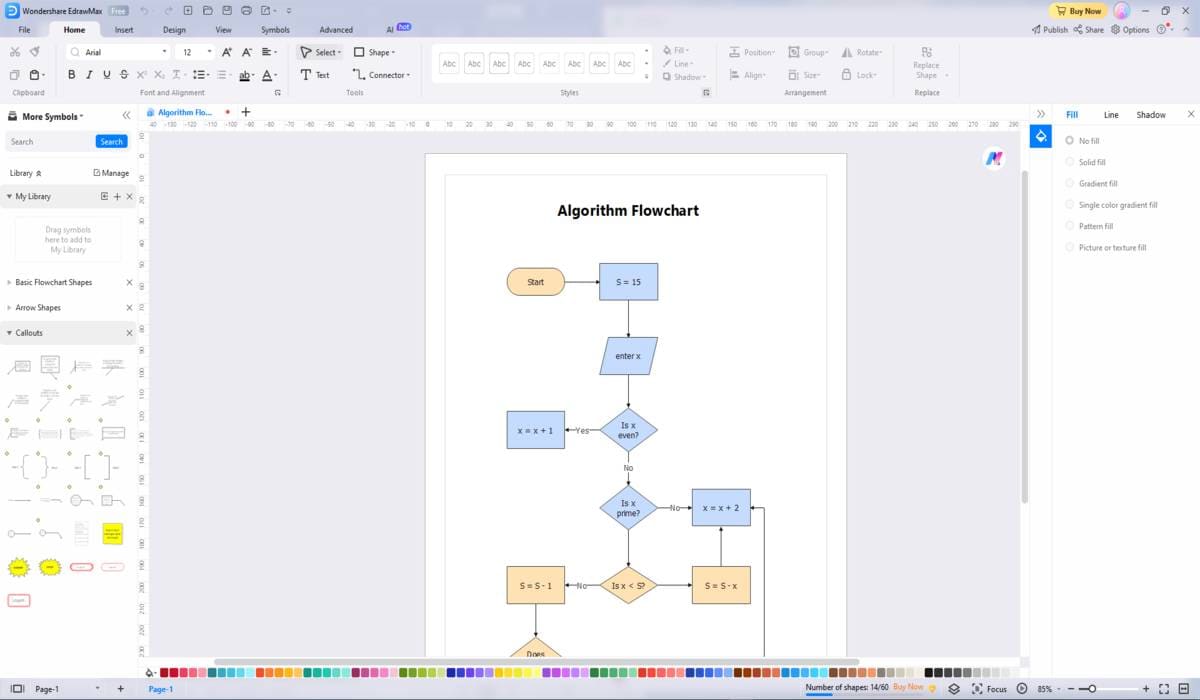
Step 2: Open a blank canvas or select a template
Select an appropriate platform for developing your flowchart. Other tools are accessible online, but one of the most user-friendly is Wondershare Edrawmax, which provides pre-designed templates for database flowchart symbols.

Step 3: Customize your Data Flow Diagram
You can customize the canvas or template to suit the needs of your project first. Set up placeholders for your system's operations and data storage, as well as for external entities and system boundaries.

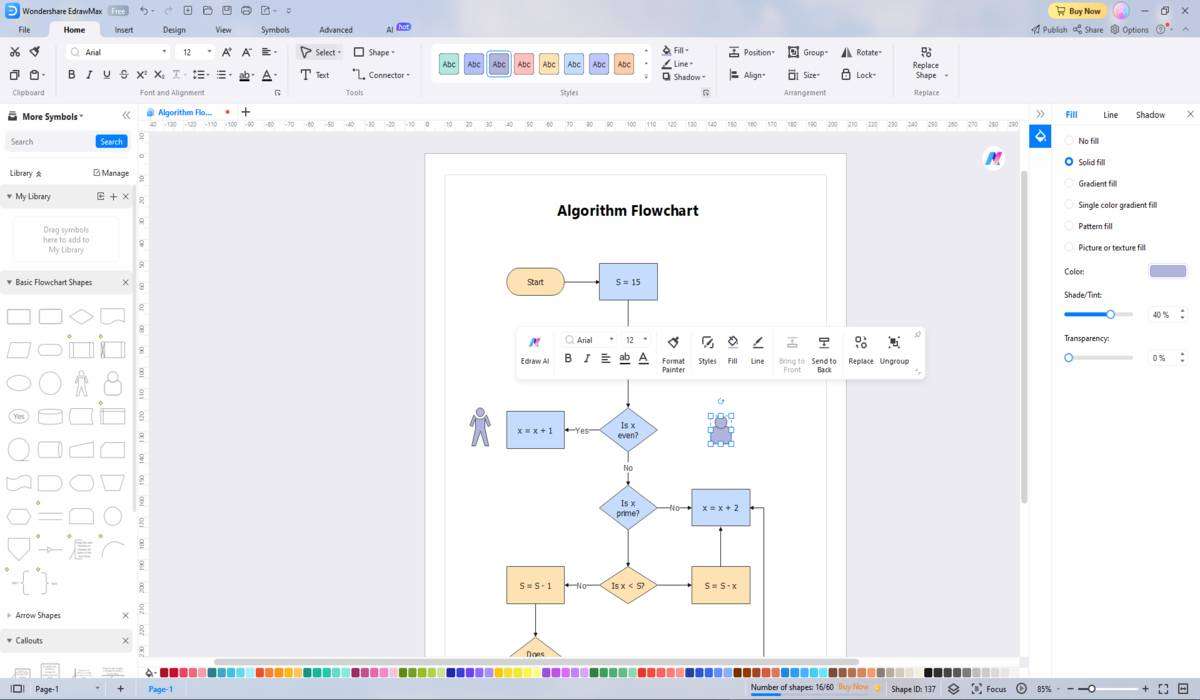
Step 4: Add elements in the flowchart
Start constructing the canvas by adding processes, data sources, flows, and external entities. Use the proper names and symbols to represent each element appropriately. To depict the data flow, connect them with arrows.

Step 5: Export or share
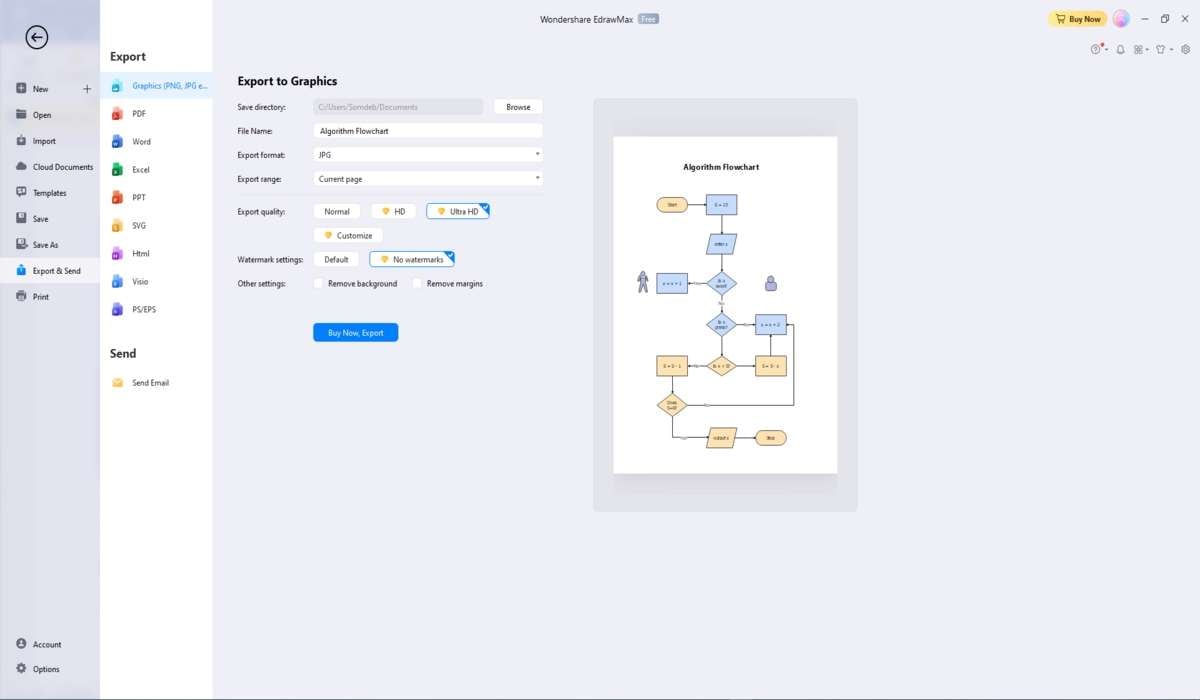
You can export your flowchart as a PDF or image file to share with your team or other stakeholders. Real-time collaboration is another feature of collaboration tools like Edrawmax, which makes it simple to work together on the same diagram.

Benefits of Wondershare Edrawmax for database flow diagram online
Wondershare Edrawmax excels at producing easy and expert database flow diagram online. This robust tool provides a full range of features to quickly build, visualize, and describe database structures.
- The easy drag-and-drop interface of Wondershare EdrawMax enables users to create aesthetically appealing database flow diagrams without the need for significant technical abilities.
- This tool’s most notable features are its ability to collaborate in real-time. A database flow diagram allows several team members to work on it simultaneously, making it an excellent choice for collaborative projects.
- This tool has you covered whether you need to exhibit your database flow diagram in a report.
- It is a user-friendly, cloud-based tool for creating database flow diagrams. This is a great tool for people and teams looking to make clear visually attractive flowcharts.
- This tool runs on Windows, macOS, Android, iOS, Linux and Web Application.
Conclusion
The database flow diagram online plays an important role to ease complicated data exchanges inside systems in the world of data management. These visual representations help teams and stakeholders in understanding, analyzing, and improving data operations. Creating an efficient database flowchart becomes fluid by using standardized symbols as it boosts cooperation and clarity in data management initiatives. Database Flowcharts are helpful, whether creating a new system or simply attempting to understand complicated data flow diagrams.
FAQs
- Who uses data flow diagrams?
Data flow diagrams are used by engineering students, analysts, designers, and developers. They make it simpler to understand and explain complicated processes and data exchanges by helping in the visualization and documentation of the data flow inside a system.
- What are the different DFD levels?
Level 0 means external entities and the system as a single operation and offers an overview. Level 1 divides the system into basic operations. Level 2 subdivides Level 1 tasks, with succeeding levels enabling additional complexity and depth as needed.
- How do you create a data flow diagram?
There is various process to make a Data Flow Diagram. Begin by outlining the system's boundaries and external entities. Create internal protocols, locate data repositories, and visualize data flows. Create a Level 0 to represent high-level interactions, followed by Level 1 DFDs to represent process breakdown.


