


Wondering how a food ordering system gets your favorite meals to you? Behind the user-friendly interface is a dedicated system for smooth order processing. A "Data Flow Diagram for Food Ordering System" is a helpful tool for understanding how it all works. Using this diagram makes designing the system a breeze. It gives a clear picture of how data moves and where it comes from.
In this article
What is a data flow diagram (DFD)?
A Data Flow Diagram (DFD), also known as a data flow diagram, illustrates how data moves through a system. It's a vital tool in system analysis and design, efficiently mapping out information flow. DFDs stand out for their balance of simplicity and thoroughness.
Implementing and optimizing a DFD for an online food ordering system is a breeze due to its clear representation of data processes. They offer a lucid view of processes, stores, sources, and external elements. DFDs serve as a blueprint, providing a structured overview of project data, and aiding designers and software engineers.
Data Flow Diagram Symbols
There are some essential symbols commonly used in DFDs that you should know before going to the levels. A typical DFD (Data Flow Diagram) has four basic components.
- Data Processes: These are represented by rectangles and represent the system's essential tasks, activities, or processes. Processes are responsible for altering, transforming, or creating data as required.
- Data Flows: Data flows, depicted as arrows, depict the complicated channels through which data travels between processes, data storage, or external entities. These directional arrows are quite helpful in tracing the data path throughout the system.
- External Entities: These are depicted as squares or rectangles and represent external components or systems that interact with the system under investigation.
- Information or Data Stores: Those are represented as open-ended rectangles and as a data repository. Databases, files, and even actual papers are examples.
DFD Levels
DFDs are often organized into levels, with each level providing a more thorough perspective of the system. There are three primary tiers of DFDs as well as how they relate to a food ordering system.
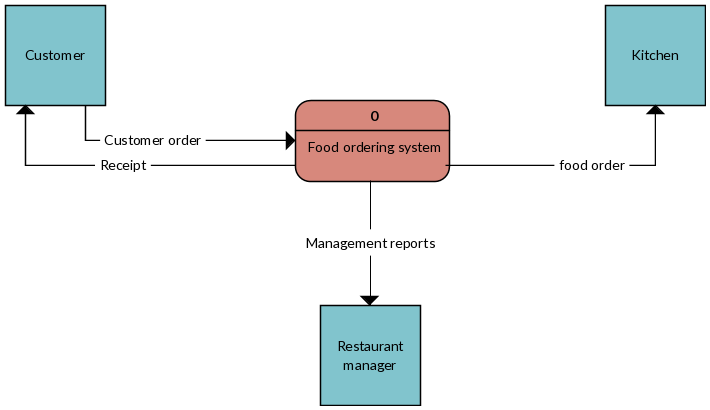
Level 0: Context Diagram
This is also known as Level 0 DFD. It represents the system as a single process wrapped by additional objects. The primary process in the context of a meal ordering system is the system itself, whereas external entities can be customers, restaurants, delivery people, and payment gateways. A bird ' s-eye view of how information enters and exits the system is provided by the data flows between these entities and the system.
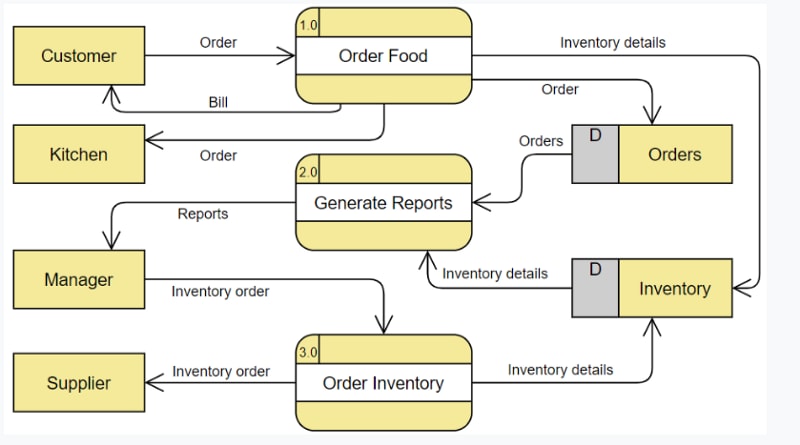
Level 1: Process Decomposition
DFDs at Level 1 are more detailed than context diagrams. They split the primary process into smaller processes or functions, each of which is symbolized by a different process symbol. For instance, Level 1 DFD in a meal ordering system may cover operations like "Order Processing," "Payment Handling," and "Menu Management." Data flow between these operations and external entities is depicted using data flows.
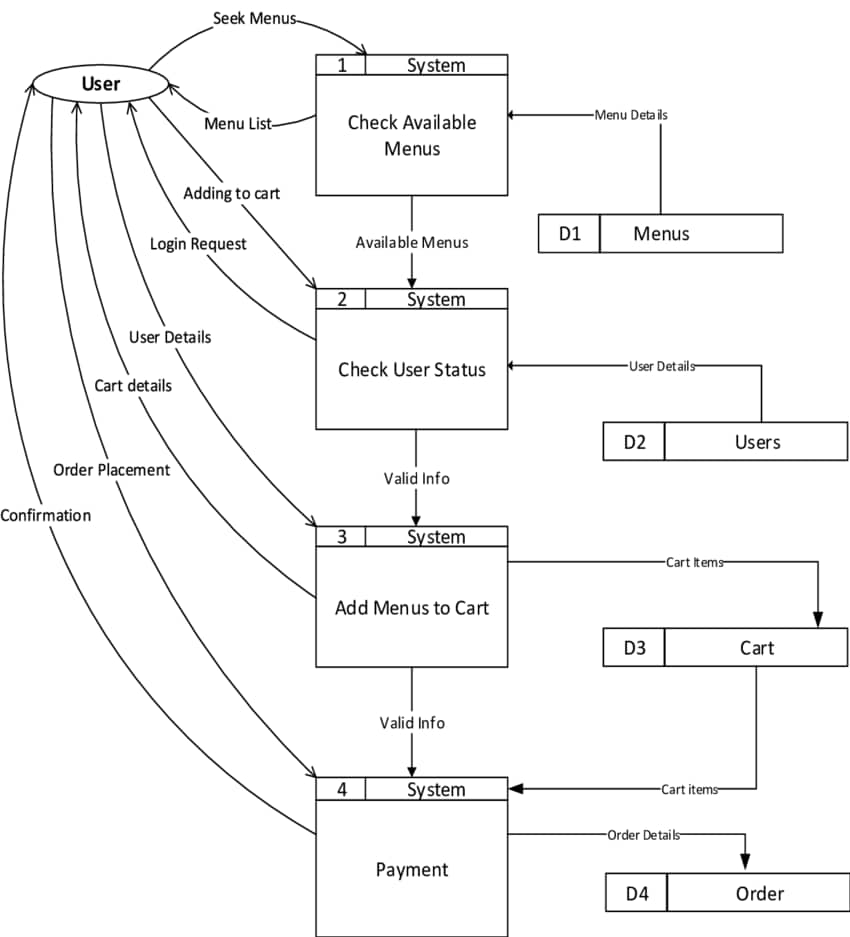
Level 2: Deeper Dives
Food ordering platforms are complex for better understanding we need to go to Level 2 DFD. DFDs at Level 2 provide a more detailed view of individual processes than DFDs at Level 1. Level 1's "Order Processing'' procedure, for example, can be divided into sub-processes like "Order Verification," "Menu Item Selection," and "Payment Authorization." These sub-processes are represented as processes, complete with data flows and data stores.
Bonus Tip: Create DFD using EdrawMax
You can Wondershare EdrawMax to create data flow diagram for online food ordering system as creating data flow diagrams manually can be very time-consuming. This tool provides many advantages for DFD creation.
This tool has an extensive library of pre-built DFD symbols and templates to help you get started quickly. With these tools, you can easily drag and drop symbols onto your canvas, ensuring a visually consistent and organized depiction of your system. Even for complex designs, connecting parts and demonstrating data flow becomes easy.
Here are the steps to create a simple data flow diagram for food ordering system using EdrawMax software:
Step 1: Launch the Wondershare EdrawMax application on your computer.
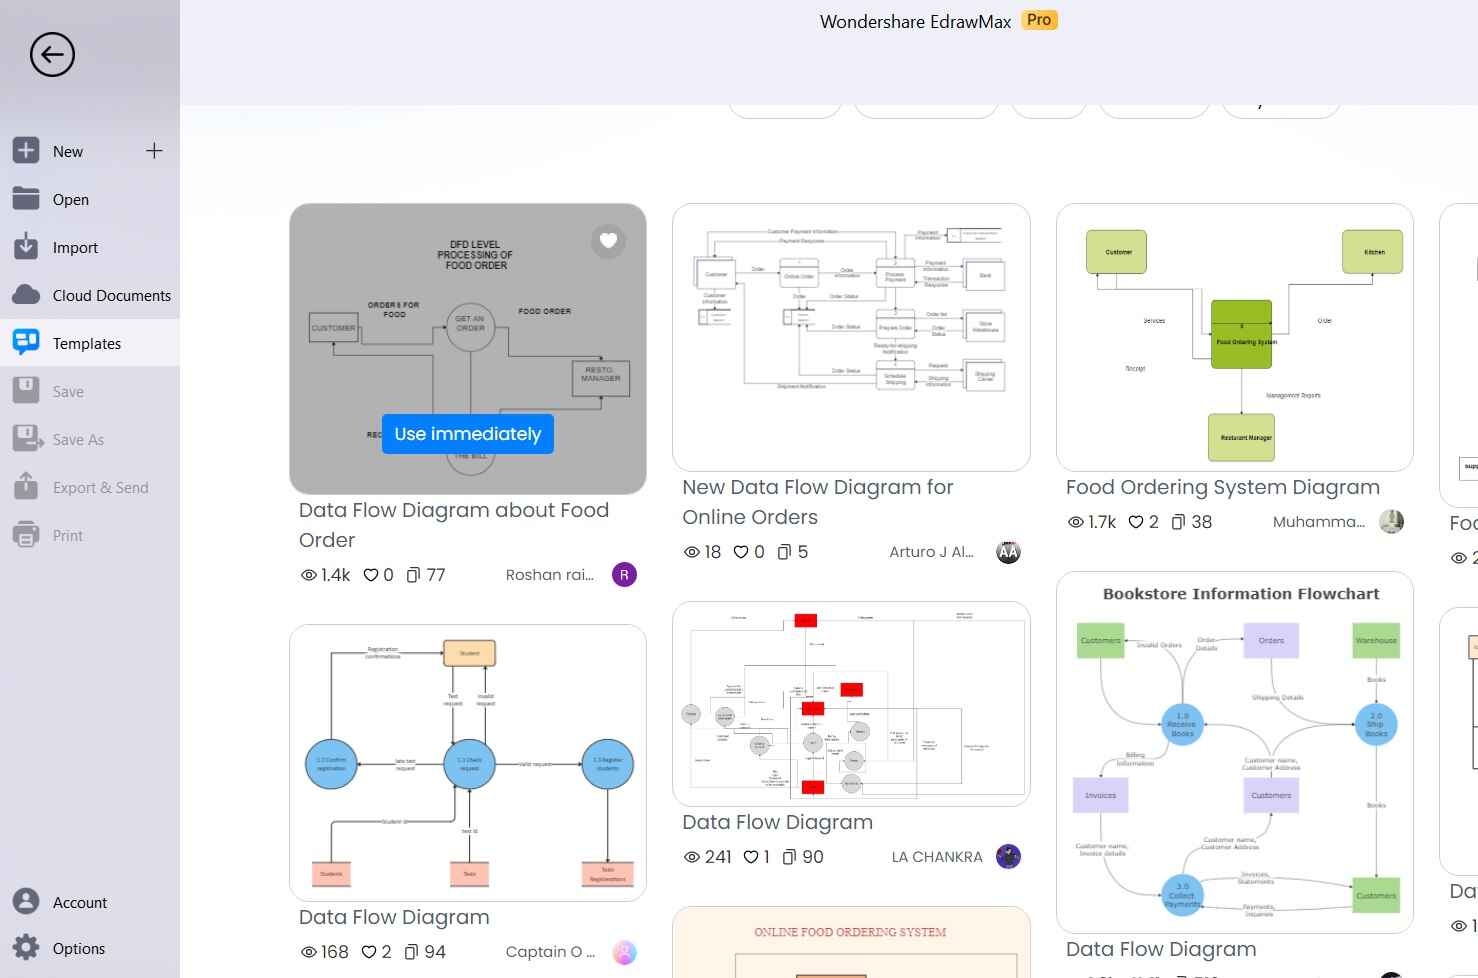
Step 2: In the EdrawMax interface, go to "File" and select "New." Alternatively, you can also choose an appropriate template for a food ordering system to simplify the process. To do so, simply switch to the “Templates” tab from the left menu pane. Type “Data flow diagram for food ordering system” in the search bar and hit Enter.
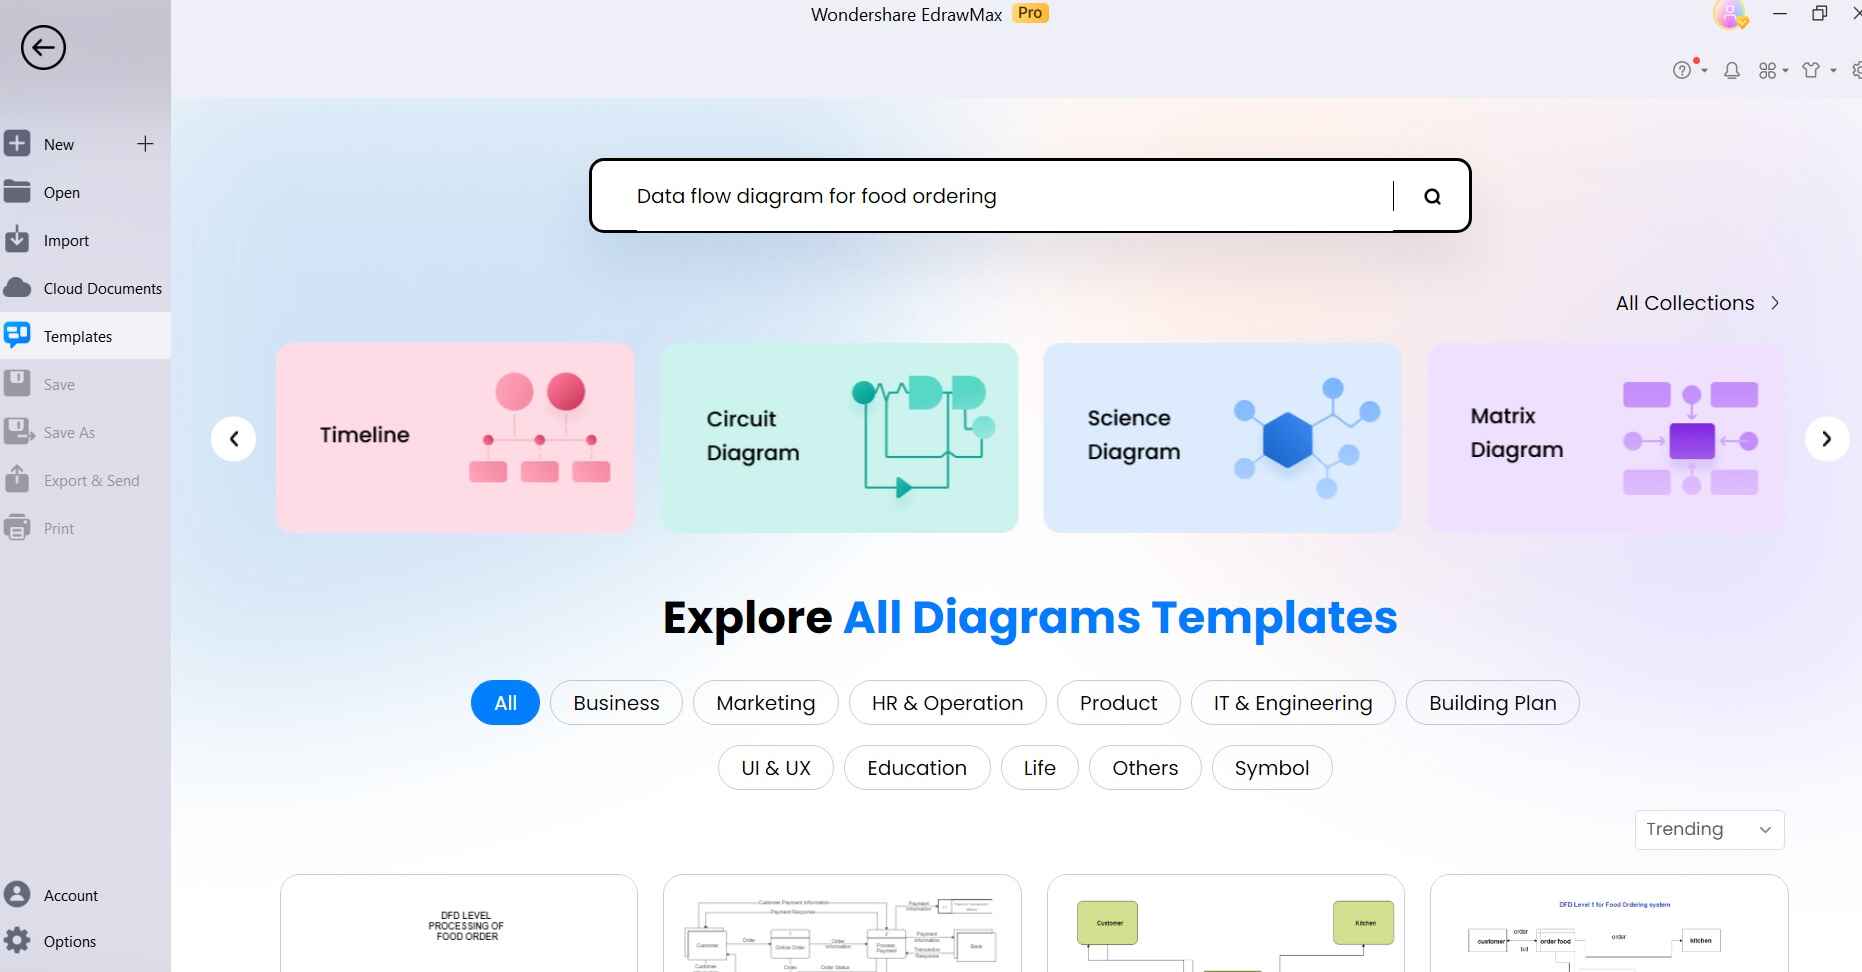
Step 3: Browse through the results and select a Template to get started. Tap on the “Use Immediately” option.
Step 4: You'll now be taken to the canvas in Wondershare EdrawMax. The chosen template is now displayed on the screen.

Step 5: Identify the external entities like "Customer" and "Resto. Manager" involved in the food ordering system. You can also drag and drop the External Entity shapes onto the canvas from the left-hand panel if needed.
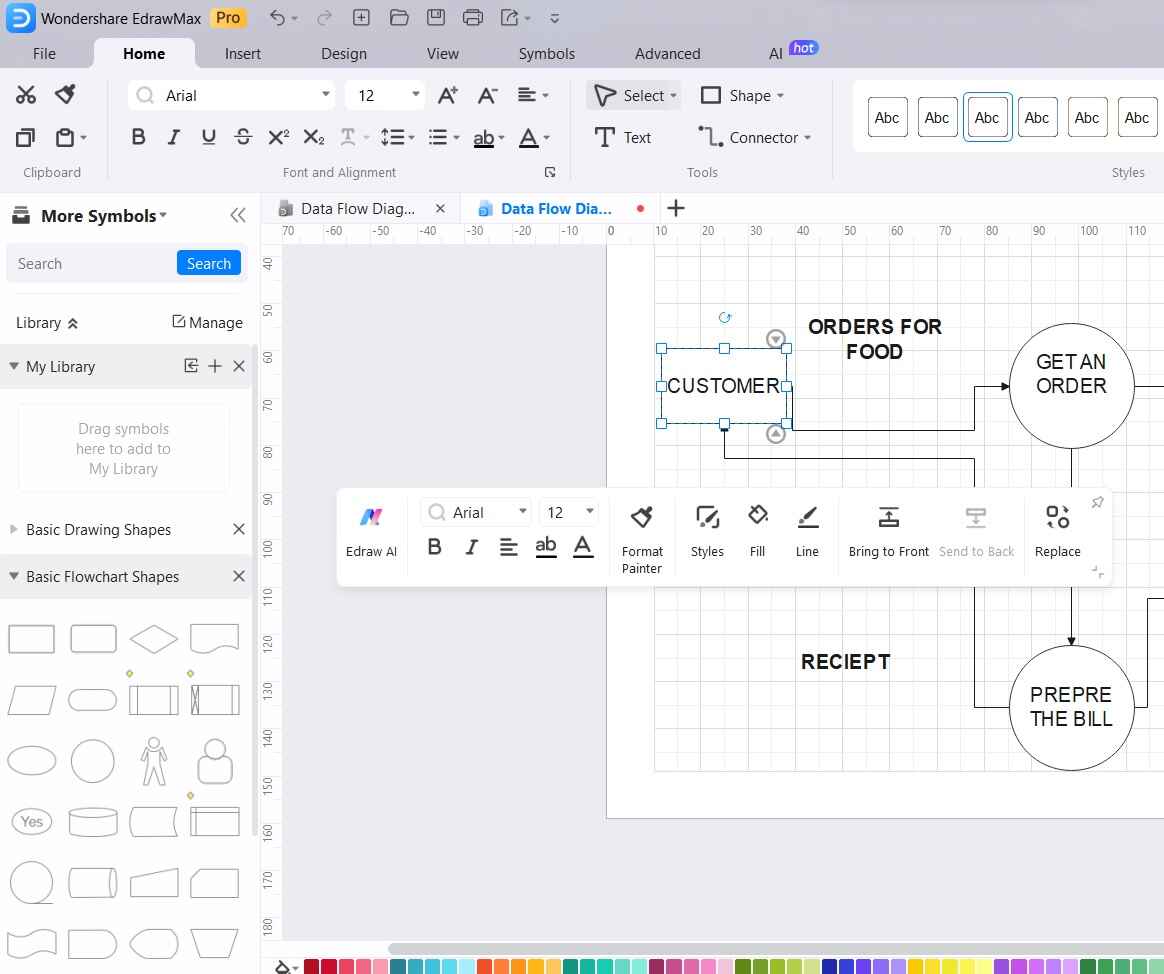
Step 6: Use arrows to connect the External Entities with the Processes to show data flow. Double-check the diagram for accuracy and clarity. Make any necessary adjustments to improve the representation.
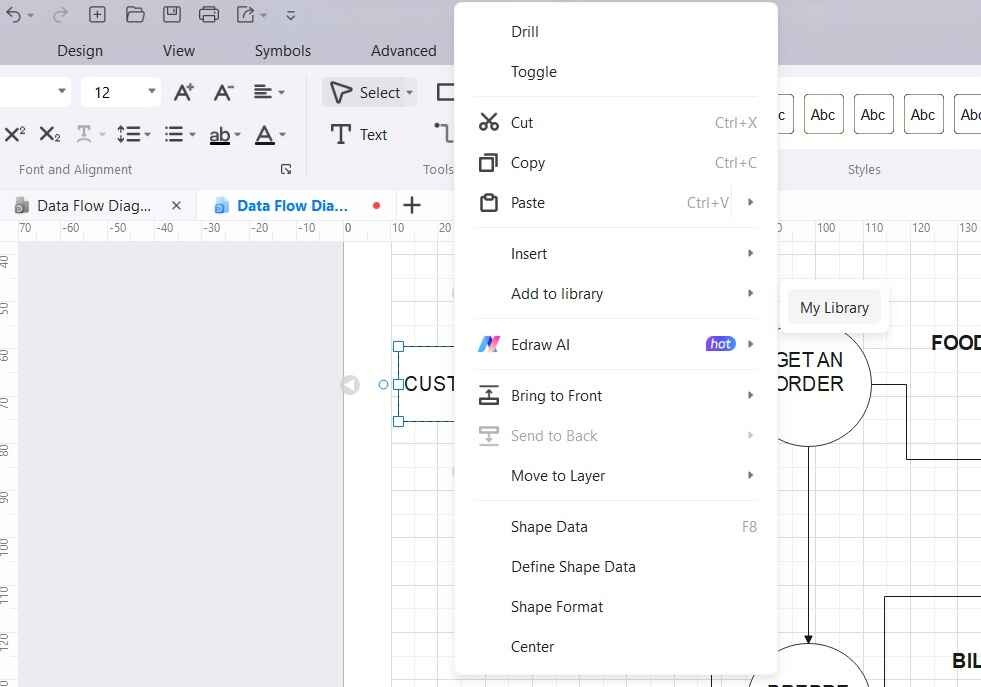
Step 7: To include your symbols in the personalized symbol library, choose the symbol, image, or SVG file on the canvas. Right-click on the selected entity, and select Add to Library> My Library. Alternatively, you can simply drag and drop your favorite symbols to the “My Library” section to perform this action.
Step 8: Once you're satisfied with the DFD, save the file in your desired format. Tap on File> Export and Send.
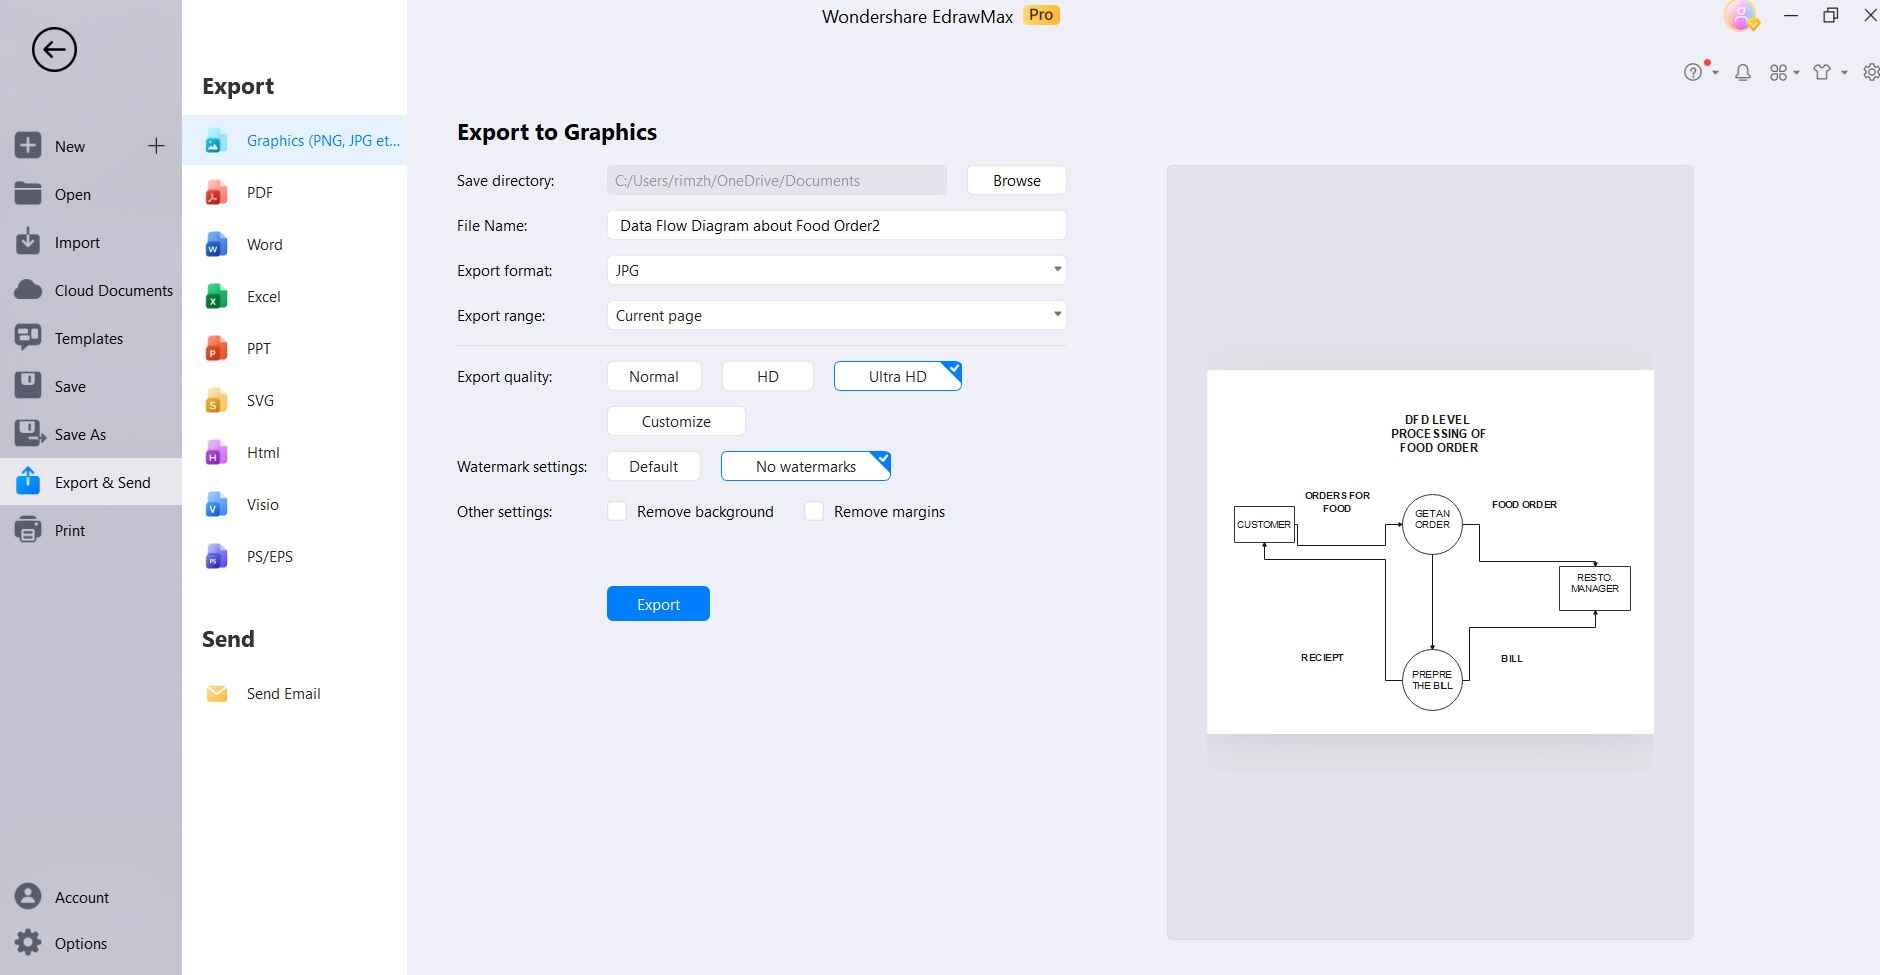
That's it! You've successfully created a Data Flow Diagram for a food ordering system using Wondershare EdrawMax.
Conclusion
An online food business needs a well-organized so a DFD diagram for online food ordering is required. DFDs are commonly used in the design, analysis, and simplification of these systems. DFDs aid in the identification of areas for improvement by breaking down complex processes into simpler components. This leads to better user experiences, lower operating costs, and happier customers. A well-designed meal ordering system can considerably benefit both customers and businesses at a time when efficiency is of the utmost importance.
AI Diagram Generator
Enter your prompt. Upload files if needed. Generate diagrams, charts, or slides instantly.


