


In today's fast-paced digital landscape, presenting complex information in a clear and visually appealing manner is crucial. Enter JavaScript Organizational Charts - a dynamic tool that empowers developers to craft intuitive visual representations of hierarchies and relationships. This comprehensive guide will walk you through the essential concepts, advanced techniques, and best practices for creating stunning Javascript org charts.
Whether you're a seasoned developer or just starting, this resource will equip you with the skills to leverage JavaScript for powerful data visualization.
Contents of this article
Part 1. What Is the IT Department?
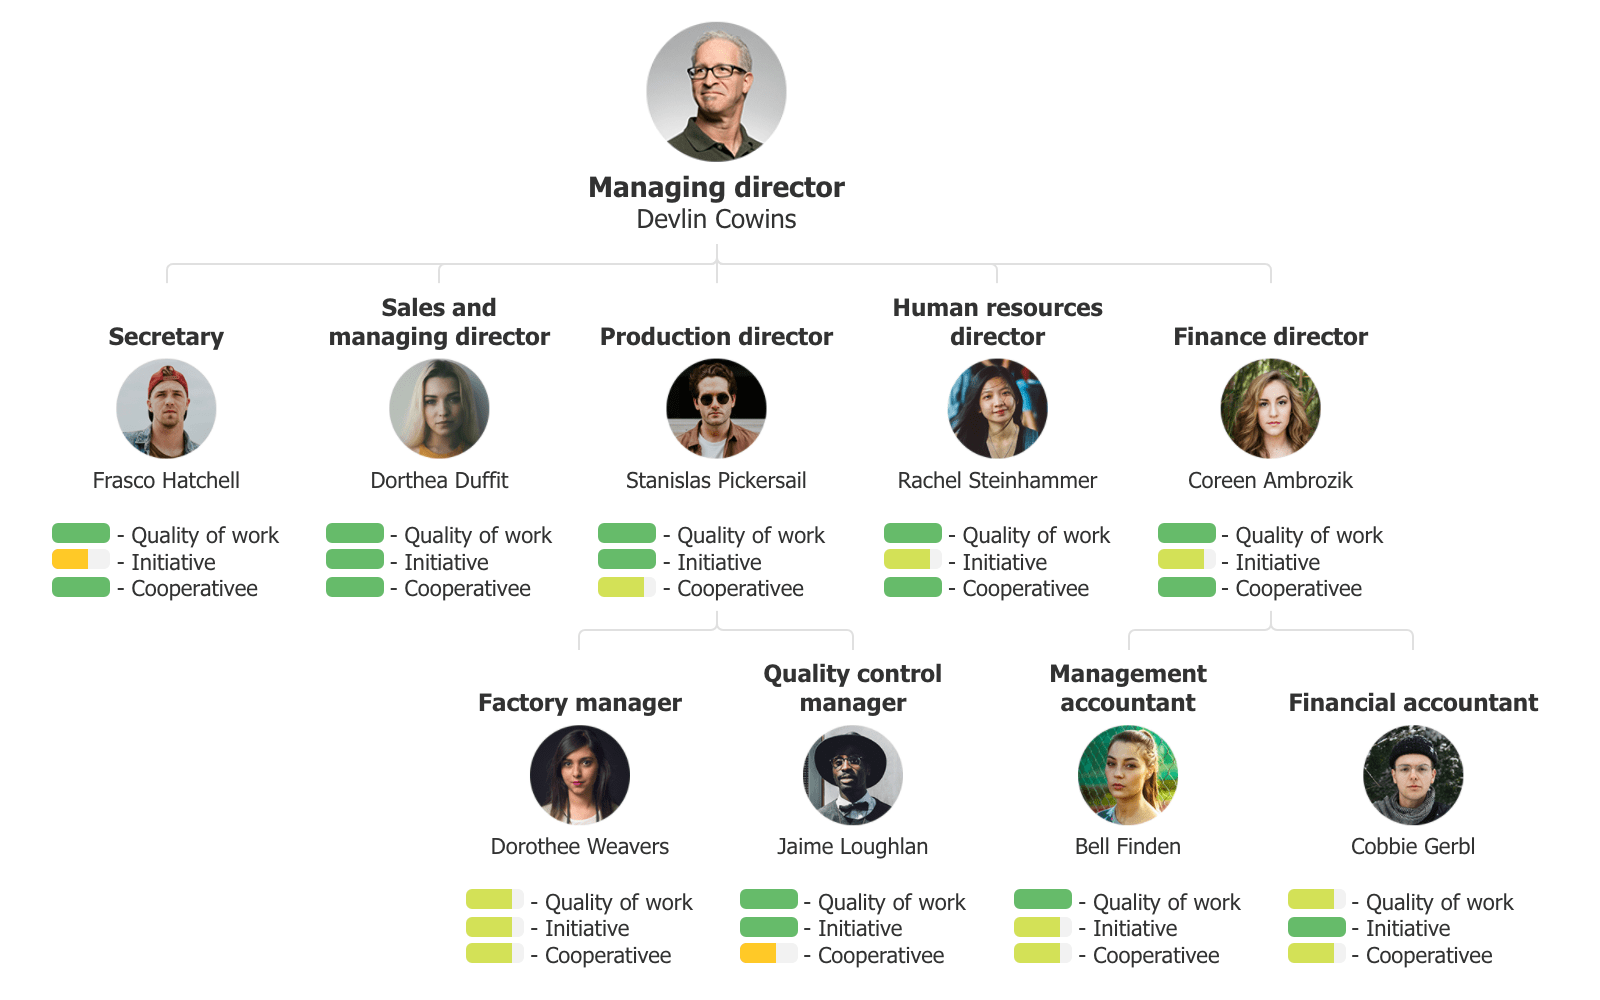
A JavaScript Org Chart is a dynamic visual representation of hierarchical structures, commonly used to display organizational relationships within a company or project. It employs JavaScript, a versatile programming language, to create interactive and customizable charts. Org chart JS showcases levels of authority, reporting relationships, and team members, facilitating a clear understanding of organizational structure.
With the ability to add, remove, and edit nodes in real-time, JavaScript Org Charts serve as invaluable tools for businesses and developers seeking to convey complex hierarchies intuitively and engagingly.
Part 2. Characteristics of a Javascript Org Chart:
Let's explore some of the defining features of JavaScript Org Charts.
- Dynamic Interactivity: JavaScript Org Charts allow real-time interaction, enabling users to add, remove, and modify nodes on the fly.
- Customizability: They offer extensive options for visual customization, including color schemes, shapes, and styles, ensuring charts align with specific design preferences.
- Scalability: These charts can handle large datasets and complex hierarchies, maintaining performance and clarity even with expansive organizational structures.
- Cross-browser Compatibility: Organization chart JS are designed to function seamlessly across various web browsers, ensuring a consistent user experience for all audiences.
- Accessibility: They can be optimized for accessibility, accommodating users with disabilities by providing alternative navigation options and screen reader support.
Part 3. Who Can Benefit From Org Charts?
Understanding who benefits from organizational charts is crucial for optimizing communication and efficiency within any company. These visual representations of hierarchies serve as invaluable tools for various stakeholders, providing clarity and structure in navigating the organization.
#1 Project Managers
- Enables clear delegation of tasks and responsibilities within the team.
- Provides a visual overview of project structure for better planning and execution.
# Employees
- Offers a transparent view of reporting relationships and team members' roles.
- Helps employees understand their position in the organization and who to approach for specific tasks or concerns.
#3 Executives and Senior Leaders
- Facilitates strategic decision-making by visualizing the organizational hierarchy.
- Aids in identifying gaps or redundancies in leadership positions for efficient resource allocation.
#4 Legal and Compliance
- Ensures adherence to regulatory requirements by visualizing reporting lines and responsibilities.
- Provides a basis for assessing accountability and compliance with internal policies.
#5 Investors and Stakeholders
- Offers a clear understanding of the organizational structure and key decision-makers.
- Enables investors to evaluate the company's leadership and reporting framework for investment decisions.
Part 4. Benefits of Using Org Charts
Here are the top 5 benefits of using Javascript organizational charts:
- Clear Roles and Responsibilities: Org charts show who does what in a company. This helps everyone know their job and who they report to.
- Improved Communication: These tools facilitate clear identification of the appropriate individuals to consult for specific matters, eliminating any uncertainty regarding authority.
- Enhanced Team Understanding: They enable individuals to grasp their role within the broader framework of the team, providing a clear sense of their position.
- Spotting Gaps and Overlaps: You can see if there are too many people doing the same job or if some areas need more help.
- Planning and Decision-making: Leaders can use org charts to plan projects and make important decisions. They can see who has the right skills for each task.
Part 5. Creating An Interactive Organizational Chart
Using Wondershare EdrawMax for creating an interactive organizational chart is paramount for streamlining communication and enhancing efficiency within a company. Its intuitive interface and robust features empower users to effortlessly design, customize, and update org charts in real time.
With EdrawMax's interactive capabilities, stakeholders can easily navigate through the hierarchy, gaining a clear understanding of roles and responsibilities. This dynamic tool not only saves time but also ensures that the chart remains current, reflecting any organizational changes promptly.
Additionally, EdrawMax offers a range of visualization options, making complex structures easily comprehensible, ultimately leading to improved decision-making and a more productive work environment.
Here are the steps to create an interactive organizational chart using EdrawMax:
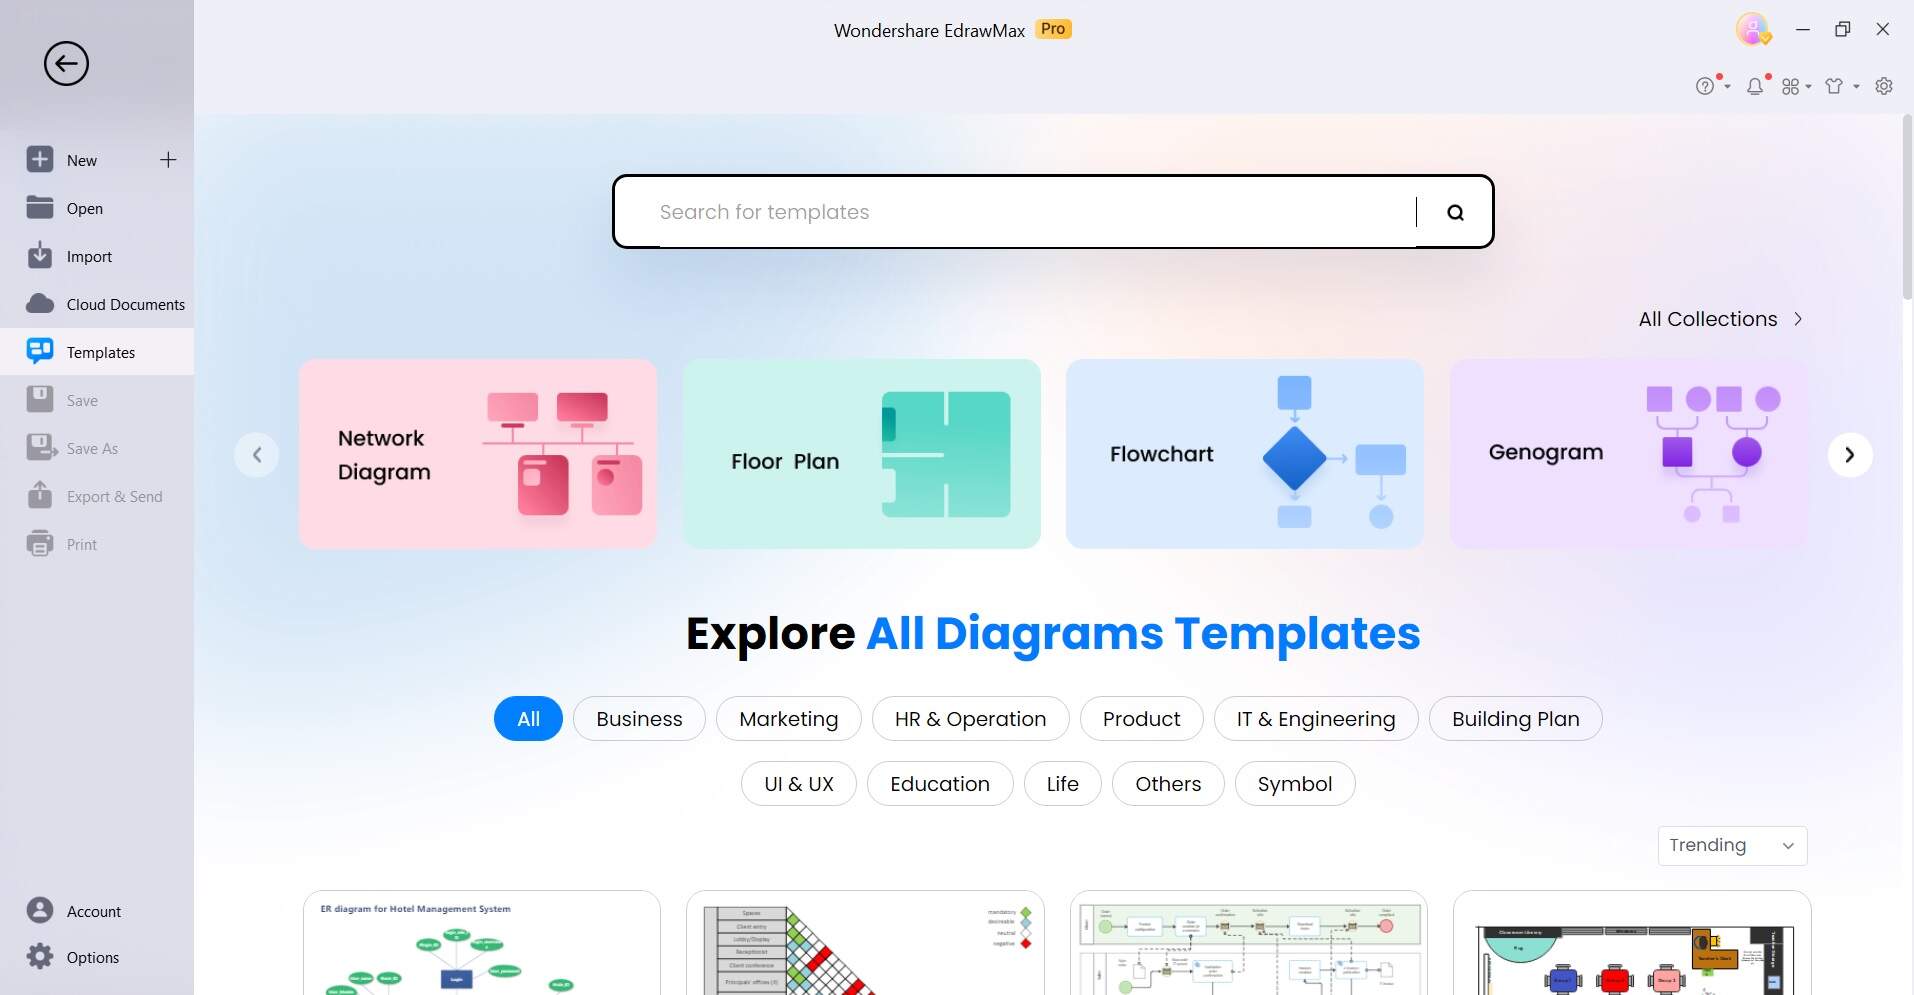
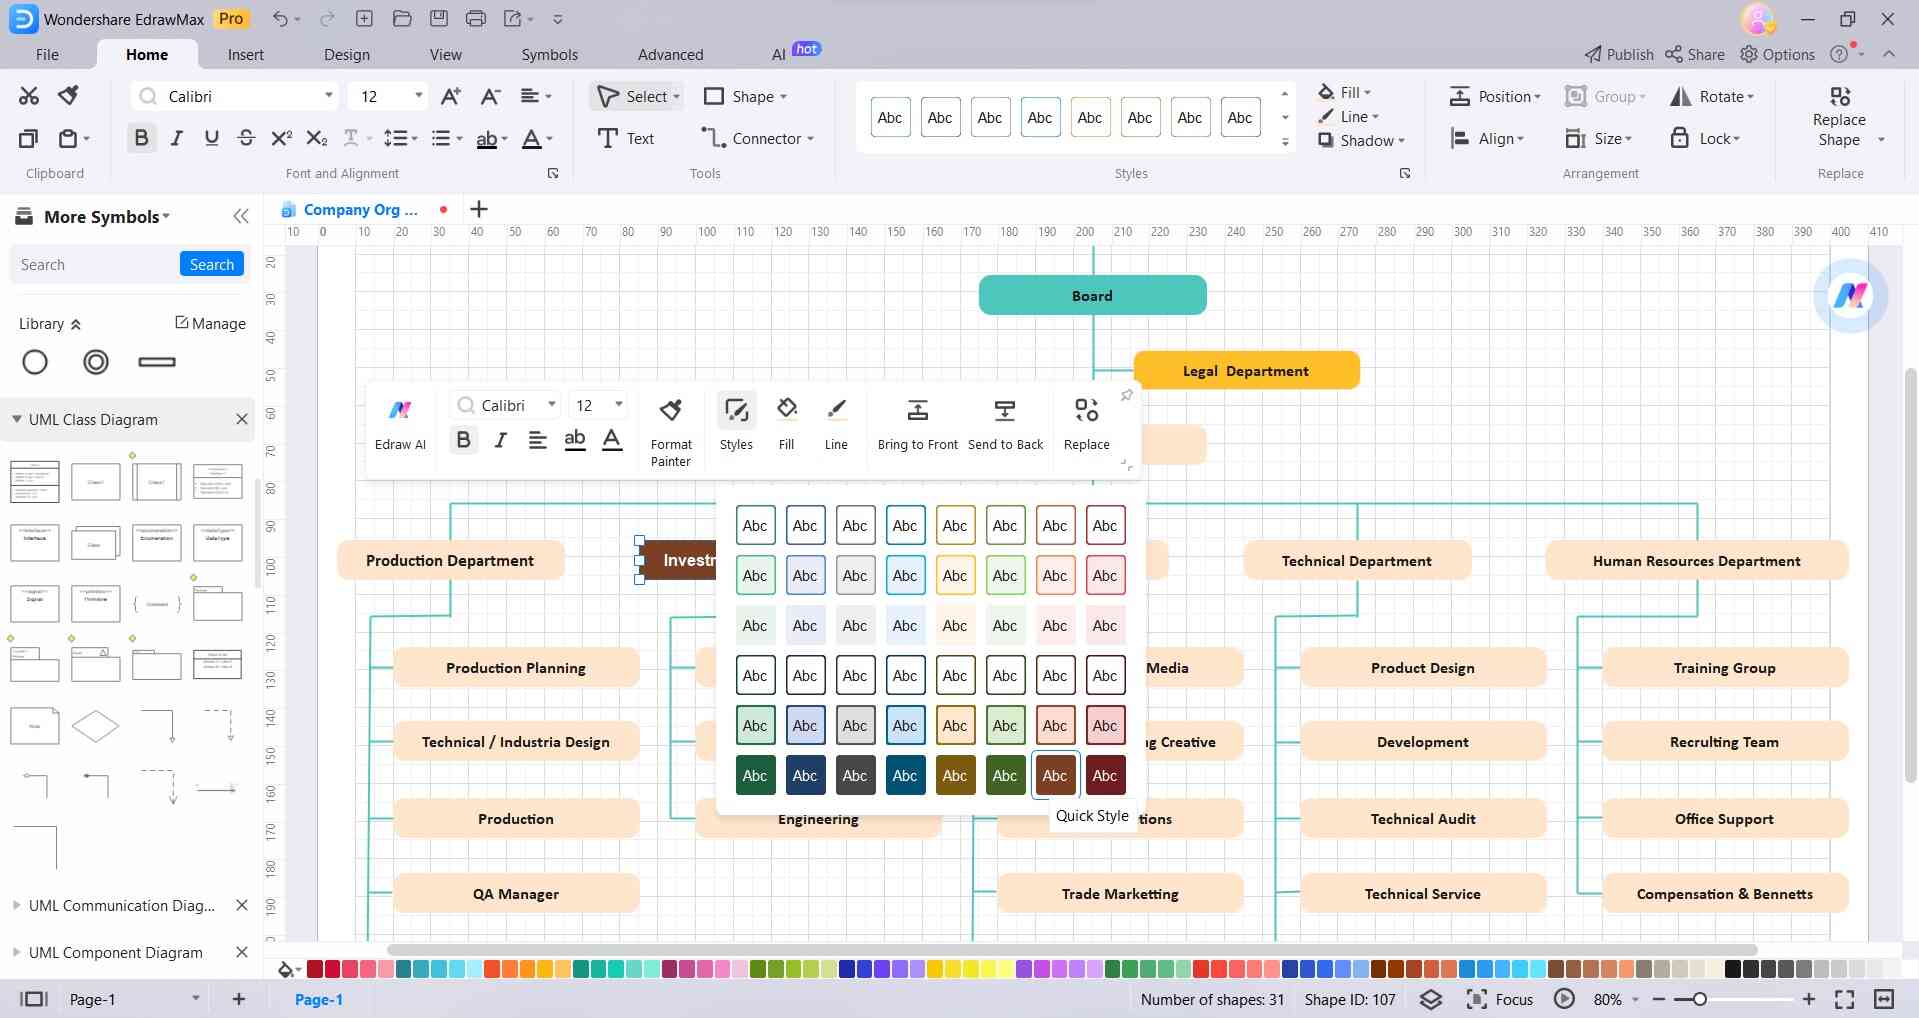
Step 1: First, launch EdrawMax on your computer. Switch to the “Templates” section from the left menu pane and select the "Organizational Chart" template.
Step 2: Drag and drop shapes to represent positions and connect them using lines or arrows to denote reporting relationships.
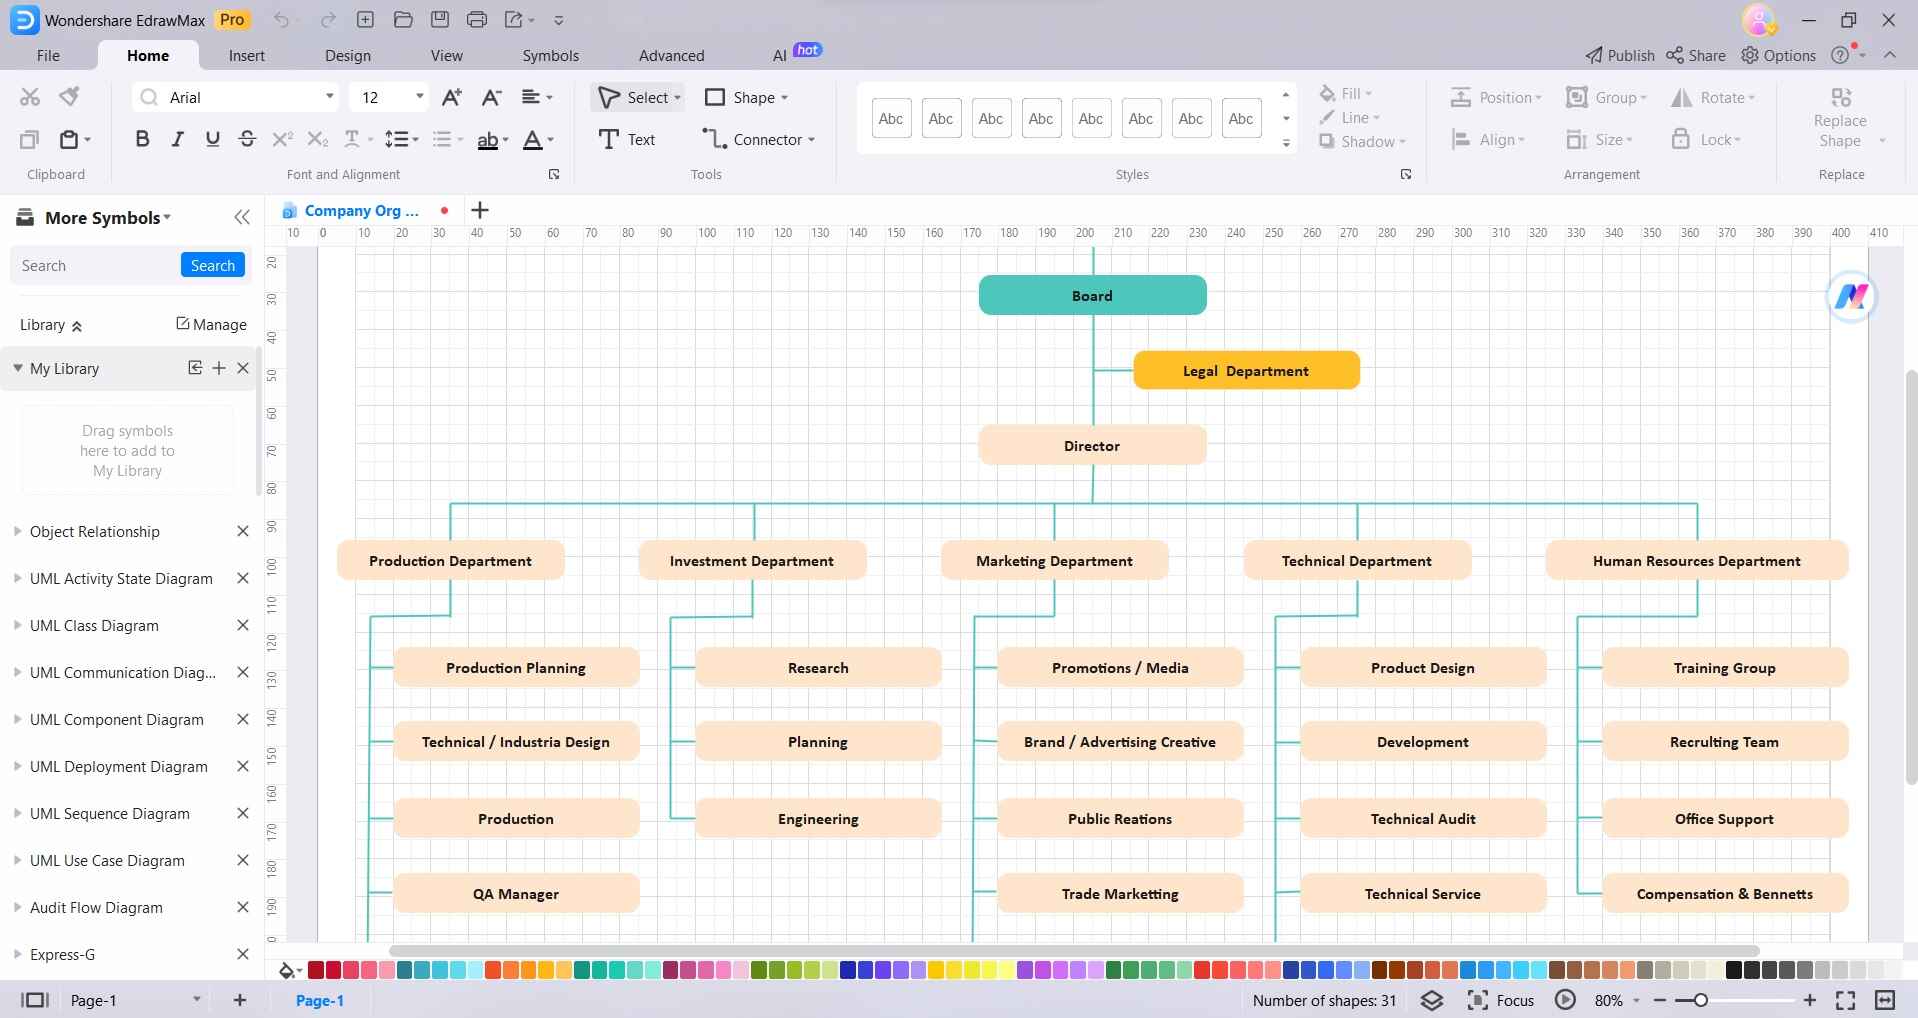
Step 3: Double-click on each shape to add names, titles, and other relevant information.
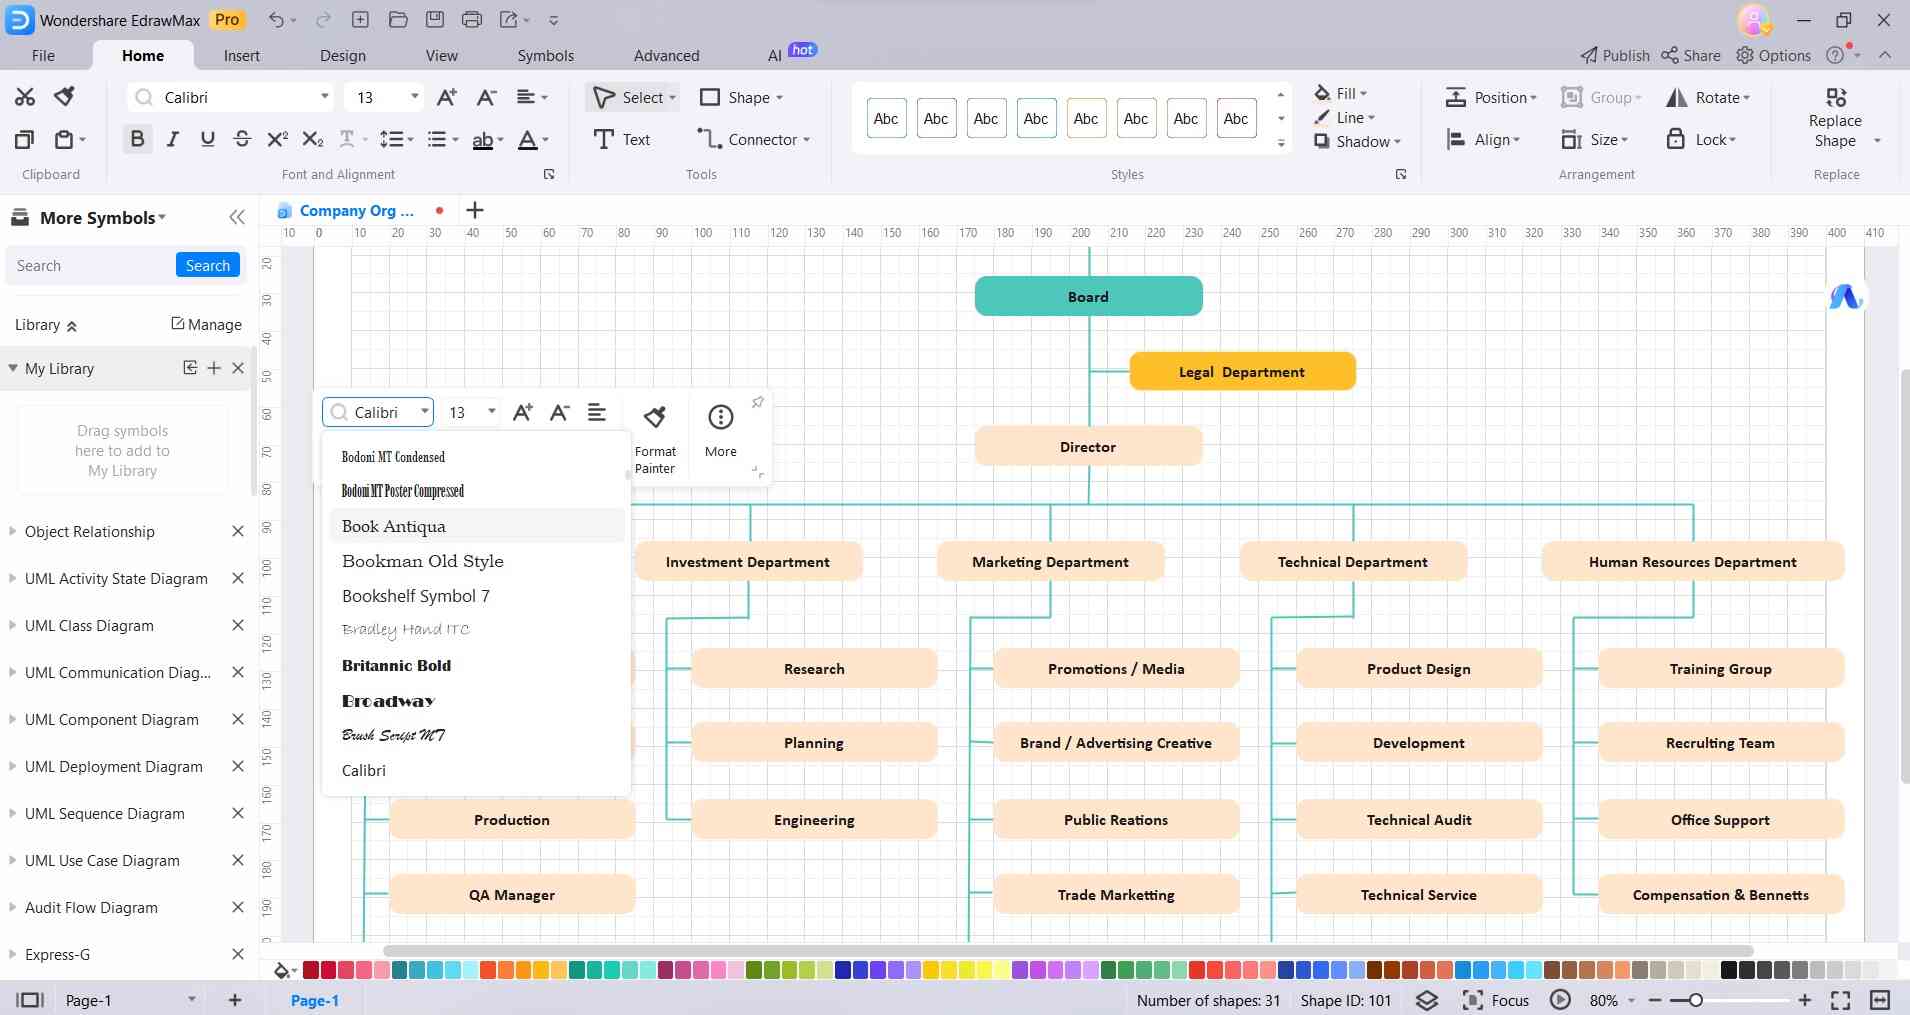
Step 4: Customize the chart's appearance by choosing from various styles, colors, and fonts. EdrawMax also allows for easy rearrangement of positions and levels for a clear hierarchy.
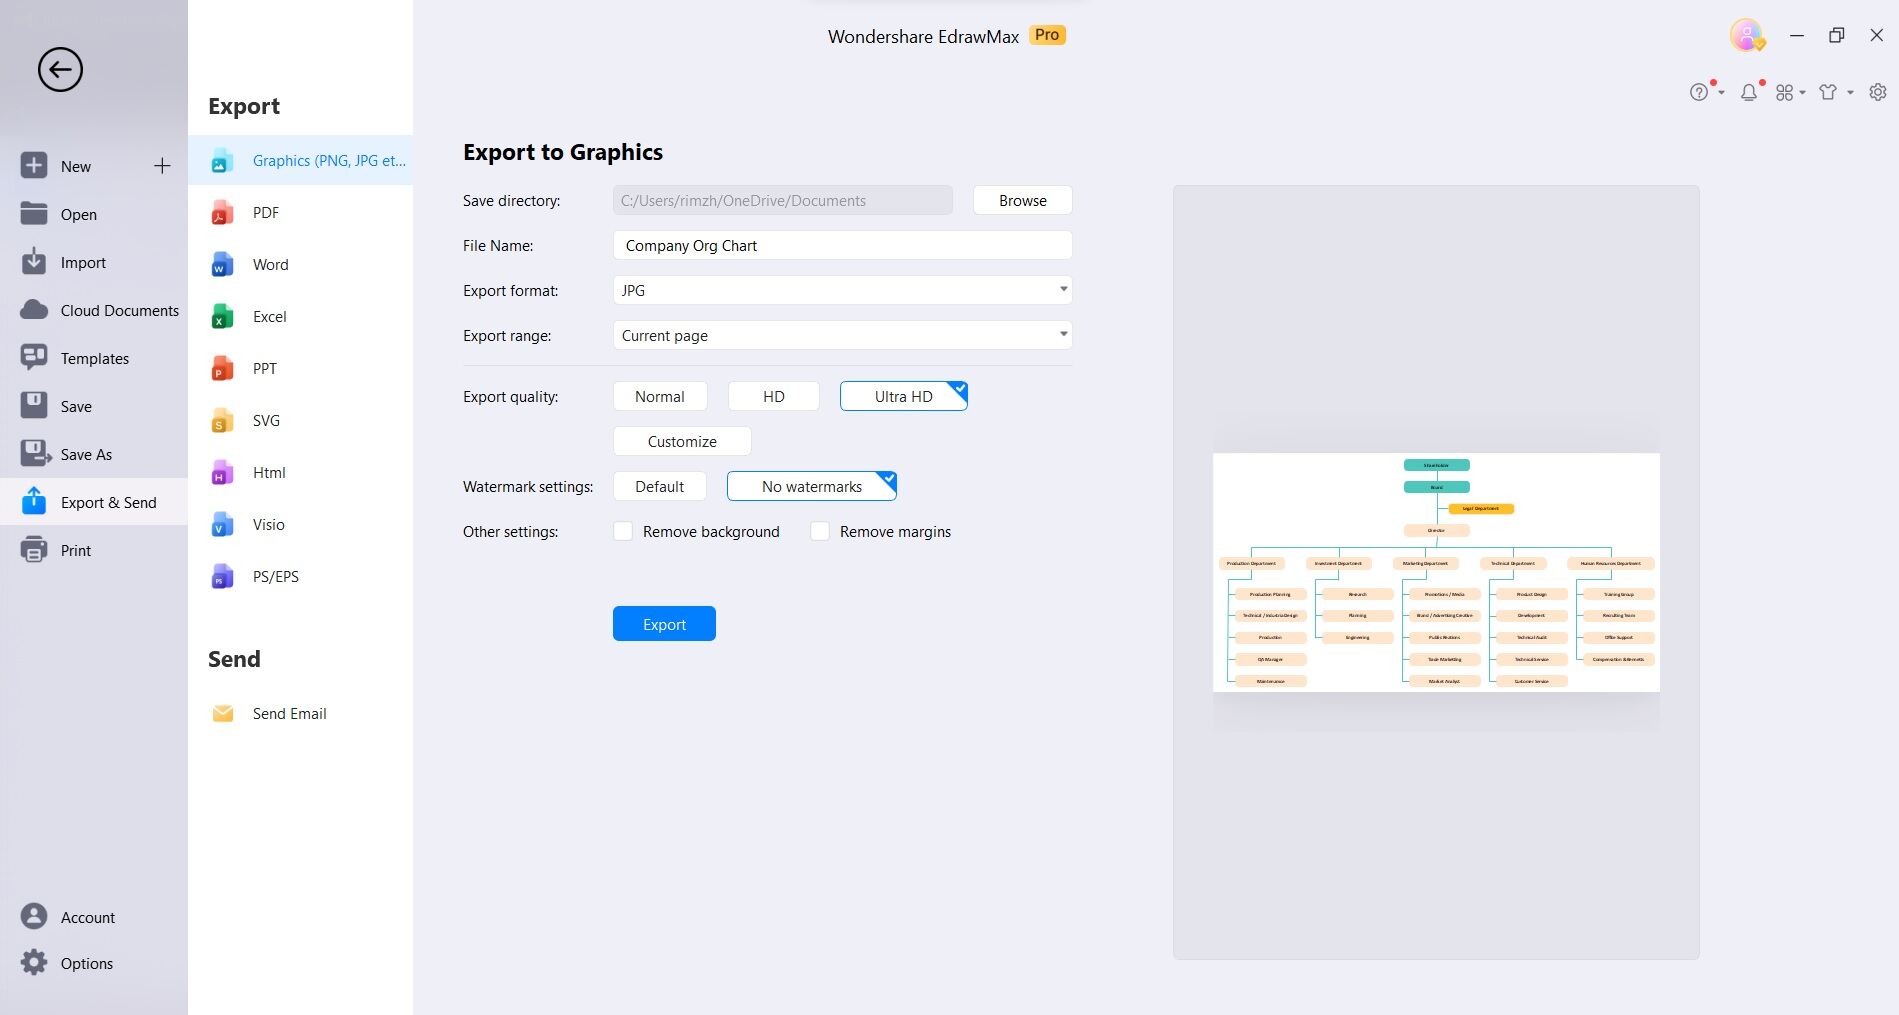
Step 5: Finally, navigate to File> Save to save the chart in your preferred format or directly export it to share with your team, ensuring seamless communication and understanding of organizational structure.
And that’s it! Here is how you can easily craft an interactive organizational chart using EdrawMax.
Conclusion
In conclusion, organizational charts serve as indispensable tools in modern businesses, promoting clarity, communication, and efficiency. Whether for project managers, employees, executives, legal compliance, or stakeholders, they offer invaluable insights into the structure of an organization. EdrawMax further elevates this process with its user-friendly interface and interactive features.
By streamlining chart creation and customization, it empowers users to effectively represent complex hierarchies. Embracing such technology not only facilitates better decision-making but also fosters a more cohesive and productive work environment, ultimately contributing to the overall success of the organization.
AI Diagram Generator
Enter your prompt. Upload files if needed. Generate diagrams, charts, or slides instantly.


