Welcome to our step-by-step guide on creating and managing Office 365 org charts with ease. Whether you're a small business owner or a team leader in a large organization, org charts can be a powerful tool for visualizing your team's structure and fostering collaboration. In this guide, we will walk you through the process of creating and managing Office 365 organization charts, highlighting the benefits, challenges, and limitations of the default offerings.
Get ready to unlock efficiency and collaboration as we harness the power of organizational charts in Office 365 org charts.
Contents of this article
Part 1. What is an Organizational Chart
An organizational chart visually depicts the structure and hierarchy of a company. It illustrates the connections between various departments, teams, and individuals within the organization. This chart presents positions, job titles, and reporting relationships, providing clarity on reporting lines. Organizational charts serve to define roles, improve communication, and promote teamwork within the company. They are an essential tool for gaining insights into an organization's setup and operations.
Part 2. Components of an Office 365 Organization Chart
An Office 365 organization chart typically comprises key components such as users, groups, roles, licenses, and resources.
- Users: These are the individuals who make up the workforce within the Office 365 organization. They are assigned specific roles and licenses based on their responsibilities and needs.
- Groups: Essential for seamless collaboration, groups allow members to share resources and communicate effectively. They serve as a collective workspace, promoting efficiency and teamwork within the organization.
- Roles: These define the specific permissions and access levels granted to users, ensuring that they have the appropriate level of authority to perform their tasks and responsibilities.
- Licenses: Governing access to Office 365 services and applications, licenses regulate which tools and features users can utilize. They are essential for ensuring compliance and optimizing resource allocation.
- Resources: These encompass shared assets such as calendars, meeting rooms, and equipment. They can be reserved or utilized collectively by the organization, streamlining resource management and enhancing productivity.
Part 3. Different Ways to Create Office 365 Organization Chart
You can create an Office 365 org chart using various applications within the Office 365 suite. Here are several essential choices:
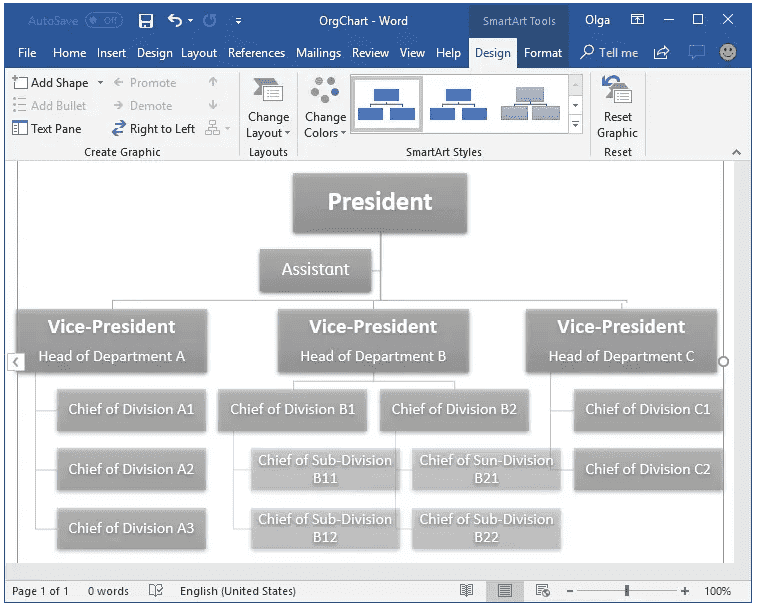
1. Microsoft Word:
- Use SmartArt: Insert a SmartArt graphic and choose the "Hierarchy" category to create a Microsoft 365 organizational chart.
2. Microsoft PowerPoint:
- Similar to Word, PowerPoint offers the SmartArt feature for creating organization charts.
3. Microsoft Visio:
- Visio specializes in diagramming and includes a range of templates for creating detailed and customized Office 365 organization charts.
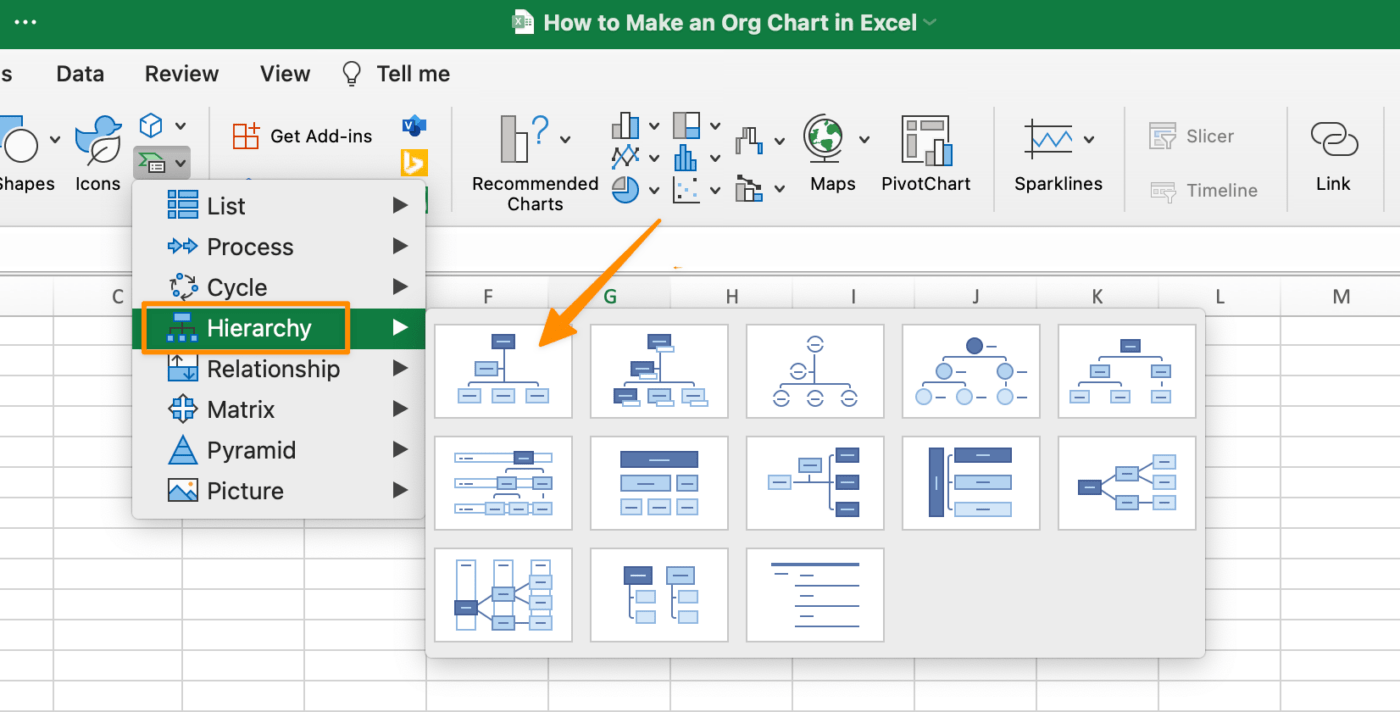
4. Microsoft Excel:
- Excel can be used to create basic organizational charts using shapes and connectors, though it's not as robust as other options.
5. Microsoft SharePoint:
- SharePoint allows for the creation of organizational charts, particularly for visualizing the structure of teams and departments.
6. Microsoft Teams:
- Teams can display a basic Office 365 organizational chart, showcasing the members of a team or channel.
These applications offer various levels of customization and complexity for creating organization charts, allowing you to choose the one that best suits your needs and preferences.
Part4. Crafting an Organization Chart Easily with EdrawMax
Wondershare EdrawMax stands out as an excellent tool for creating organizational charts due to its advanced features and user-friendly interface. Unlike some of the basic options available within the Office 365 suite, EdrawMax offers a wider range of customization options. It provides a vast library of pre-made templates, shapes, and symbols, allowing users to design highly detailed and visually appealing organizational charts.
Moreover, EdrawMax supports seamless integration with other Microsoft Office applications, ensuring compatibility and ease of use for those already accustomed to the Office 365 environment. Furthermore, EdrawMax excels in its ability to handle complex organizational structures. It offers functionalities for matrix structures, cross-functional teams, and multi-level hierarchies, which may be more challenging to execute in applications like Word or PowerPoint.
Here are the steps to create an organizational chart using EdrawMax:
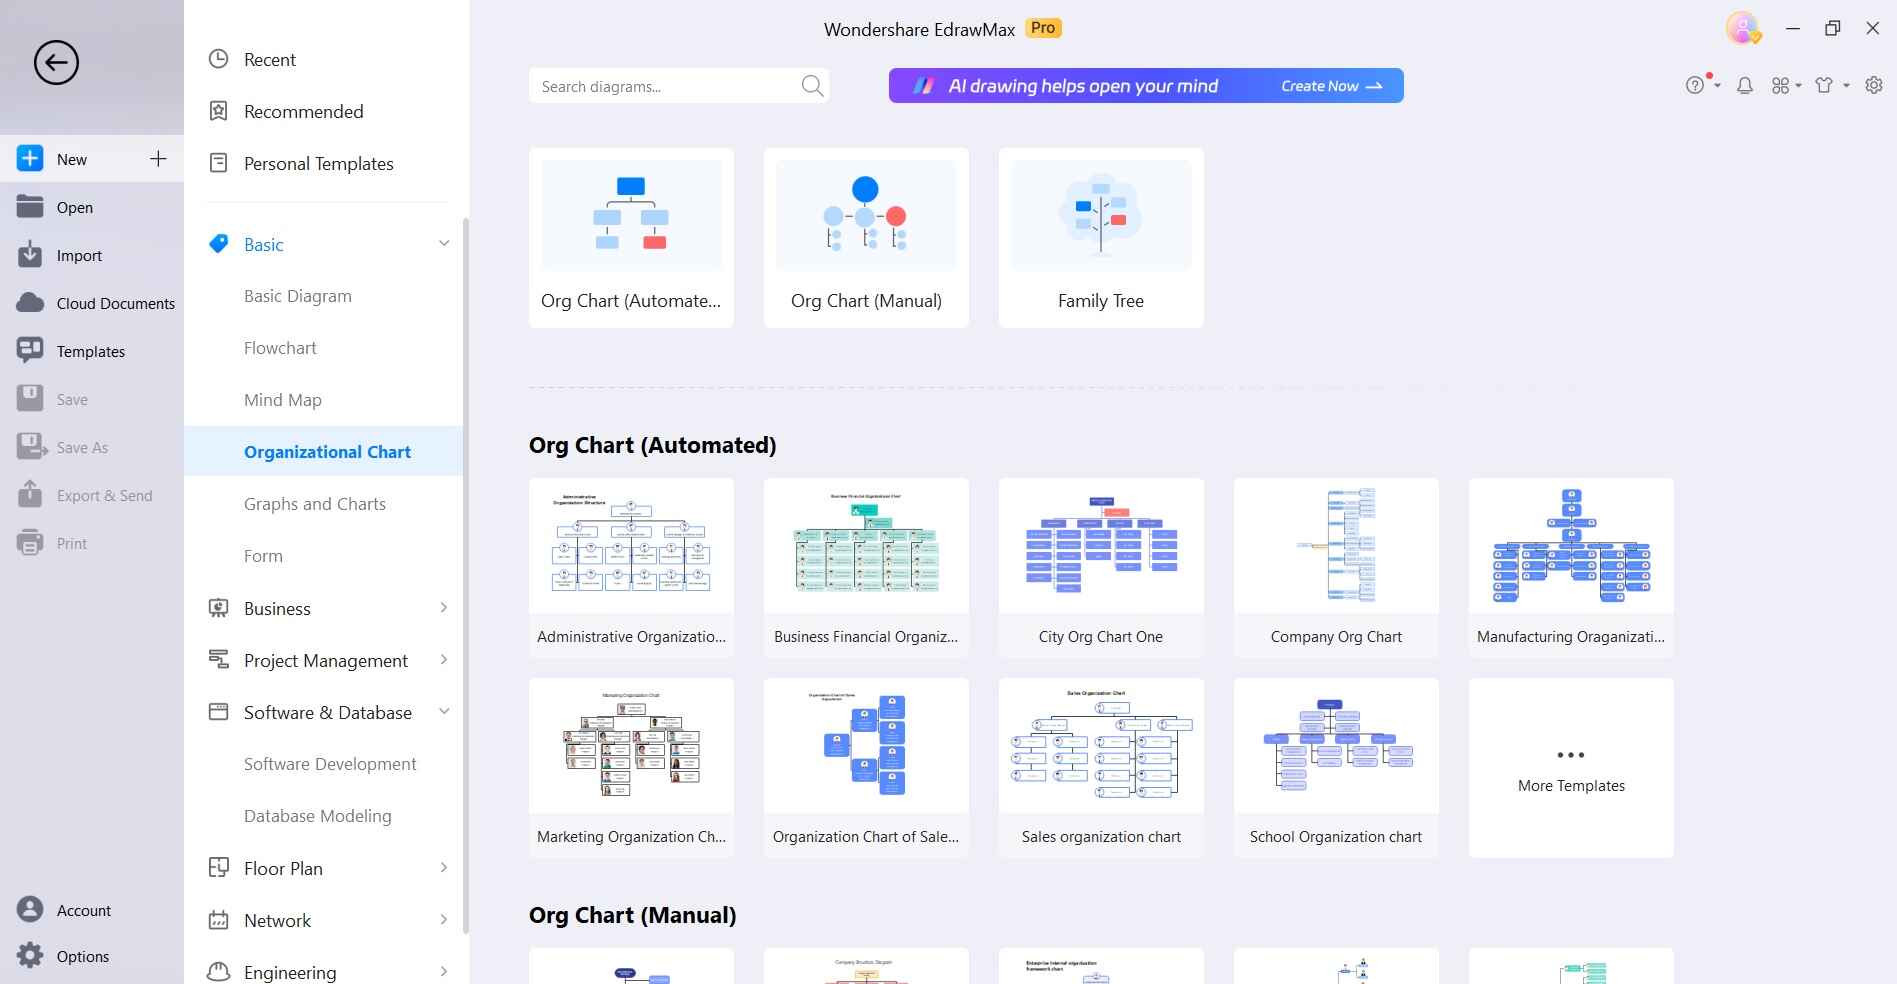
Step 1: Open the EdrawMax application on your computer. Click on "File" in the top left corner, then select "New" and choose "Organizational Chart" from the template categories.
Step 2: Now, Drag and drop the desired shapes from the left sidebar onto the canvas. These represent the positions or roles in your organization.
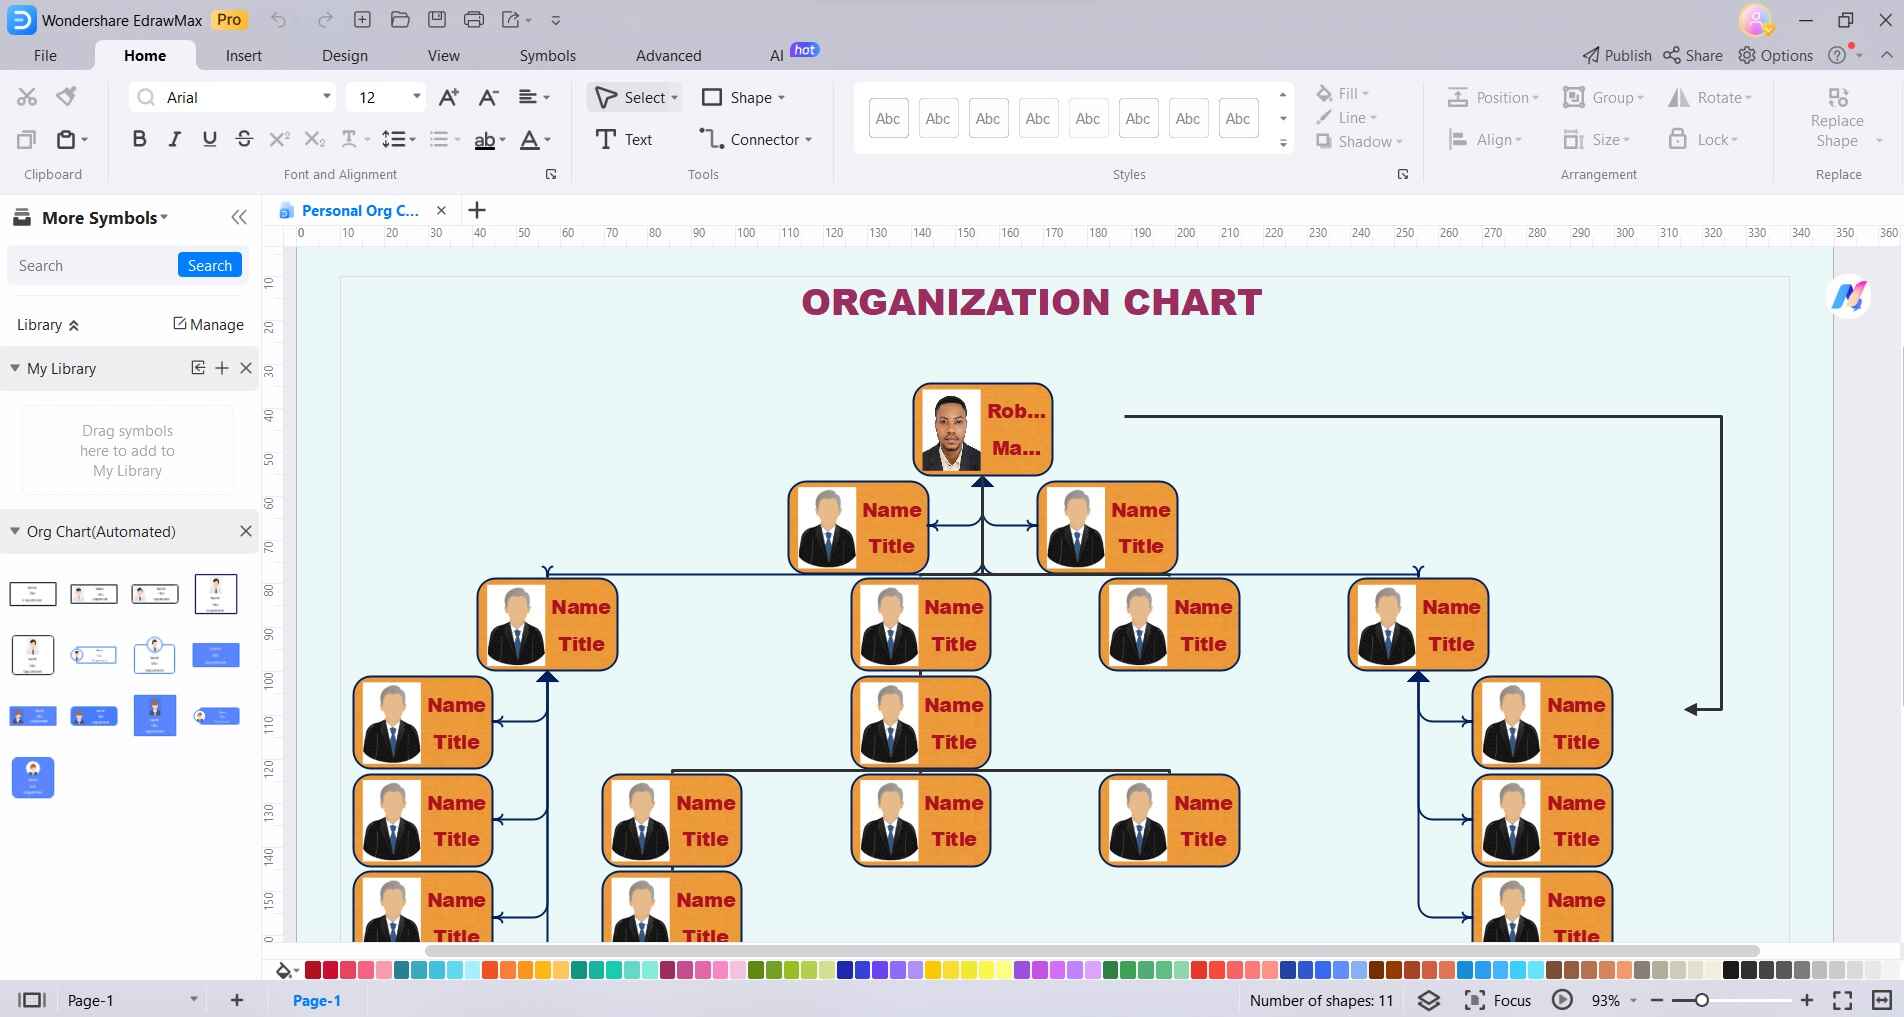
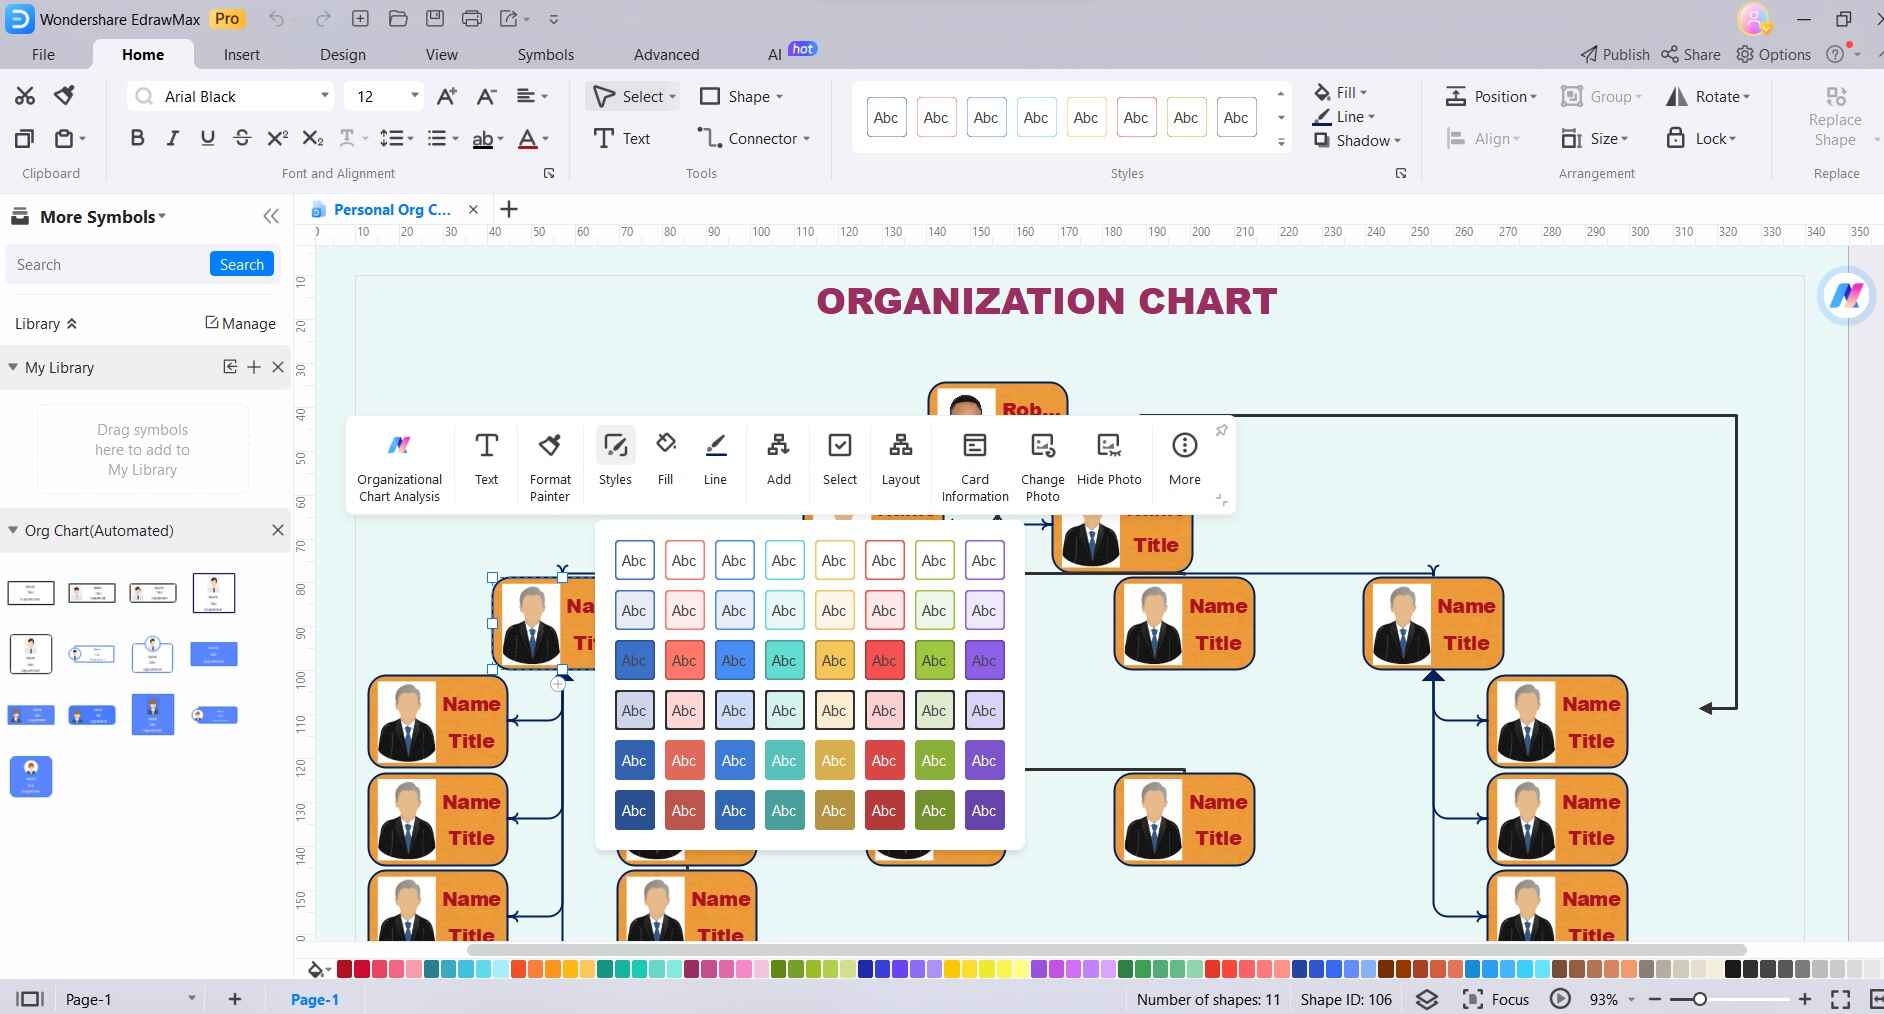
Step 3: Double-click on a shape to enter text and add the name or title of each position. Use the formatting options to change font, color, size, etc. Adjust the size of the shapes to fit the text.
Step 4: Click on the shape you want to connect to another, then drag the arrow icon to the target shape. This establishes reporting relationships.
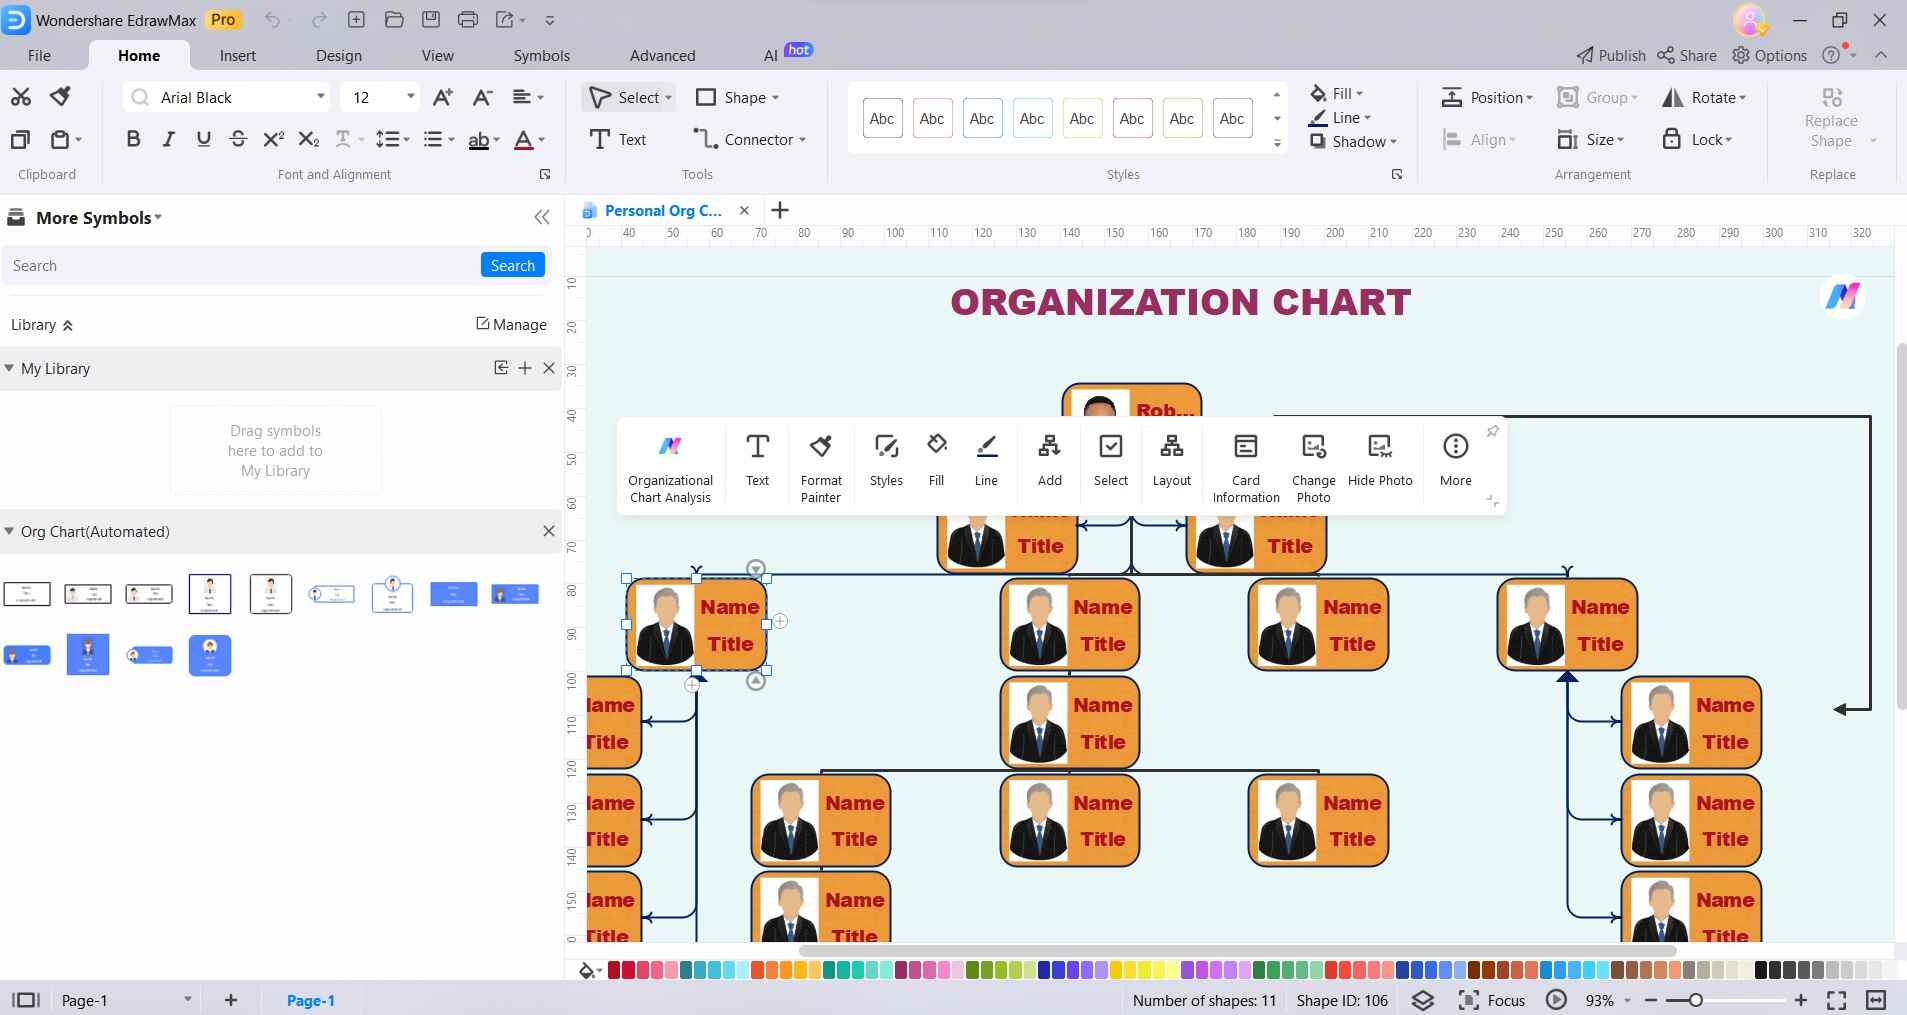
Step 5: Use the alignment and spacing tools to fine-tune the layout of your organizational chart. This ensures clarity and neatness.
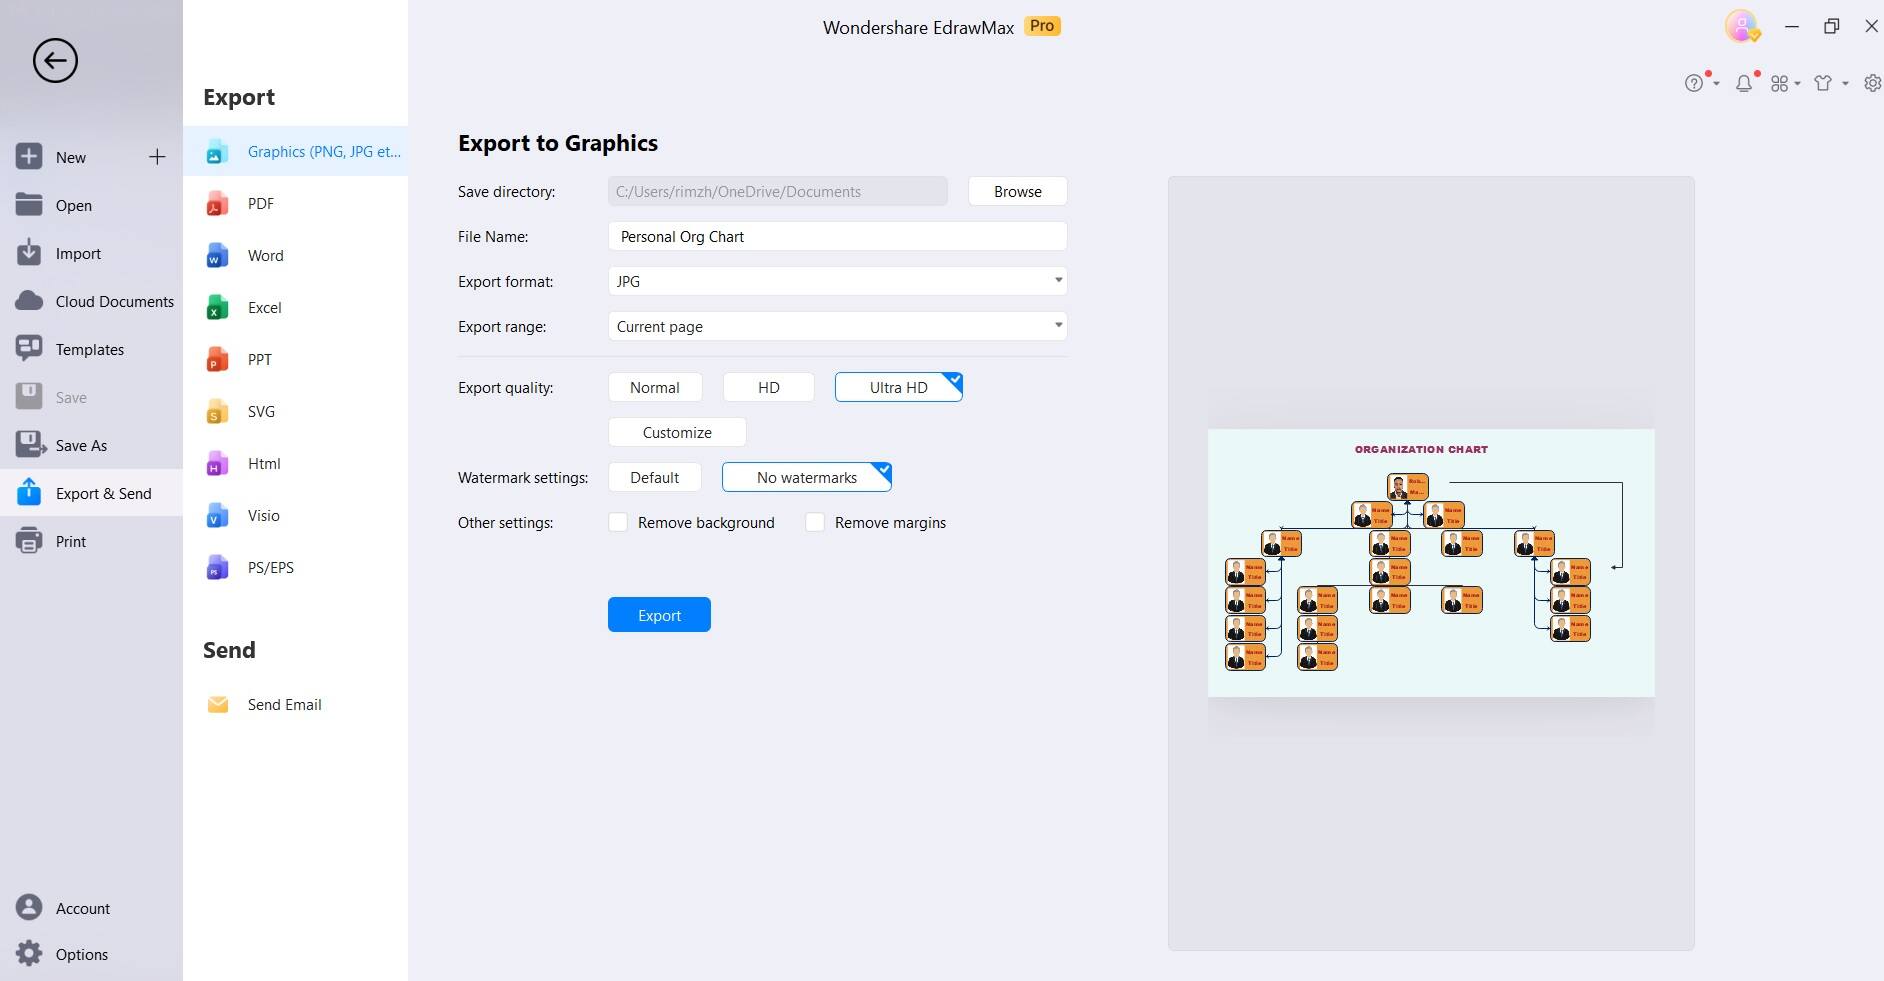
Step 6: Click on "File" and then select "Save" to save your organizational chart to your desired location on your computer. Once you're satisfied with your chart, you can export it in various formats like PDF, or PNG, or directly share it through email or social media.
Following these steps, you'll be able to create a professional-looking organizational chart using EdrawMax efficiently.
Part 5. Best Online Tools to Create Organization Charts
Creating clear and concise organizational charts is crucial for visualizing team structures and hierarchies. Here are some of the best online tools that facilitate easy organization chart creation:
#1 Wondershare EdrawMax: EdrawMax is a versatile and user-friendly diagramming tool that excels at creating detailed organizational charts. It offers a rich library of shapes and templates, advanced customization options, and seamless integration with Microsoft Office applications, making it a top choice for professionals seeking comprehensive charting capabilities.
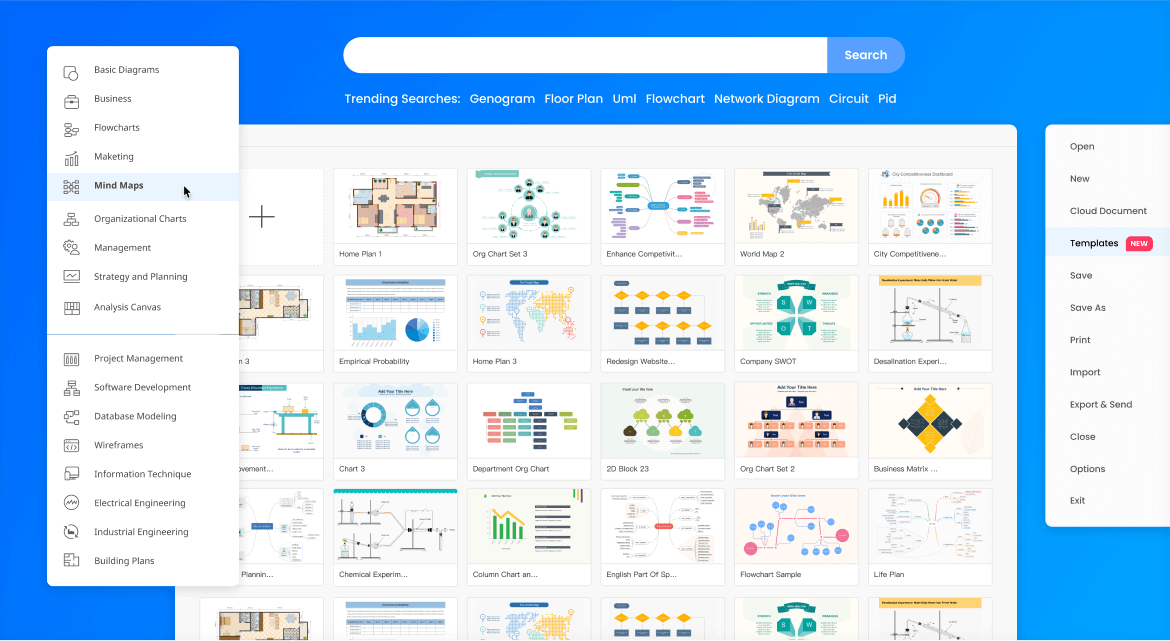
#2 Canva: Canva is a web-based design platform known for its intuitive interface and extensive range of design templates. While it's not specifically designed for organizational charts, it can be adapted for this purpose.

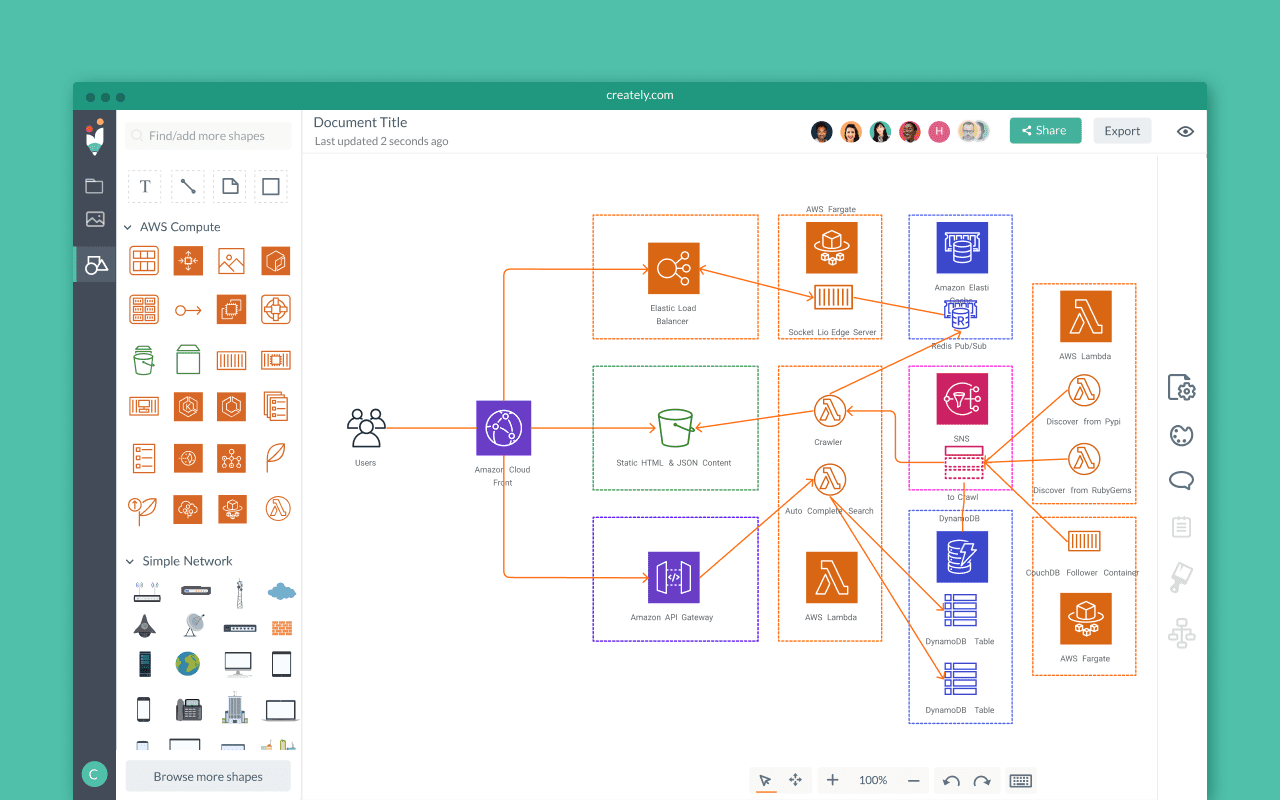
#3 Creately: Creately is an online diagramming tool that specializes in collaborative diagram creation. It offers a range of templates, including organizational charts, and enables real-time collaboration for team projects. With features like drag-and-drop functionality and a variety of shapes and connectors, Creately streamlines the process of creating clear and visually appealing organizational charts.
Conclusion
In today's dynamic workplaces, creating accurate and visually appealing Office 365 organizational charts is essential for effective communication and team management. While Office 365 offers basic tools like Word and PowerPoint, specialized software like Wondershare EdrawMax provides advanced customization and compatibility. Canva adds a creative touch, and Creately excels in collaborative editing.
Choosing the right tool depends on specific needs, but investing in a robust charting tool ultimately streamlines organizational visualization, enhancing productivity and clarity in team structures.


