


PowerPoint is efficient with slides but may challenge beginners with Venn diagrams. While other tools handle it better, sometimes, PowerPoint becomes the only choice.
Therefore, I spent hours adjusting shapes, fixing alignments, and using SmartArt. Initially, the text overlapped, and the circles did not align as intended. I felt frustrated until I discovered a solution.
In this write-up, I'll show you exactly how to make a Venn diagram in PowerPoint using two methods based on my hands-on experience. You'll also learn about a better alternative tool for better and easier results.
In this article
What Is a Venn Diagram?
A Venn diagram shows how data sets connect. It uses circles that intersect. Each circle represents a group. Overlapping areas reveal standard features, while non-overlapping areas show distinct traits.
Types of Venn Diagrams
- Two-Circle Venn Diagram: The simplest design to compare two groups with one overlapping section.
- Three-Circle Venn Diagram: A design that maps the intersections among three groups.
- Multi-Set Venn Diagram: A design for four-circles or more circles that often calls for creative layouts.
Where Are They Used?
- Education: It explains similarities and differences in subjects.
- Business & Marketing: It compares products, competitors, or customer groups.
- Data Science: It displays overlapping data for improved clarity.
- Decision-Making: It assists in weighing options based on shared and distinct characteristics.
A Venn diagram organizes complex data into clear visuals. It serves well in both analysis and instruction.
How to Create a Venn Diagram in PowerPoint with SmartArt
Let's find the SmartArt feature in PowerPoint and make a diagram with it. It's easy and free.
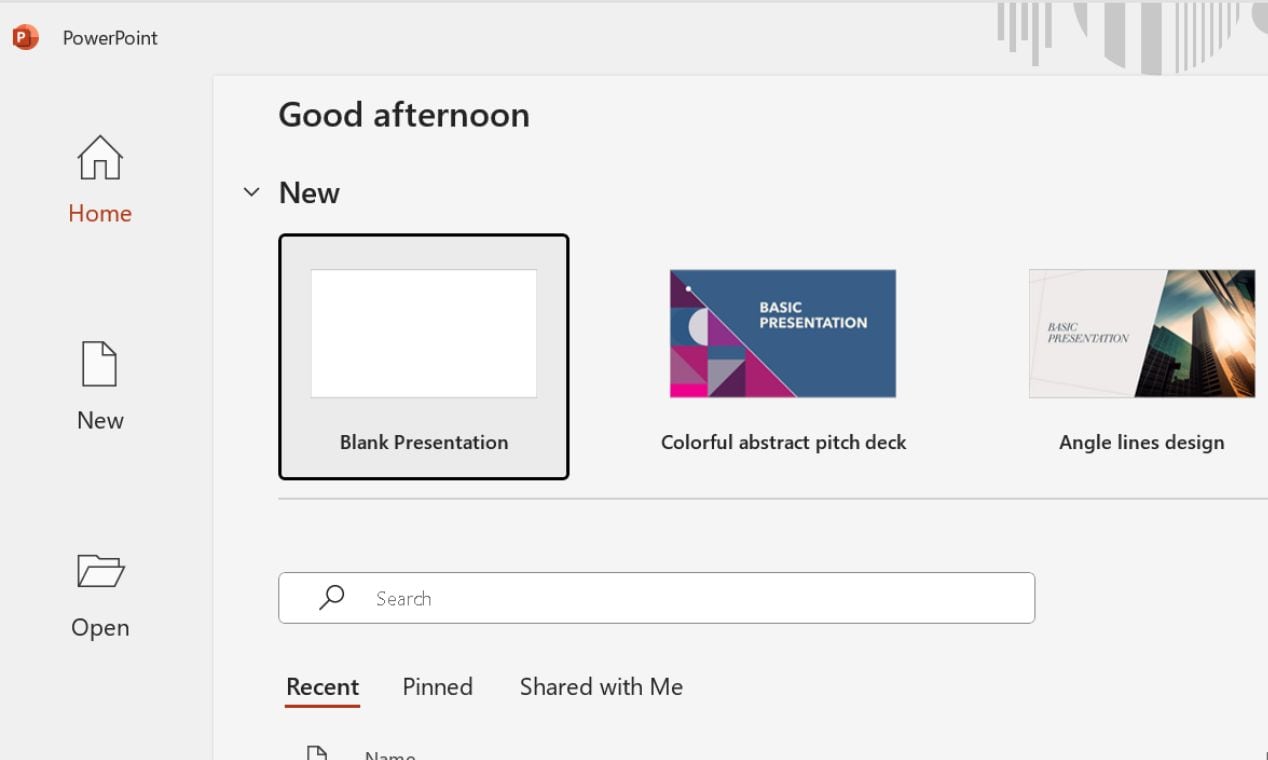
Step 1: Open PowerPoint and Insert a New Slide
Open the slide for your Venn diagram in PowerPoint.
To begin fresh, click the Blank Presentation button on the Home tab.
Step 2: Insert a SmartArt Graphic
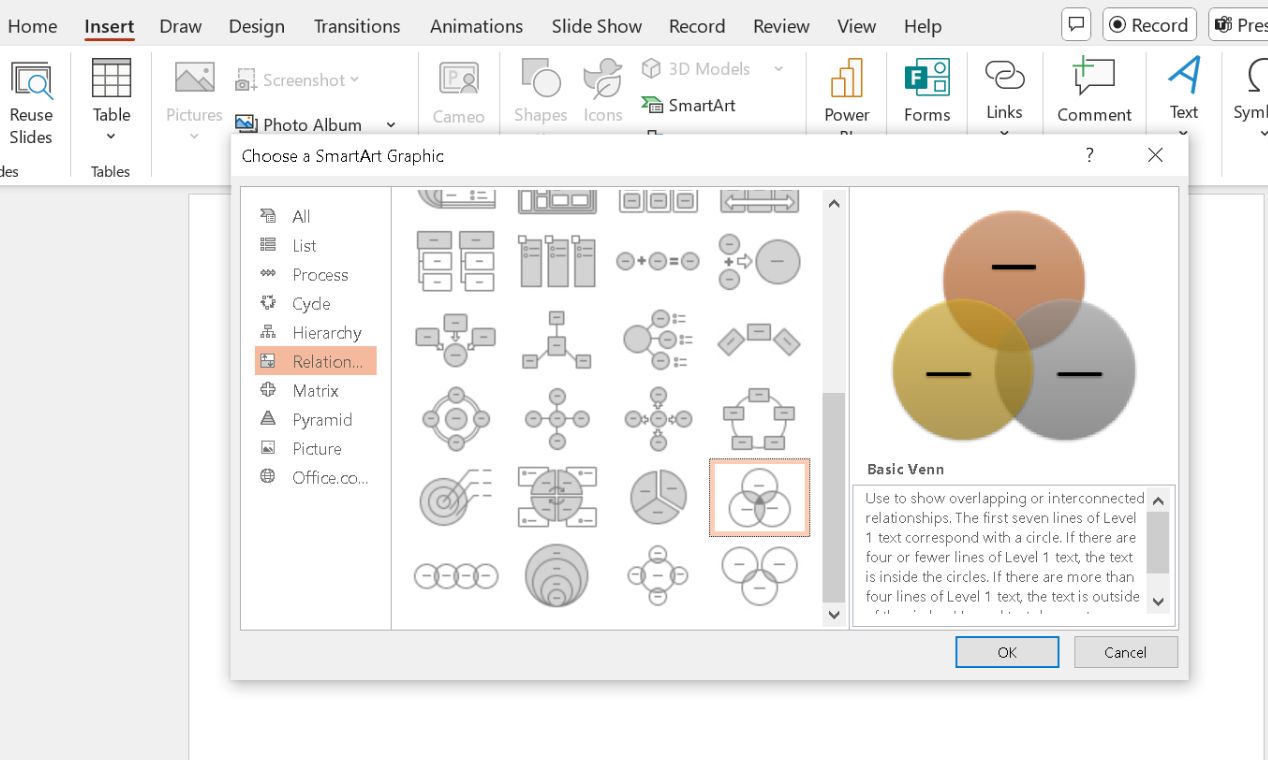
The SmartArt feature includes pre-designed Venn diagram models that ease diagram creation.
- Select SmartArt from the Illustrations group in the Insert tab.
- In the dialog box, select the Relationship category, scroll, and choose Basic Venn.
- Click OK to insert the diagram.
- If additional circles are needed, you can add them later via the SmartArt Design tools.
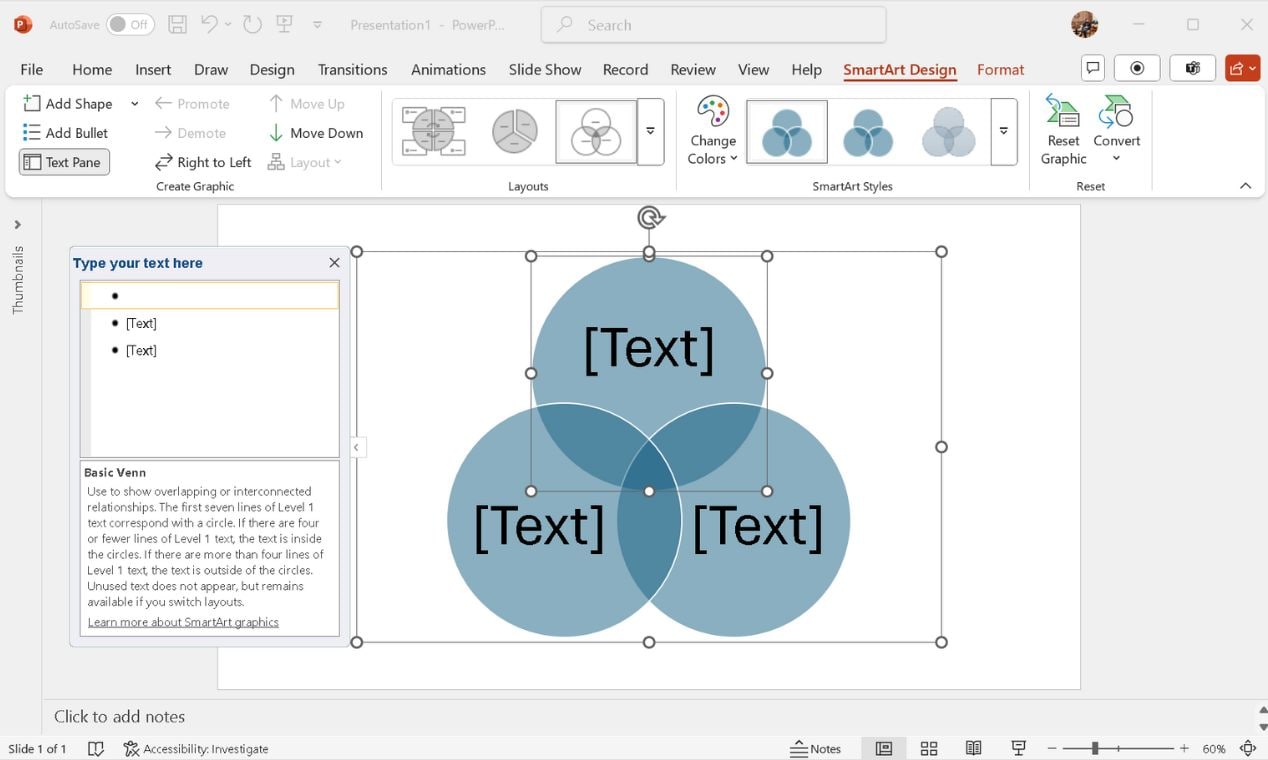
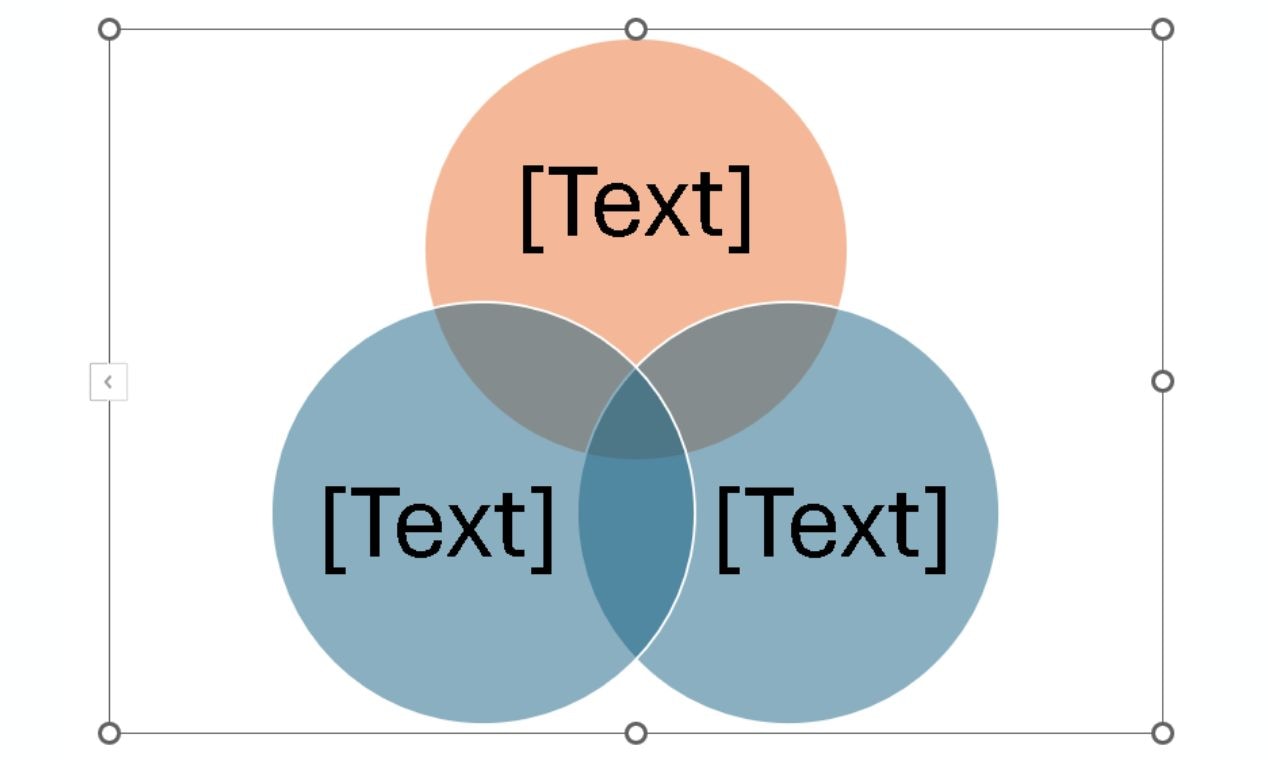
Step 3: Customize the Venn Diagram with Text
- Click a circle to type text directly or use the Text Pane on the side.
- Keep text brief to maintain clarity in overlapping areas.
- From the SmartArt Design tab, tap the diagram and select Add Shape to add more circles if required.
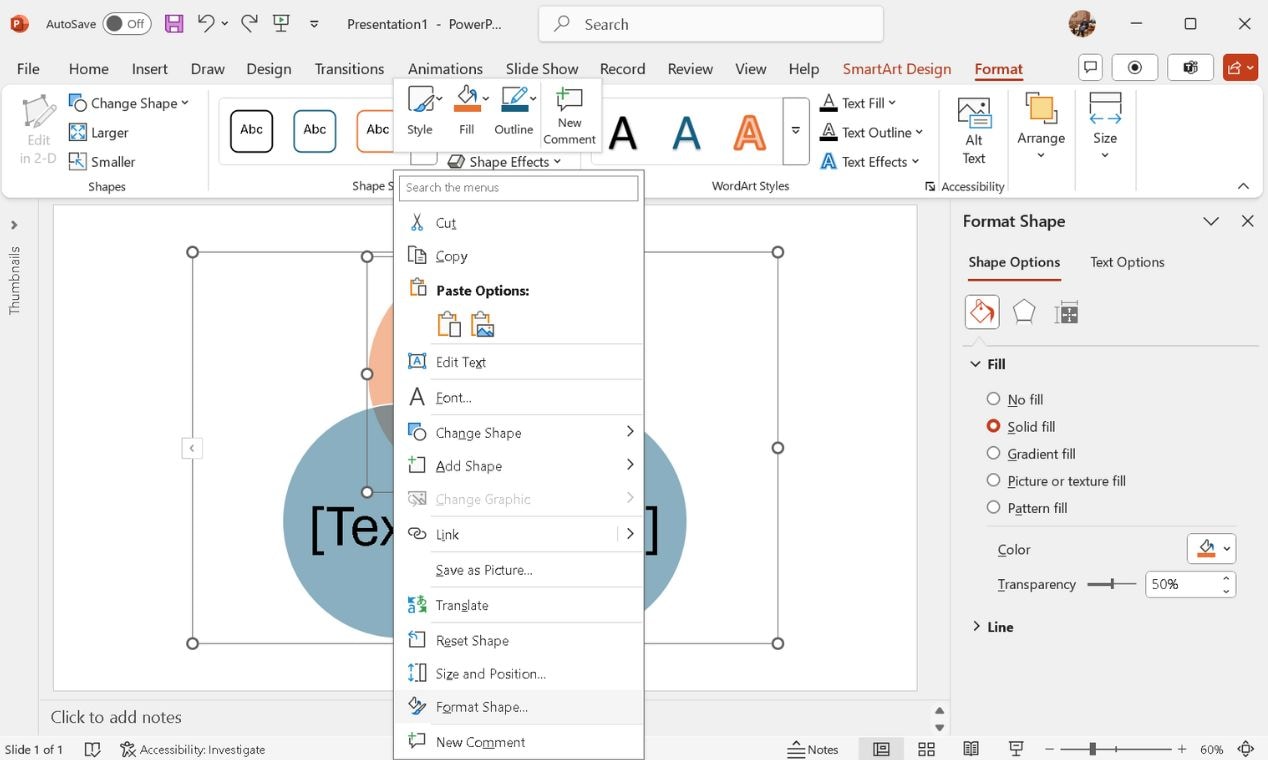
Step 4: Adjust Colors and Transparency for Clarity
Enhance readability by modifying the fill colors and transparency of the circles.
- Select a circle and access the Format Shape from the Right-click menu.
- Click Shape Fill to change the shape color.
- Use the Transparency slider to adjust the fill; a setting between 30% and 50% works well.
- Apply the same settings to all circles for a consistent look.
Step 5: Resize, Reposition, and Save Your Diagram
After finalizing the text and visuals, adjust the diagram’s size and position.
Select the diagram and drag the edges to resize it proportionally.
Center the diagram using alignment guides.
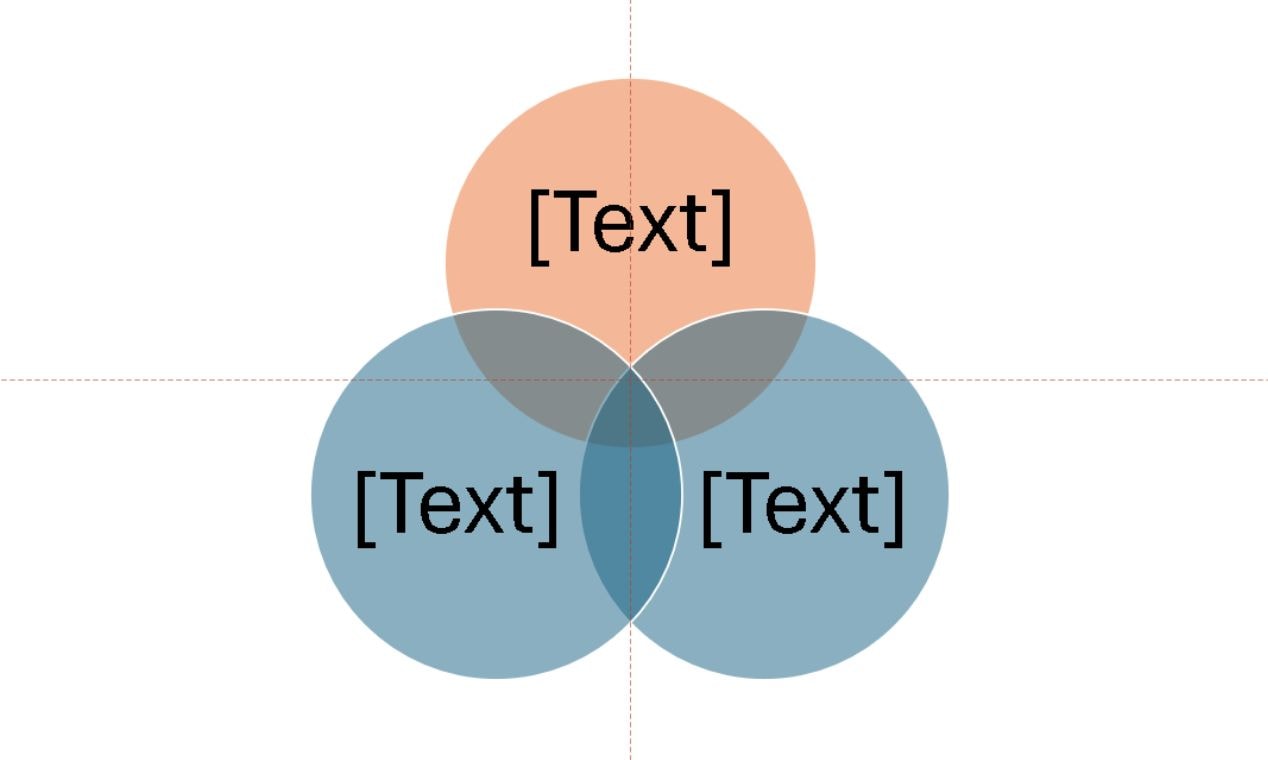
Click outside the diagram to complete the adjustment.
Use the zoom-in feature to ensure all elements are properly aligned.
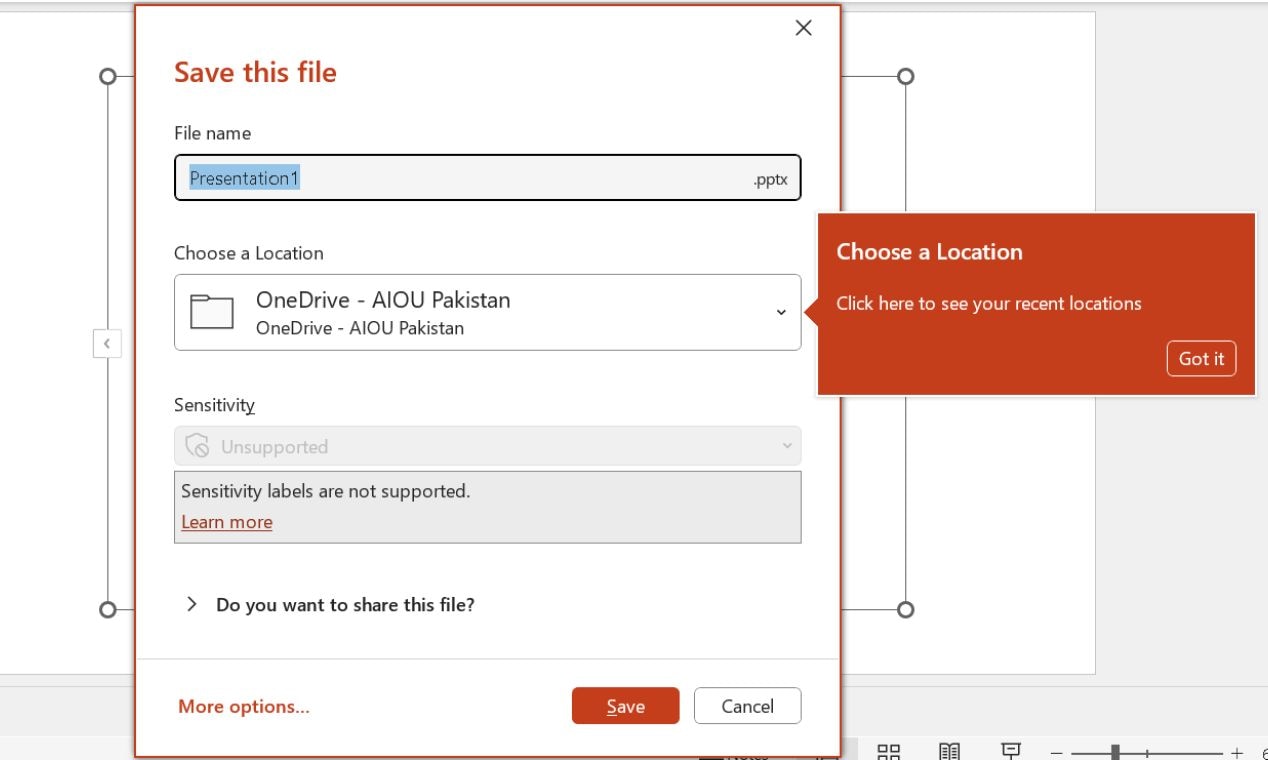
After finalizing, hit CTRL + S to save your work. Rename it and choose your preferred location before clicking the Save button.
Method 2: Create a Venn Diagram in PowerPoint Manually Using Shapes
Step 1: Insert Basic Shapes
- Begin by inserting circles manually on your desired slide.
- From the Insert tab, click on Shapes. Select the Oval shape from the Basic shapes.
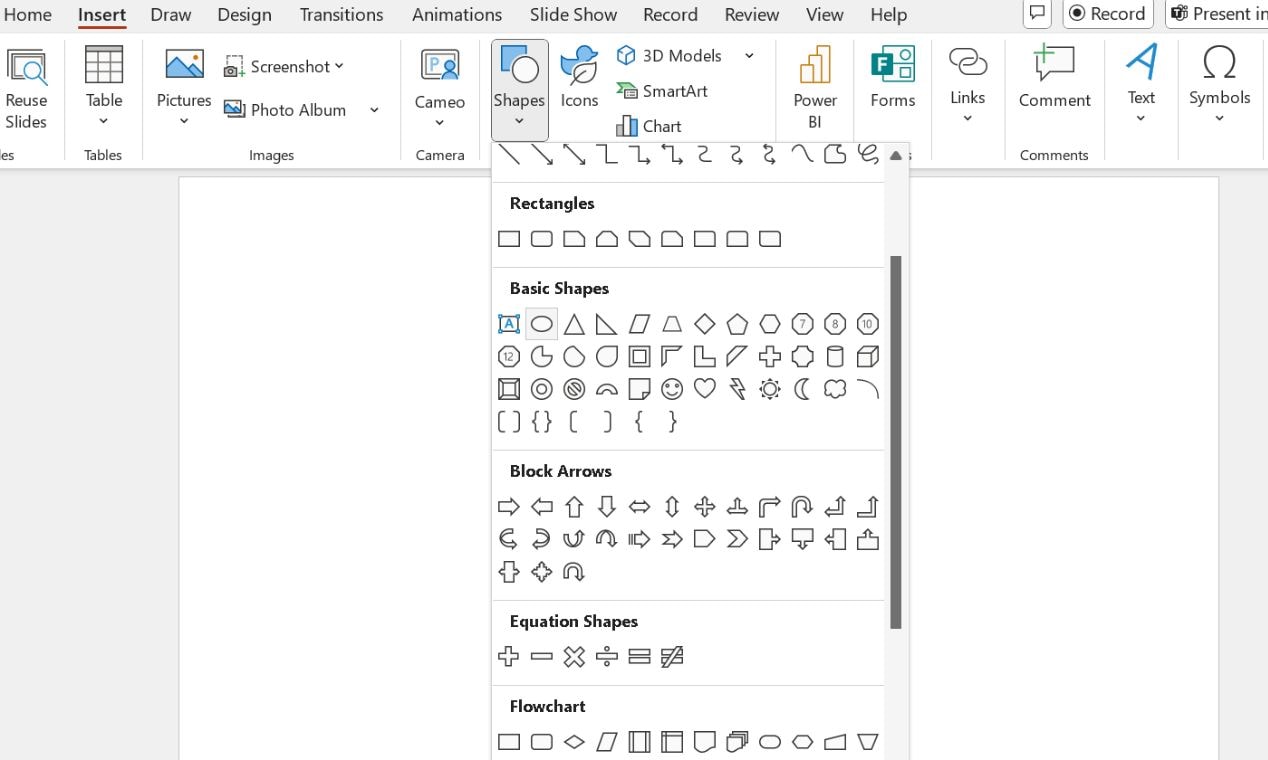
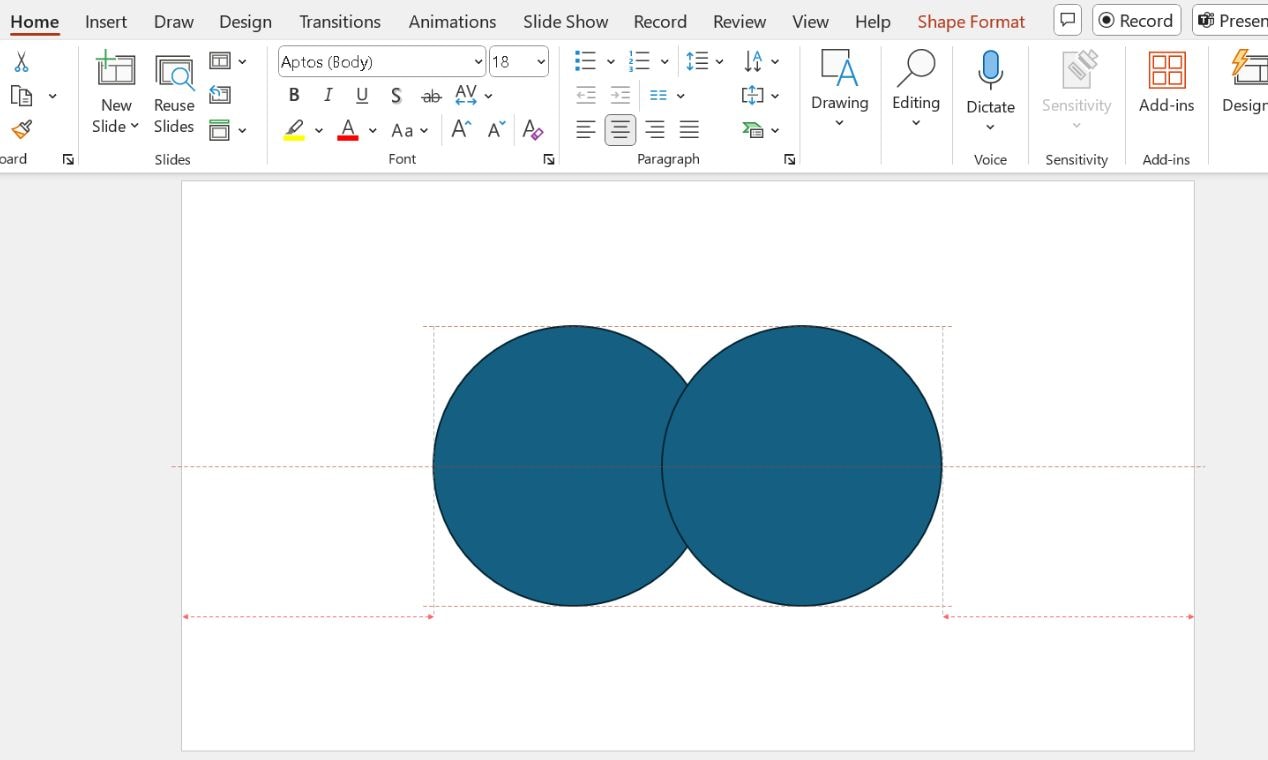
- Hold Shift while dragging the cursor to create a perfect circle.
- Duplicate the drawn circle as needed to build the diagram.
- Select the circle, copy it using Ctrl+C, and paste it with Ctrl+V.
- Align and arrange the circles to overlap to show the desired relationships.
- Add as many circles as required.
Step 2: Adjust Colors and Transparency
Color settings help separate each circle and its overlaps.
- Select a circle and access the Shape Format tab to adjust shape color, transparency, and more, just like we did in the previous method.
- Choose contrasting colors to prevent merging.
Step 3: Add and Format Text Boxes
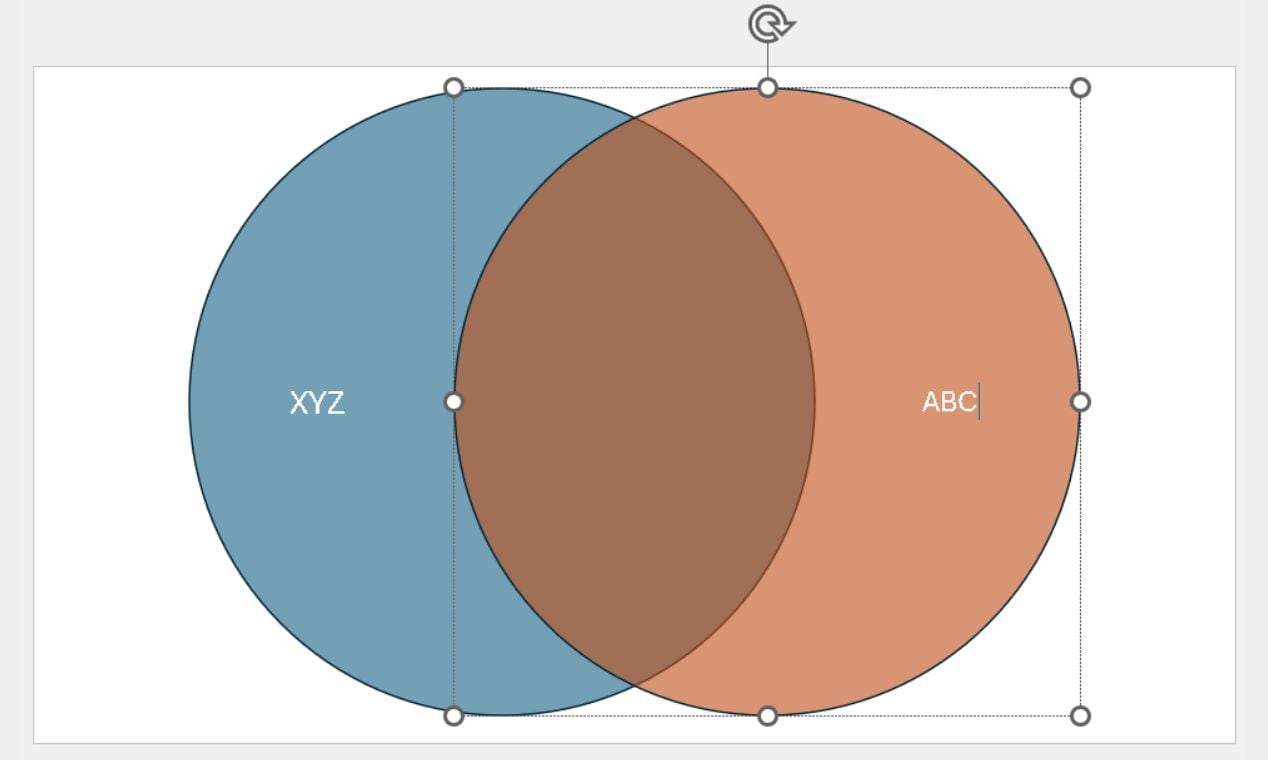
Label each circle to ensure clarity.
Double-click inside each circle and enter the label.
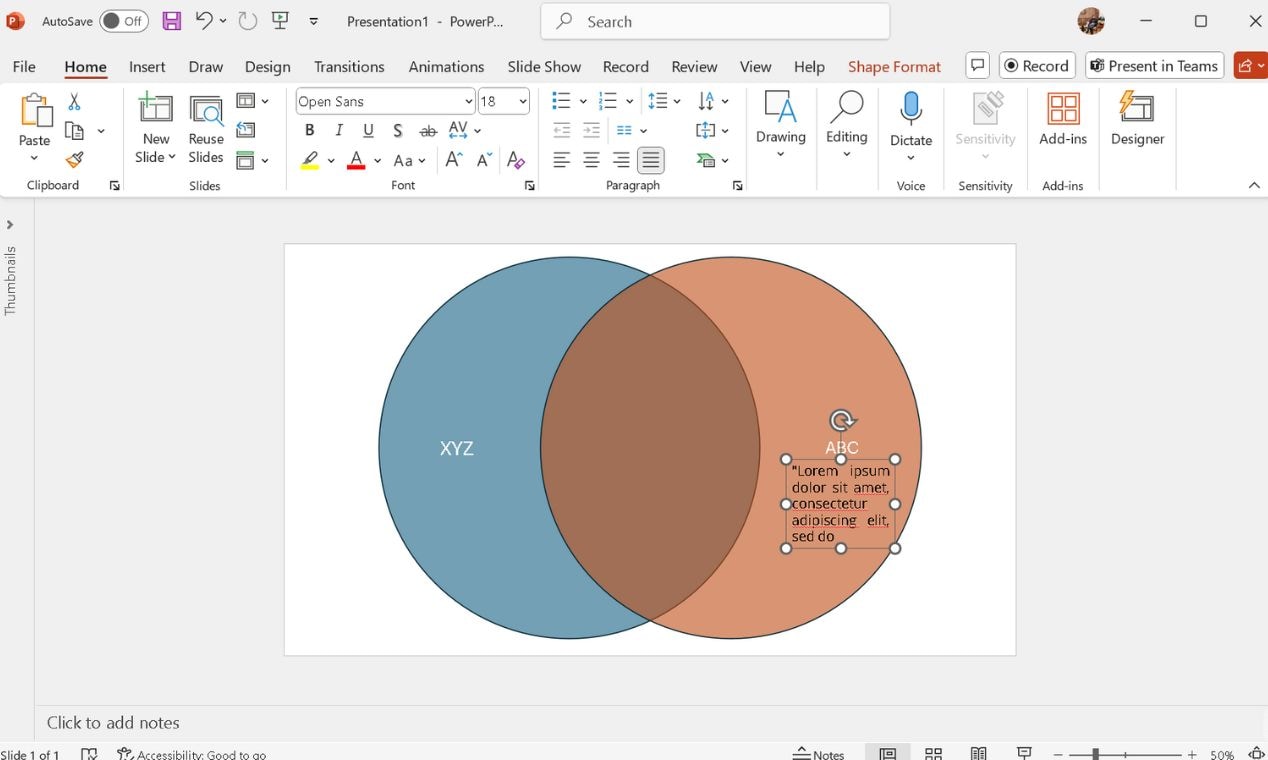
Go to the text from the Insert tab and then the Text Box to add the relevant details.
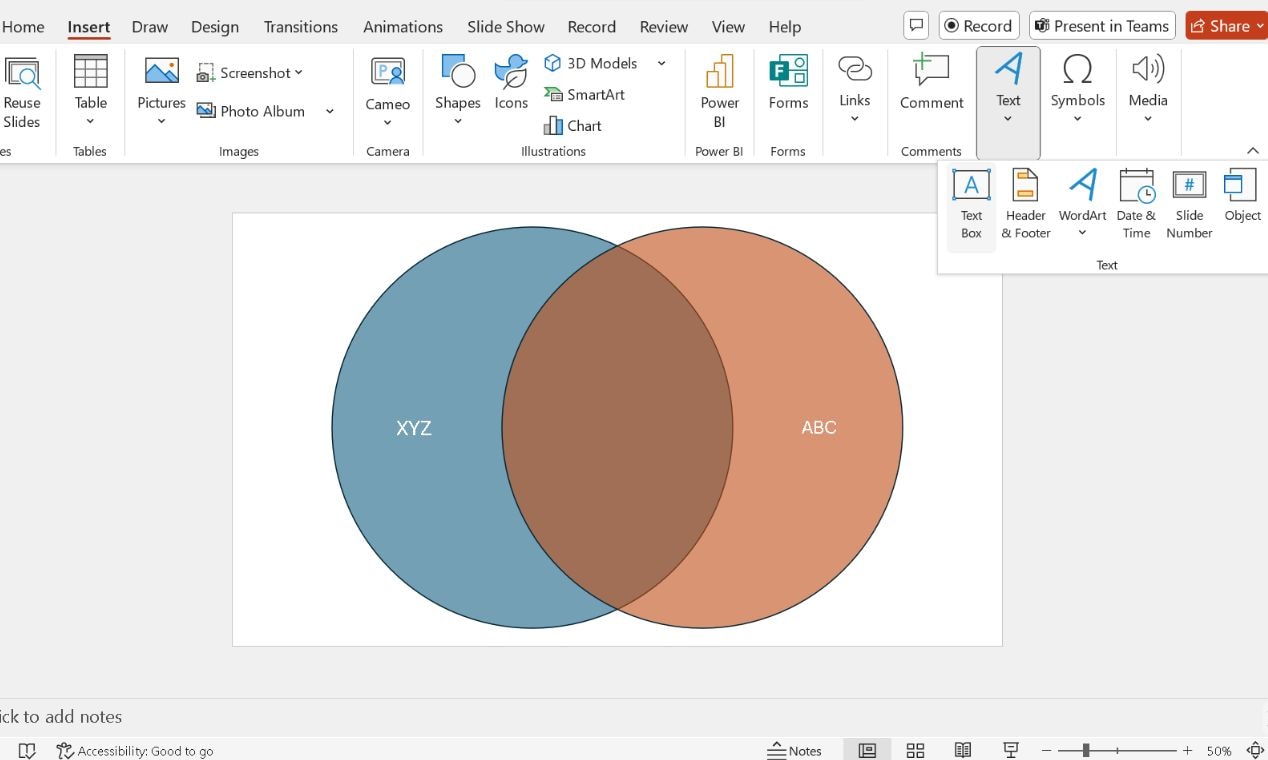
Use the Home tab to format the text and adjust font, size, color, etc.
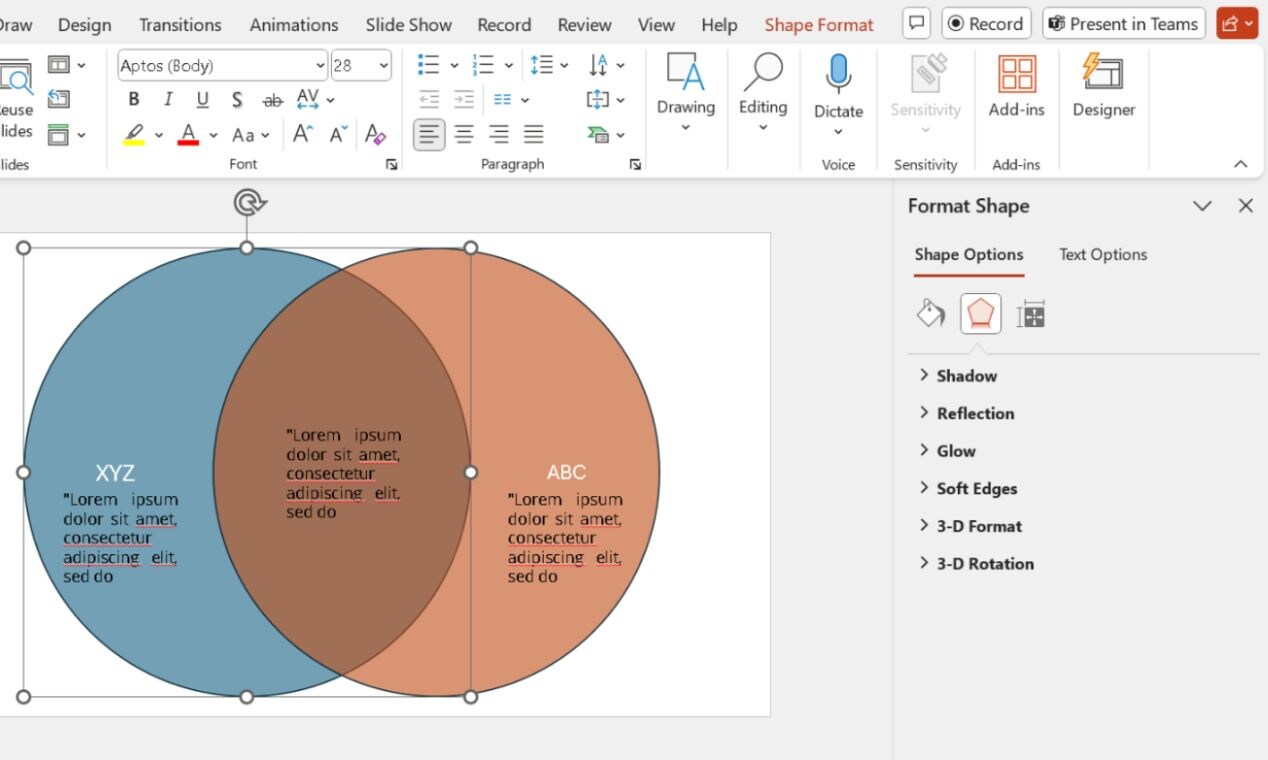
Step 4: Fine-Tune Your Venn Diagram Design
Refine the diagram after adding shapes and text.
If necessary, use the Shape Options in the Shape Format tab to add relevant Effects (subtle shadow, reflection, glow, or others).
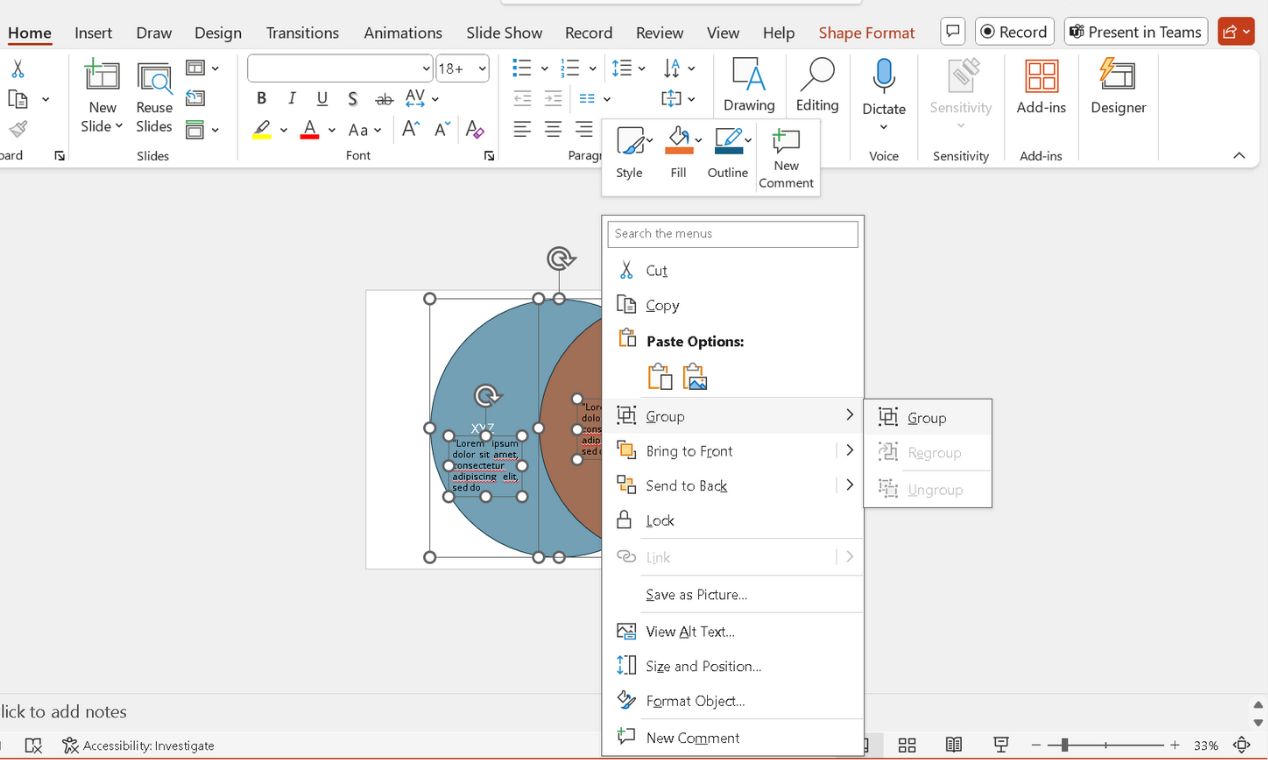
Group all circles and text boxes by selecting every item (CTRL + A), right-clicking, and choosing Group.
It helps the diagram remain aligned during further changes.
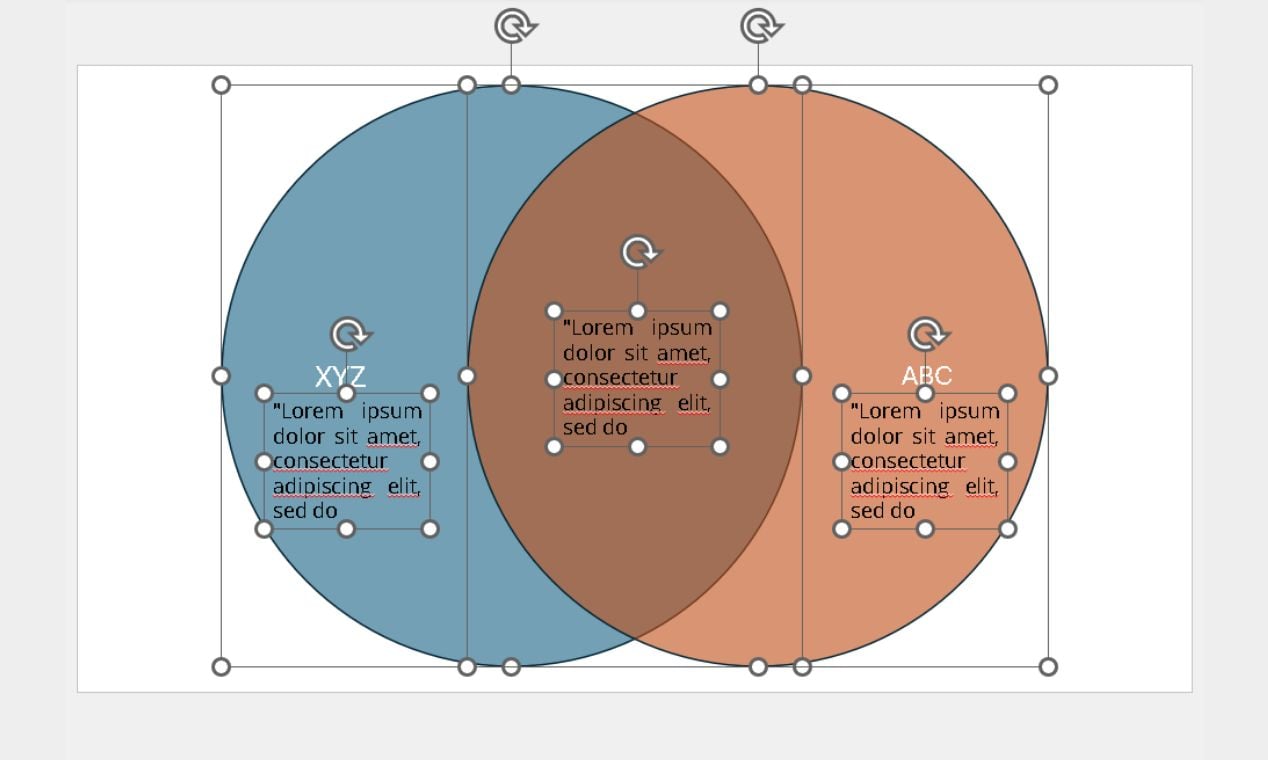
Step 5: Final Adjustments and Export
Perform final checks on the diagram’s alignment and size.
Resize the grouped elements by dragging the corner handles if necessary.
Save the slide (CTRL + S) and keep an editable copy for future updates.
Choose the Right Method
- Use SmartArt for a quick, structured Venn diagram with minimal manual adjustments.
- Use the manual shape method for full design control and more customization options.
Both techniques work well. The amount of customization you need can help you decide your approach.
Method 3: How to Make Venn Diagrams in PowerPoint with EdrawMax Add-in
Instead of manually tweaking every element, you can use the EdrawMax PowerPoint Add-in. It lets you insert ready-made diagrams in PowerPoint and customize them effortlessly. Whether you need a Venn diagram, flowchart, or mind map, the process is streamlined with just a few clicks. Let’s see how.
How to Use EdrawMax Add-in for PowerPoint?
Step 1: Install and Enable the Add-in
Download EdrawMax and install the add-in manually.
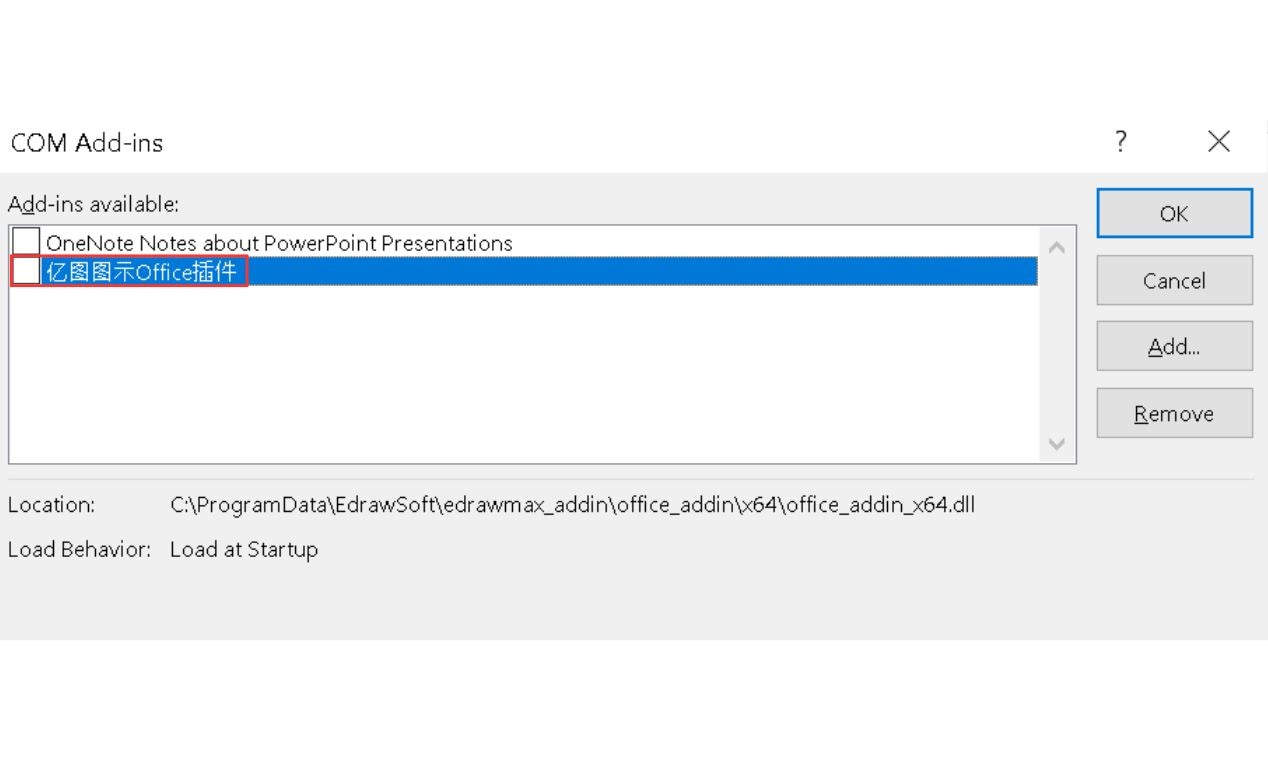
Alternatively, download the add-in directly here, the add-in installs automatically, but if it doesn’t appear in PowerPoint, enable it from File > Options > Add-ins > Manage.
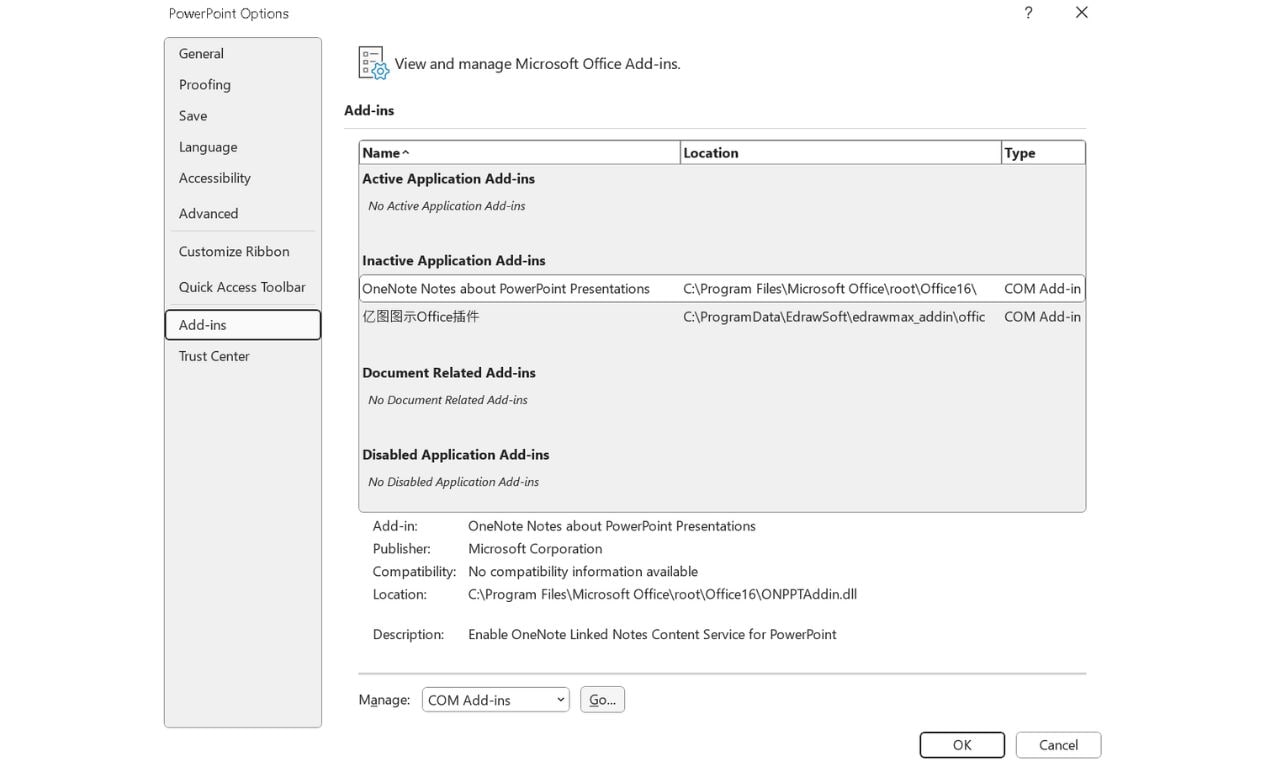
- Ensure the EdrawMax add-in is enabled and click OK.
Step 2: Insert a Diagram Instantly
- Open PowerPoint and go to the EdrawMax tab in the top menu and explore diagram types and Text-to-Slide features.
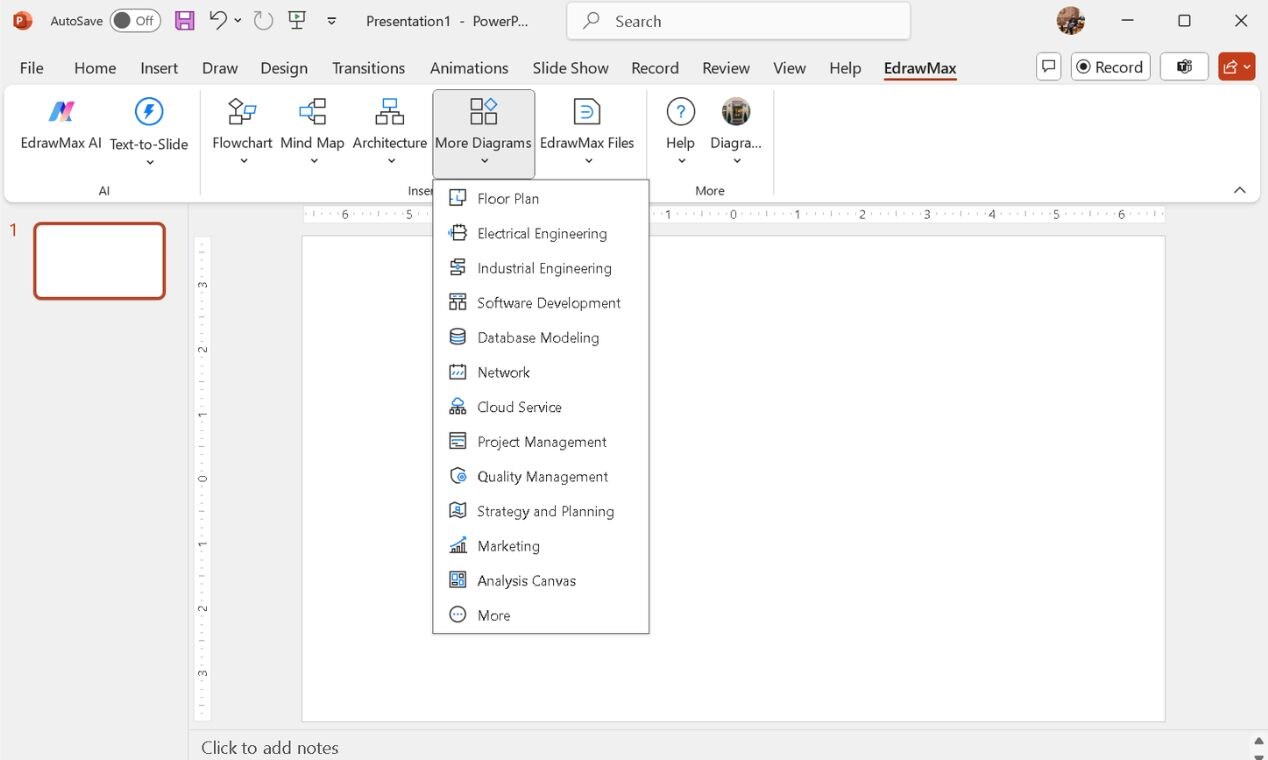
- Go to More-Diagram>More to browse templates for Venn diagrams, mind maps, flowcharts, and more.
- Choose your preferred diagram, and it will be placed onto your slide.
Step 3: Customize the Diagram
- Resize and relocate it with the dragging and dropping features.
- Double-click the inserted diagram to open it in EdrawMax.
- Modify colors, fonts, and transparency without PowerPoint’s limited formatting tools.
- The drag-and-drop interface makes alignment effortless.
Step 4: Save and Present
- Once finalized, close EdrawMax, and the diagram will automatically be updated in PowerPoint.
- Then, save your PowerPoint file, and you're ready to present a polished, professional diagram.
Why Use the EdrawMax Add-in Instead of PowerPoint’s Built-in Tools?
- Faster Diagram Creation: No need to manually adjust shapes and text.
- Rich Templates & Symbols: Access thousands of pre-designed elements.
- One-Click Editing: Modify diagrams inside PowerPoint without losing quality.
- AI Features: Auto-generate structured diagrams with AI Text-to-Slide.
With EdrawMax, you skip the frustrating manual work and get polished, professional diagrams in minutes, directly inside PowerPoint.
Method 4: How to Create a Better Venn Diagram with a Template
If you're free from the constraints of the Microsoft Suite and want a more accurate, time-saving tool, EdrawMax Venn Diagram Maker is the ideal solution.
It removes these obstacles with a full set of advanced diagramming features. It includes alignment tools, pre-designed templates, auto-spacing, and more. Instead of tweaking shapes more often, you can focus on the content with better visual results.

Why Pick EdrawMax Over PowerPoint?
- Huge Template & Symbol Library: Access 15,000+ templates and over 26k symbols to speed up your workflow.
- Flawless Alignment & Spacing: No need to adjust shapes manually; EdrawMax helps you do it instantly.
- Full Customization Control: Change colors, transparency, and line styles, and add annotations effortlessly.
- Drag-and-Drop Ease: Move elements freely without PowerPoint’s formatting restrictions.
- Seamless Data Handling: Import data directly (e.g., from Excel ) and export to multiple formats, including PowerPoint.
- Multi-Platform Support: Use it anywhere, on Windows, Mac, or web browsers for more flexibility.
How to Use a Venn Diagram Template?
Here are the simple steps to create a professional Venn diagram.
Step 1: Choose a Template
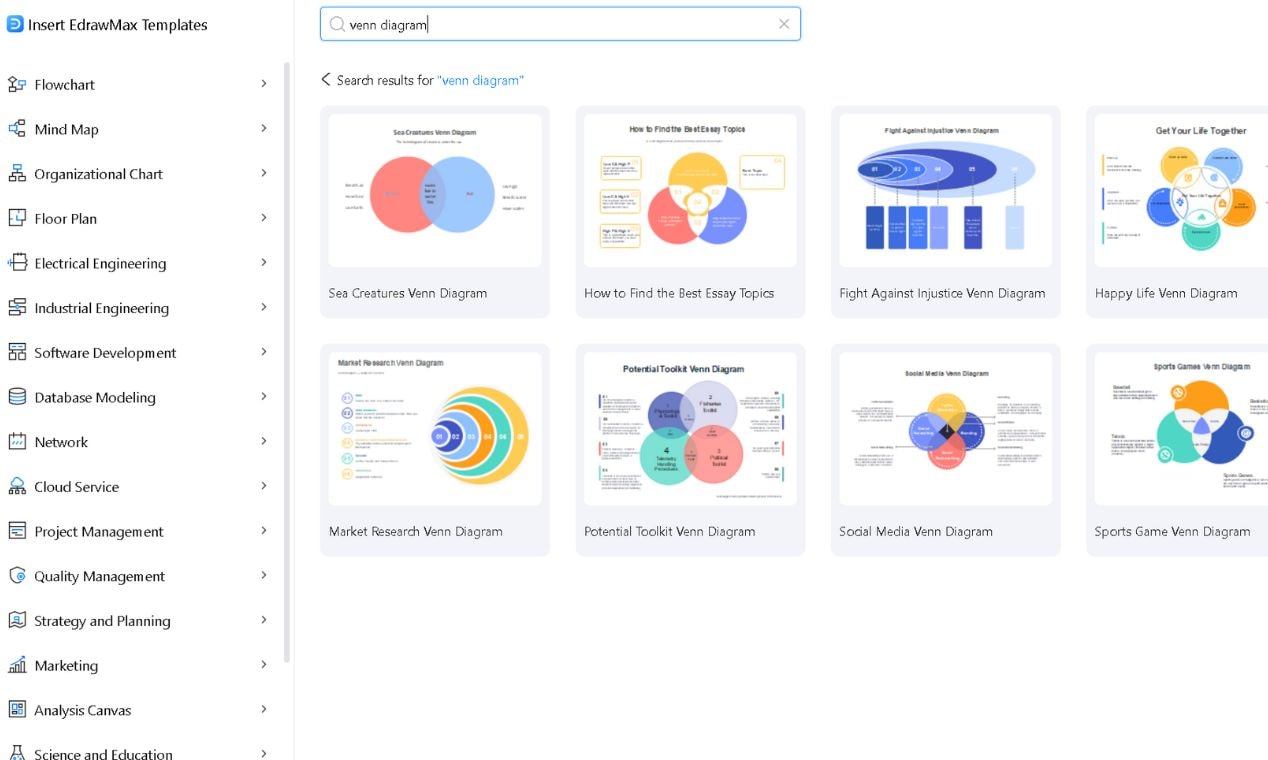
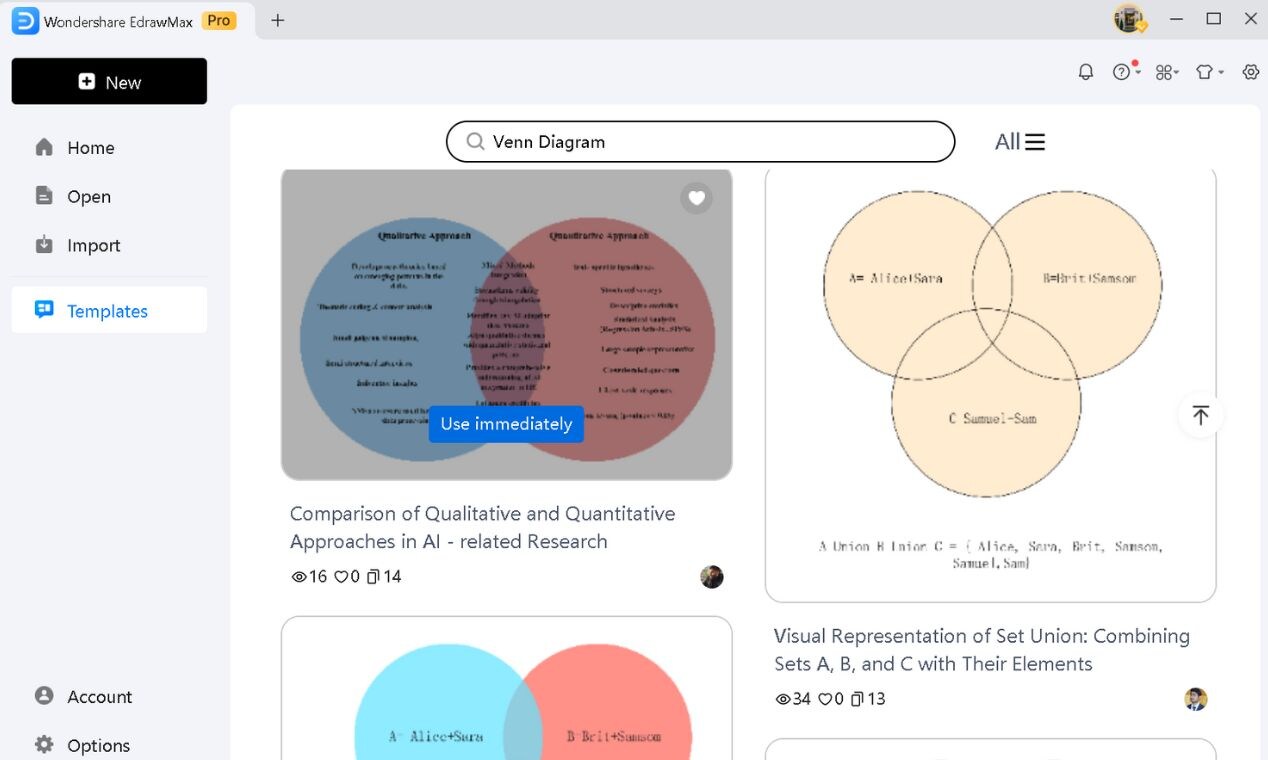
- Launch EdrawMax on your computer and go to the Templates Library.
- Search for the Venn Diagram. Pick a template that fits your data based on the number of sets and layout.
- Click Use immediately to open the selected template in the workspace.
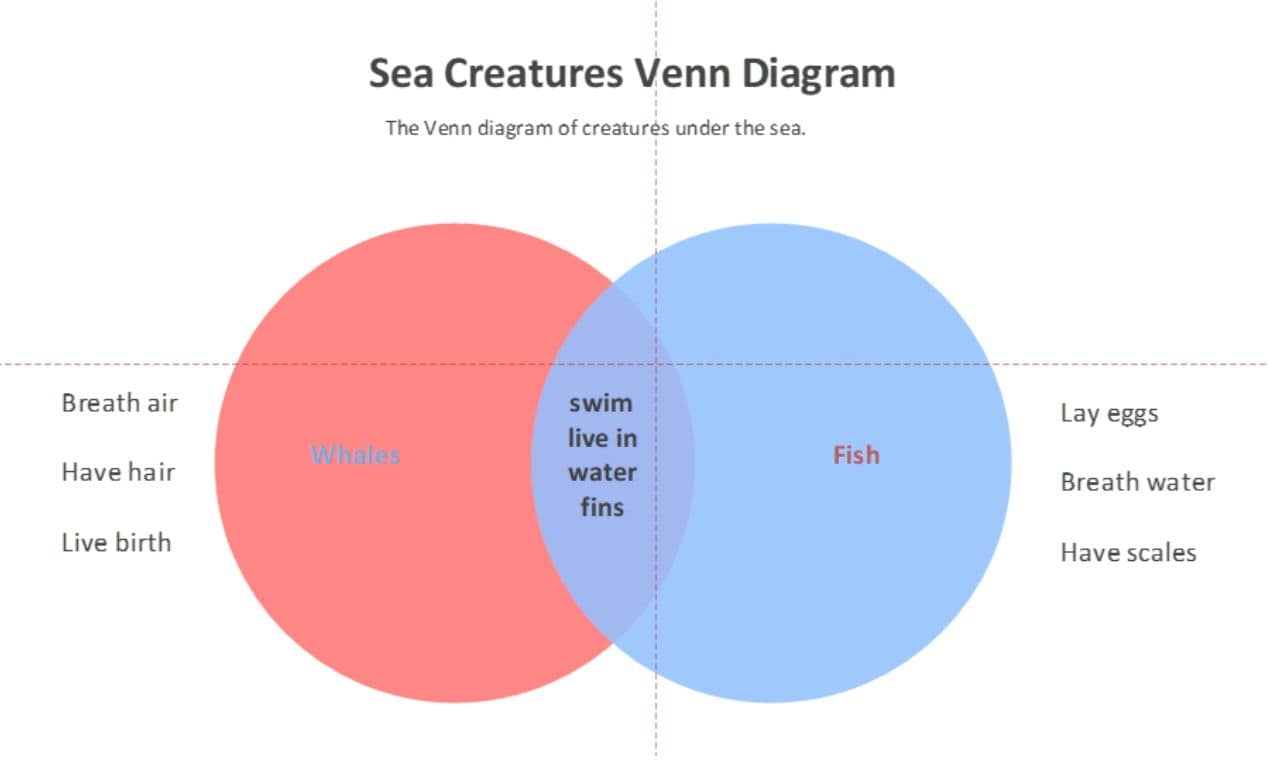
Step 2: Customize Your Diagram
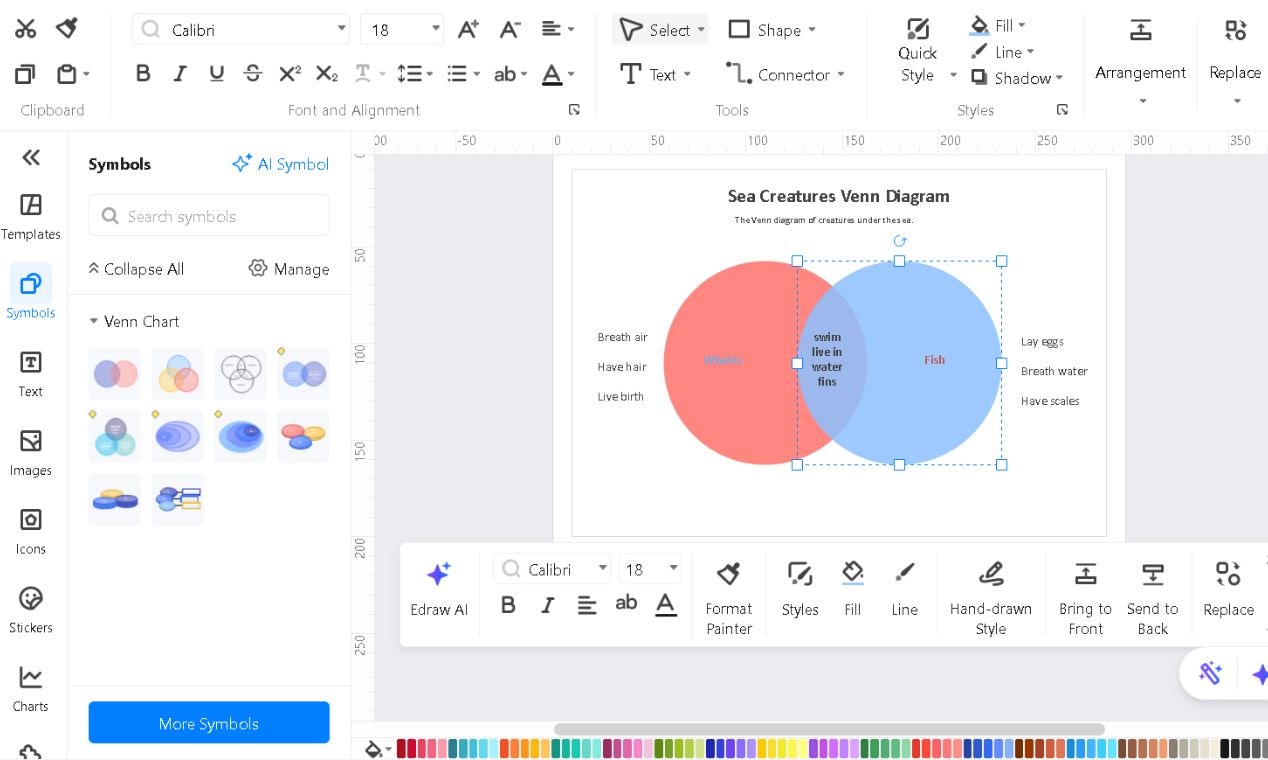
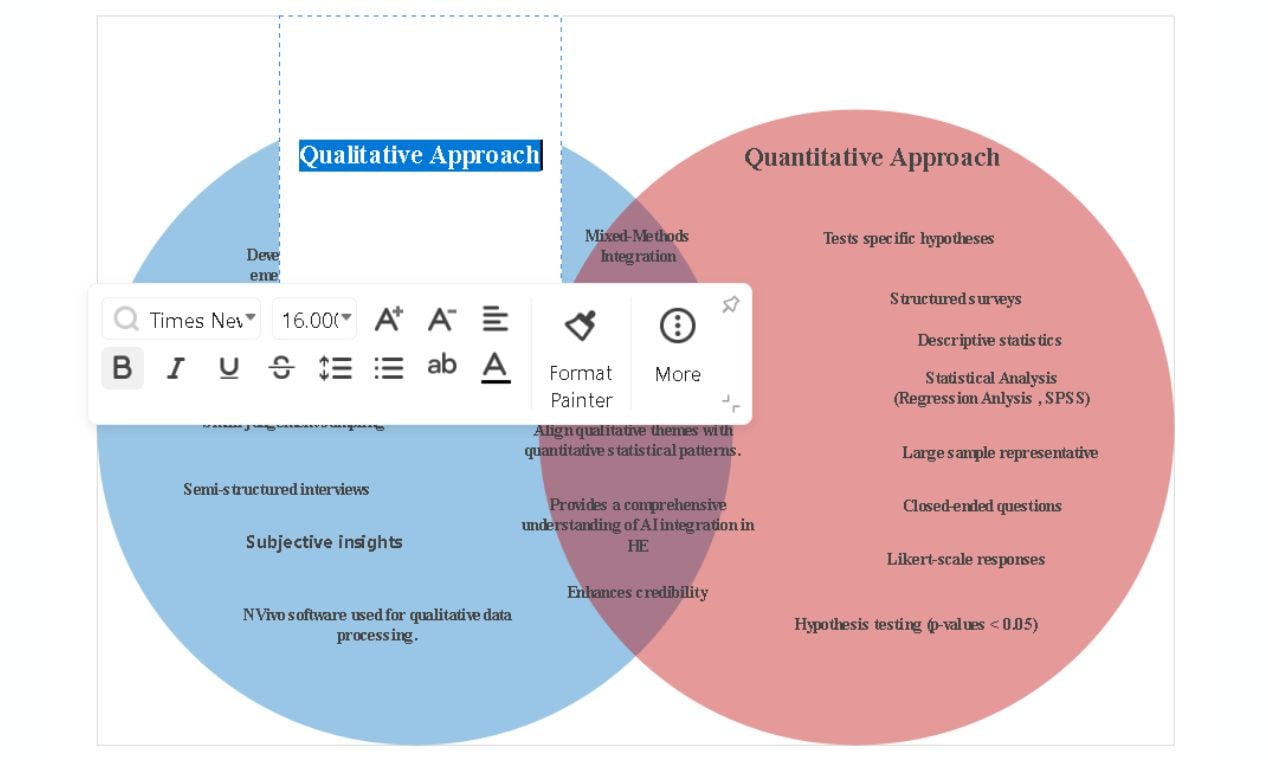
- Double-click any text box to replace the placeholder text with your own data.
- Update the font, size, style, and color for clarity.
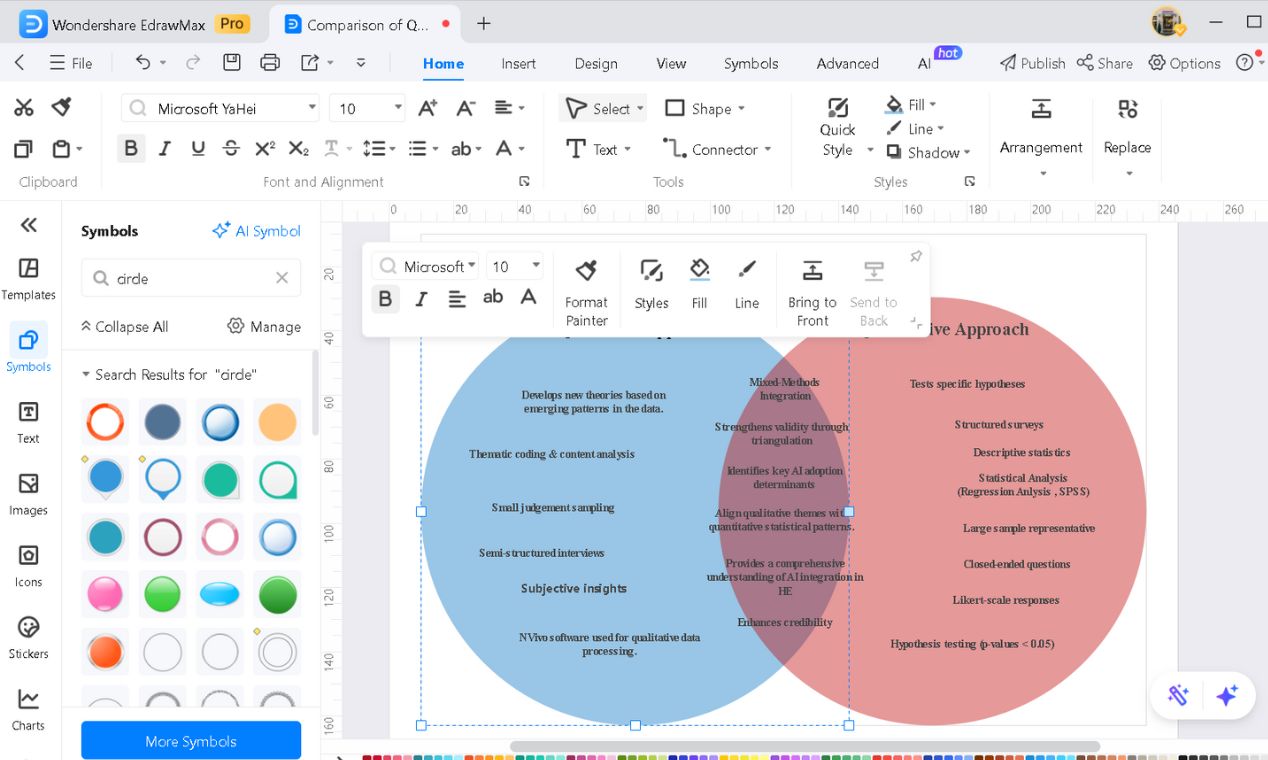
- Add more circles from the Symbols library on the left. Search for a circle or a required shape.
- Resize (select and drag corners) or reposition (click and drag) circles as needed.
- Select any item and tap the Delete button to remove it.
- Modify Style, Fill, and Line to improve readability and enhance distinction.
Step 3: Finalize and Export
- Check for correct labels and overlaps.
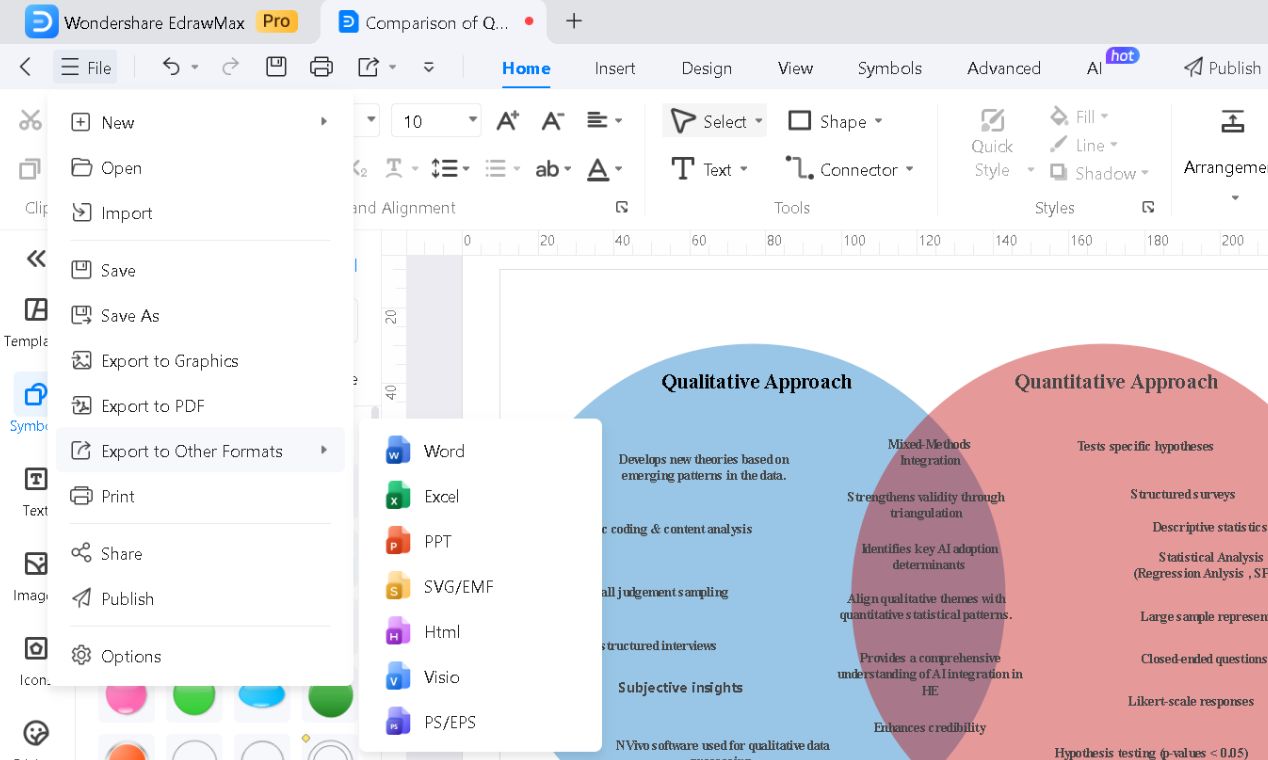
- Save your file in Excel, PowerPoint, PNG, JPG, PDF, or SVG format via File > Export (available formats).
With these steps, you’ll have a clean, professional Venn diagram ready for reports, presentations, or teaching materials.
Best Practices for Creating a Venn Diagram
Here are some expert tips to ensure clarity and professionalism in your Venn diagrams.
Plan Before You Start
Before jumping into PowerPoint, define what you want to compare. If the relationships are complex, sketch the diagram on paper first. This prevents unnecessary adjustments later.
Keep Text Readable
Venn diagrams fall apart when the text becomes hard to read. Stick to short, clear labels. Avoid squeezing too much information inside circles. If needed, place supporting details in callouts outside the diagram.
Maintain Consistent Circle Sizing
When manually drawing circles, ensure they are proportional. Uneven sizes can misrepresent relationships, making overlaps misleading. Use PowerPoint’s Size & Position tool to standardize dimensions.
Choose Contrasting Colors
Avoid colors that blend too much in the overlapping sections. If needed, use outline colors to define separate areas. Keep it simple—too many colors can create visual noise.
Group Elements Before Moving
Before finalizing, group all elements (Ctrl+G) to prevent accidental misalignment. It prevents unintentional misalignment when repositioning it on a slide.
Conclusion
PowerPoint provides the essentials for Venn diagrams, but refinement requires time and patience. SmartArt offers speed, while manual shaping gives more control. Either way, expect to spend time adjusting alignment and transparency.
EdrawMax removes all the hassle. With many templates, precise alignment, and advanced customization, diagram creation is much smoother. If you use Venn diagrams often, it's the smarter choice.
Why waste hours adjusting shapes? Try EdrawMax and create Venn diagrams the easy way!
AI Diagram Generator
Enter your prompt. Upload files if needed. Generate diagrams, charts, or slides instantly.


