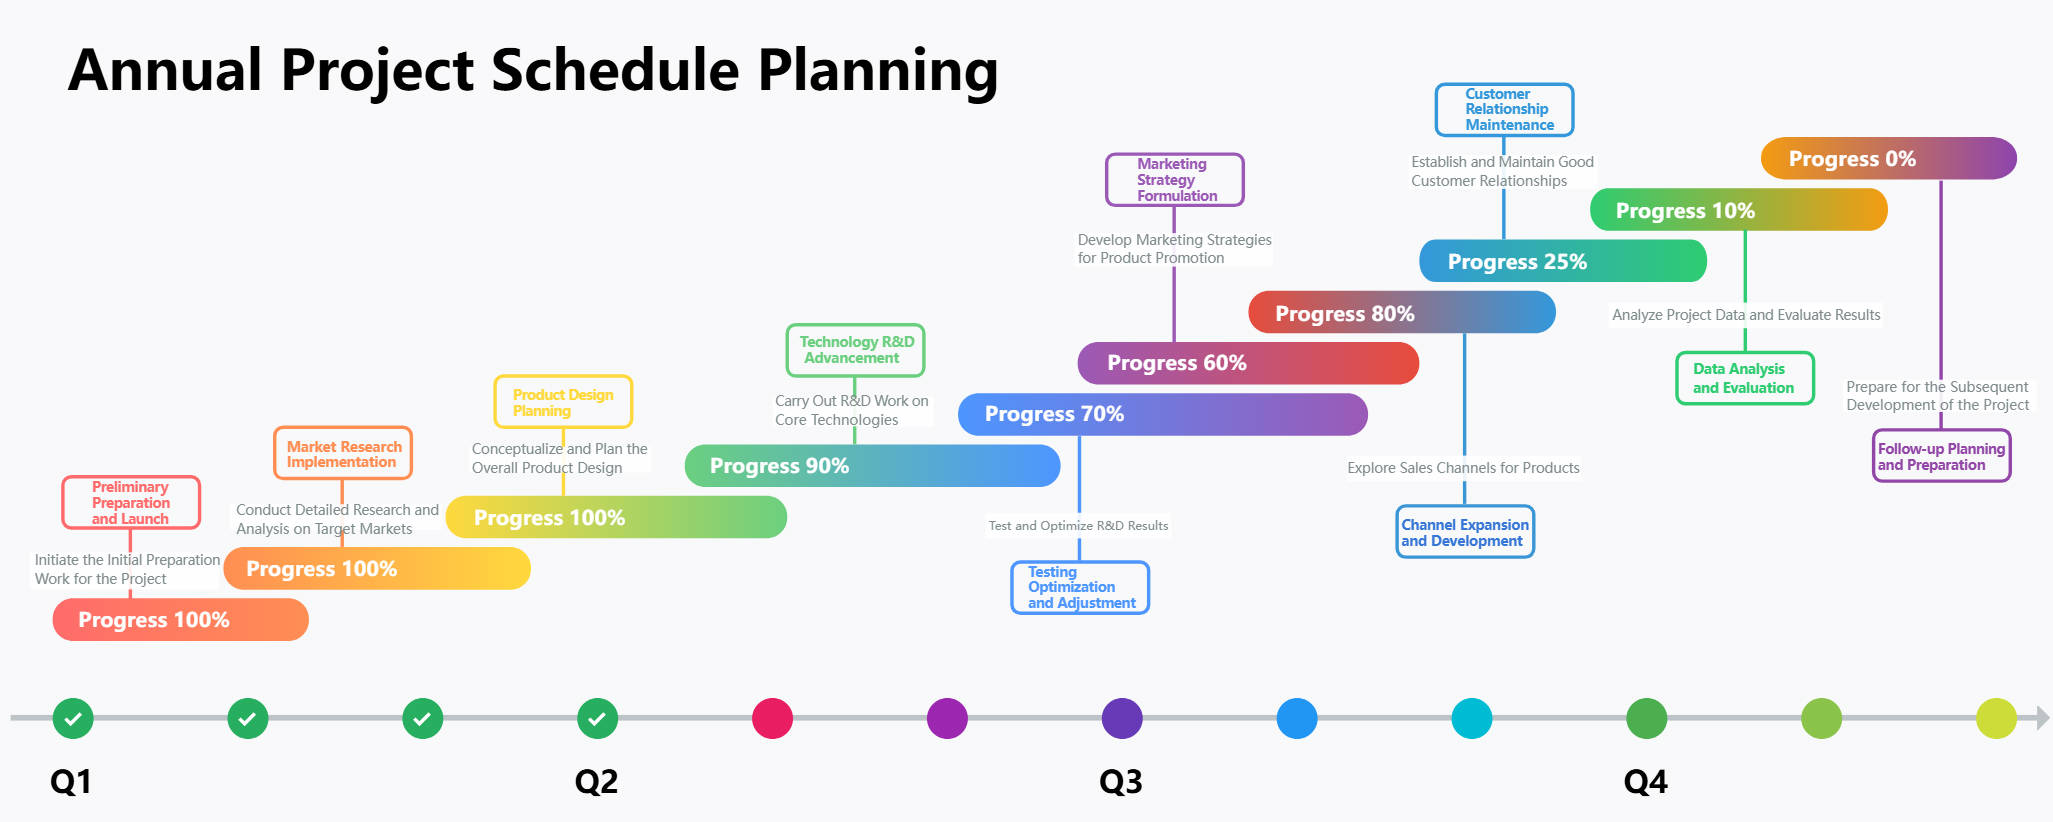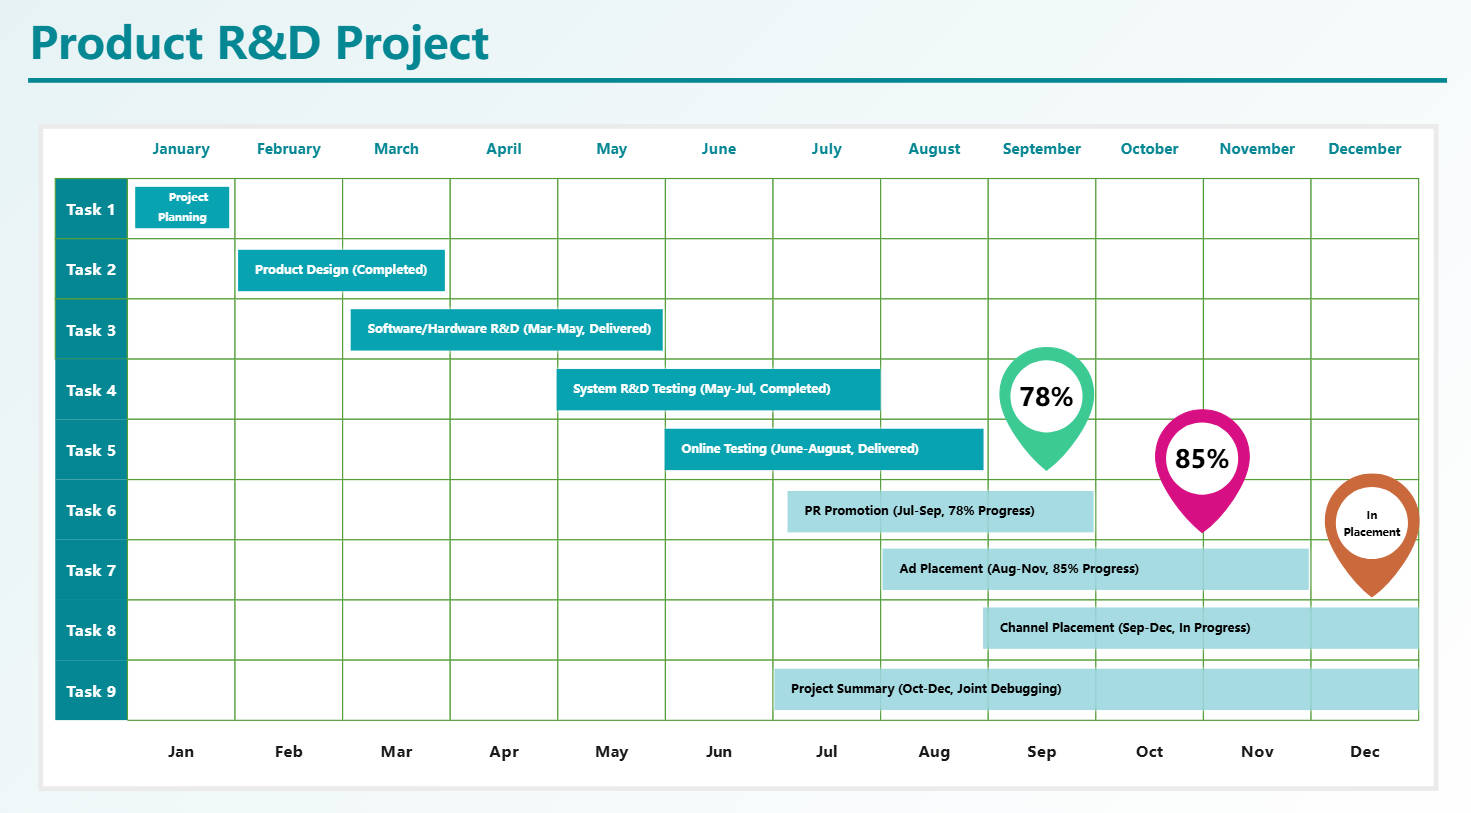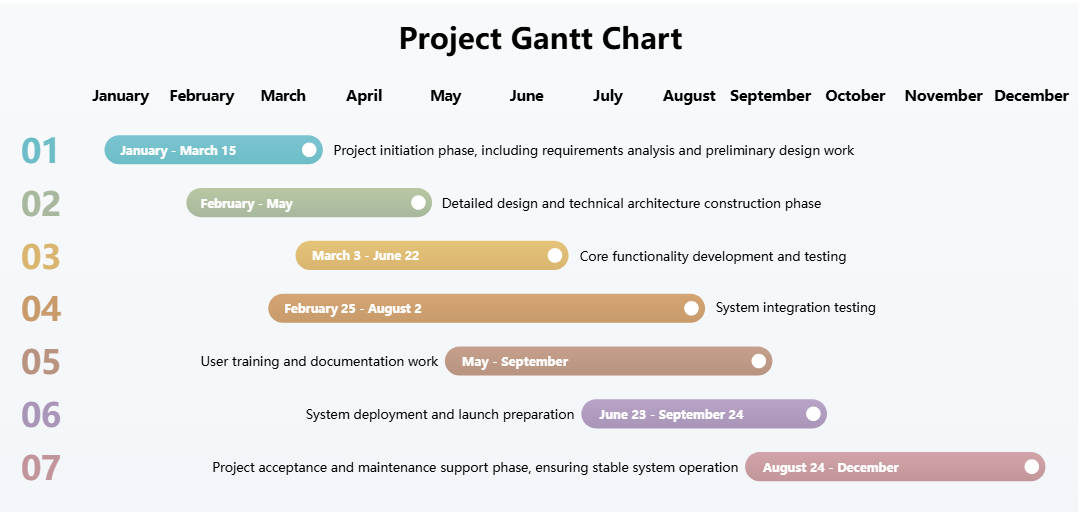
About this Annual IT Project Gantt Chart template
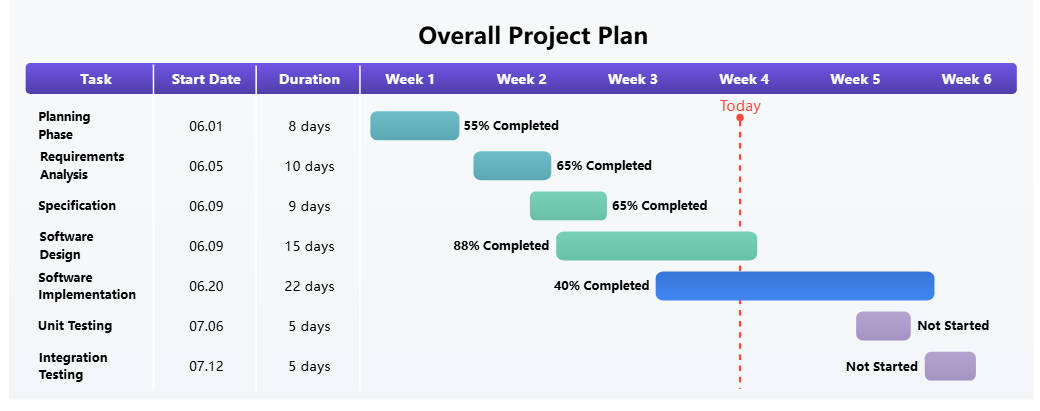
This template provides a comprehensive view of a yearly IT project lifecycle. It allows teams to track progress across development, testing, and deployment phases. It is perfect for project managers seeking a visual roadmap for technical milestones.
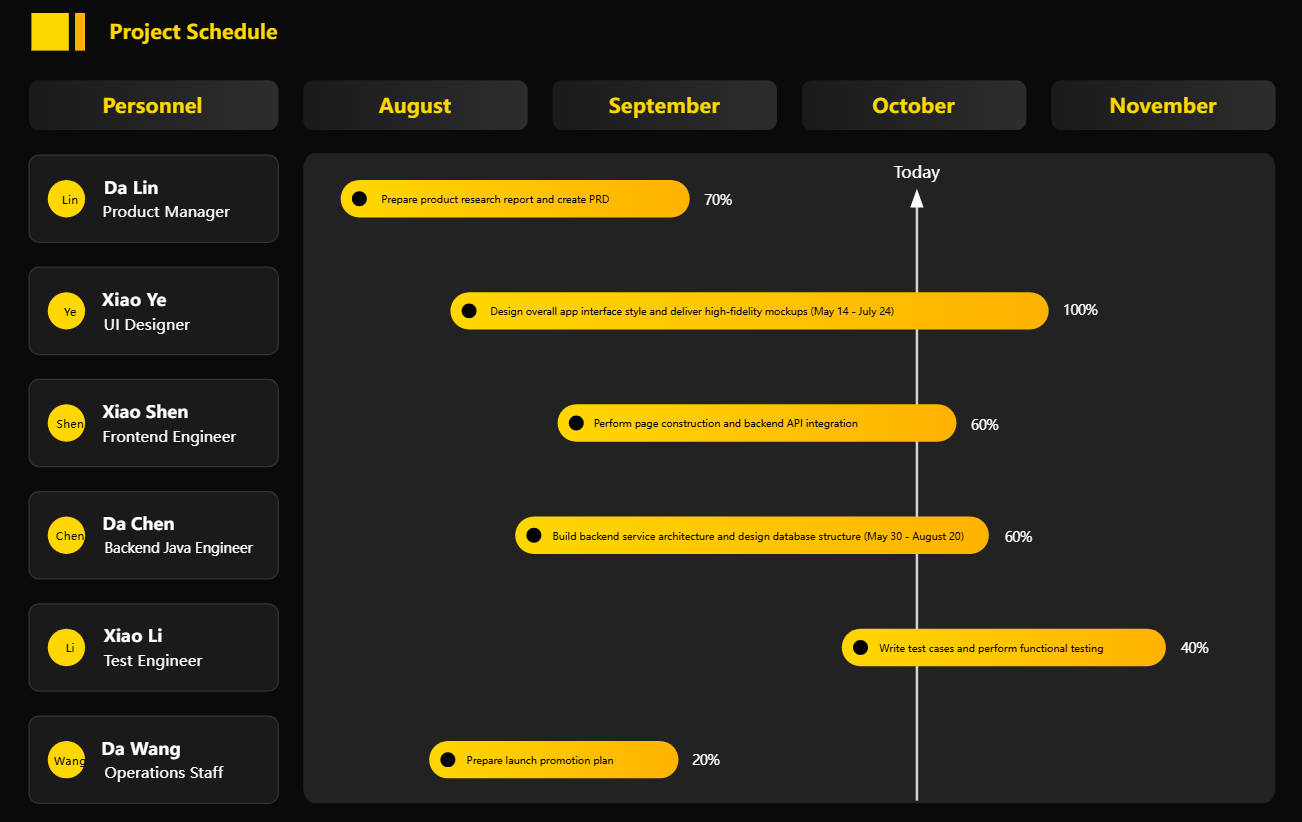
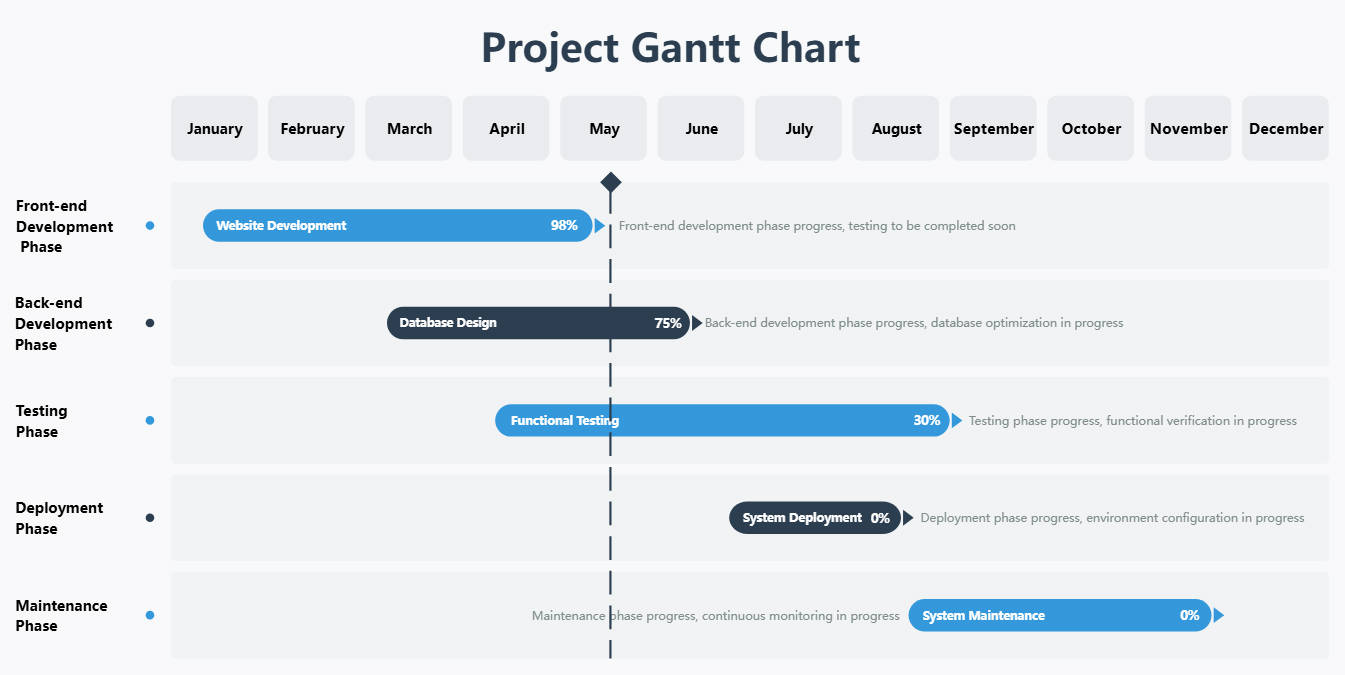
Front-end Development Phase
This section focuses on user interface and website development. It spans from January to May, showing high completion rates. It ensures that the visual elements of the project are tested and finalized before launch.
- Website Development (98% Complete)
- Front-end testing status
- UI/UX finalization
Back-end Development Phase
The back-end phase involves database design and server-side logic optimization. This stage runs concurrently with front-end tasks, peaking in April and June. It is critical for establishing a robust and secure technical infrastructure.
- Database Design (75% Complete)
- Database optimization
- Server-side logic integration
Testing Phase
Quality assurance is the priority during this phase, starting in April and extending through October. It focuses on functional verification to catch bugs early. This ensures the system operates correctly under various simulated conditions.
- Functional Testing (30% Complete)
- Functional verification
- Bug tracking and resolution
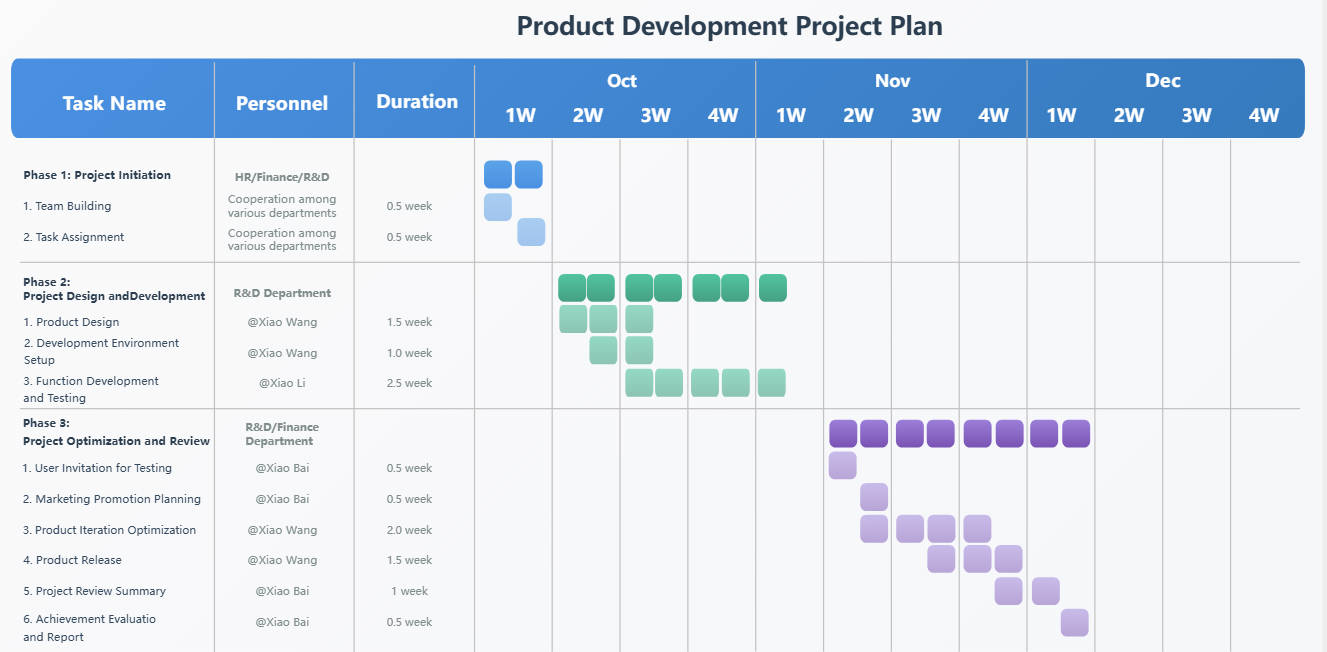
Deployment Phase
This phase covers the transition from development to live environments. Starting in July, it focuses on environment configuration and system stability. Proper deployment planning minimizes downtime and ensures a smooth user experience upon release.
- System Deployment (0% Complete)
- Environment configuration
- Release management
Maintenance Phase
Maintenance begins in September and continues through the end of the year. This phase involves continuous monitoring and system updates. It is essential for long-term stability and addressing any issues that arise after deployment.
- System Maintenance (0% Complete)
- Continuous monitoring
- Post-launch updates