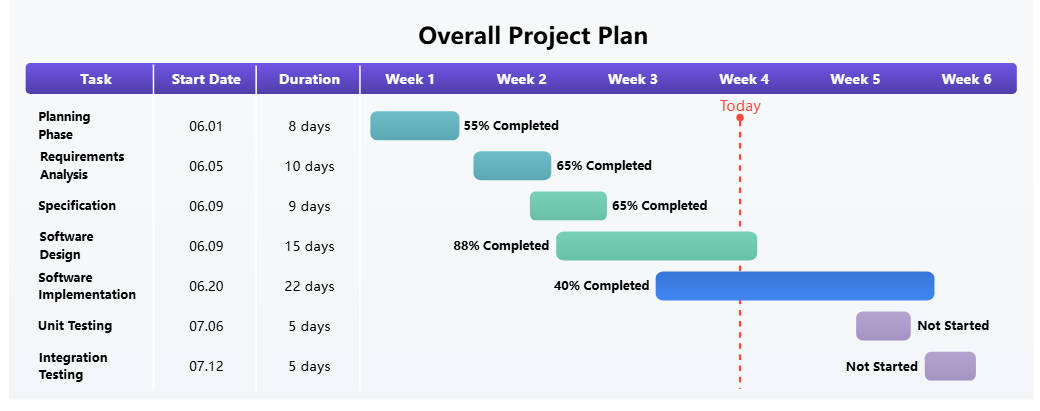
About this project plan weekly Gantt chart template
This template provides a clear visual overview of a software development project. It tracks seven key phases over a six-week period. Use it to monitor progress percentages, task start dates, and total durations for effective project management.
Project Planning and Requirements
The initial stages focus on defining the project scope and analyzing user needs. These tasks lay the foundation for all future work. Success here ensures the team understands the goals before moving into technical development.
- Planning Phase: 8 days duration, 55% complete.
- Requirements Analysis: 10 days duration, 65% complete.
Specification and Software Design
This section outlines how the software will function and how it is built. These tasks overlap to ensure technical designs align with functional requirements. High completion rates here indicate a strong transition into the coding phase.
- Specification: 9 days duration, 65% complete.
- Software Design: 15 days duration, 88% complete.
Software Implementation
Implementation is the longest phase in this project plan. It involves the actual coding and development work based on the previous designs. Monitoring this phase closely is vital as it directly impacts the testing schedule and final delivery.
- Software Implementation: 22 days duration, 40% complete.
Testing and Quality Assurance
The final phases ensure the software is reliable and bug-free. Testing starts after implementation reaches a specific milestone. These tasks have not yet begun, as indicated by the current project status marker in week four.
- Unit Testing: 5 days duration, Not Started.
- Integration Testing: 5 days duration, Not Started.