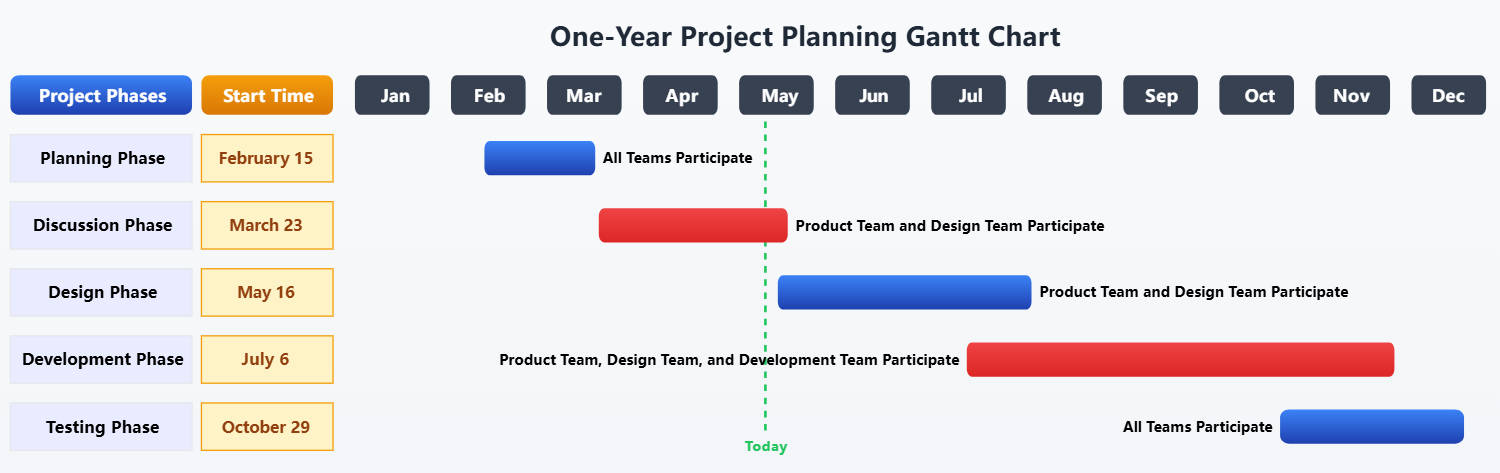
About this Product R&D Project Gantt Chart template
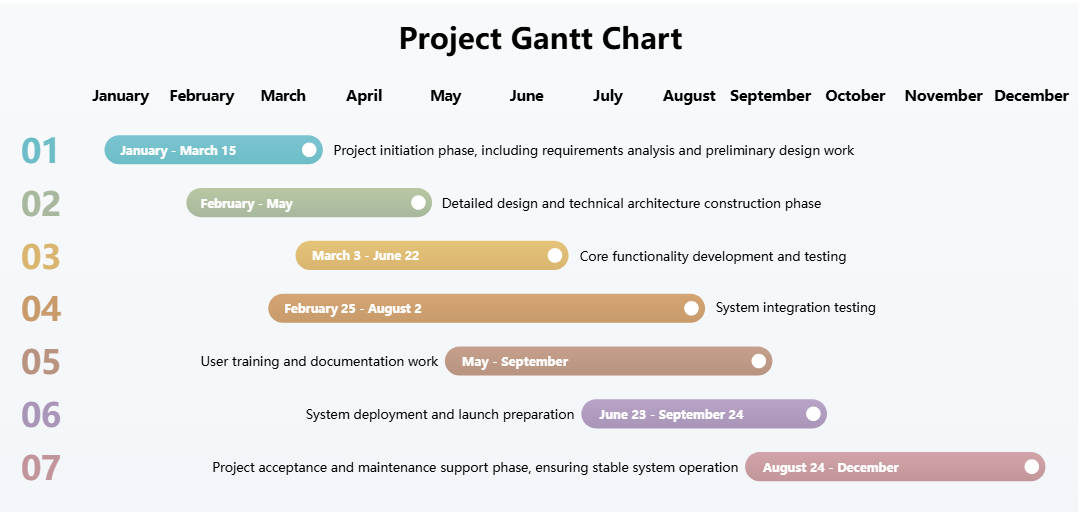
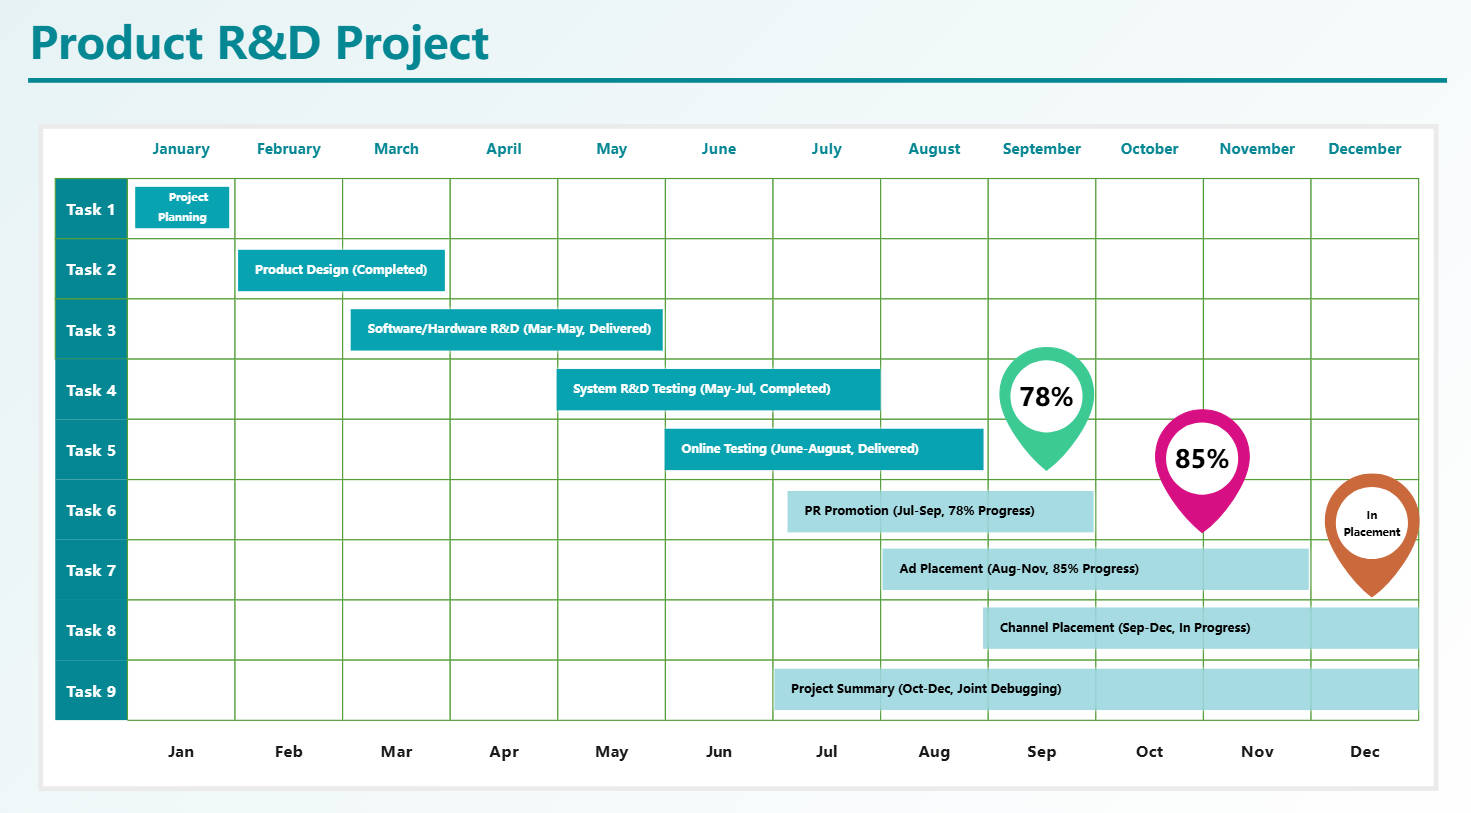
This annual project schedule planning template offers a visual roadmap for development cycles. It covers four quarters, tracking everything from initial launch preparation to final data analysis. Use it to keep cross-functional teams aligned on technical and marketing milestones.
Preliminary Planning and Research Phase
The initial phase focuses on laying a solid foundation for the project. Teams conduct extensive market research and preliminary planning to ensure the product meets consumer needs. Completing these tasks early prevents costly pivots later in the cycle.
- Preliminary Preparation and Launch (100% Progress)
- Market Research Implementation (100% Progress)
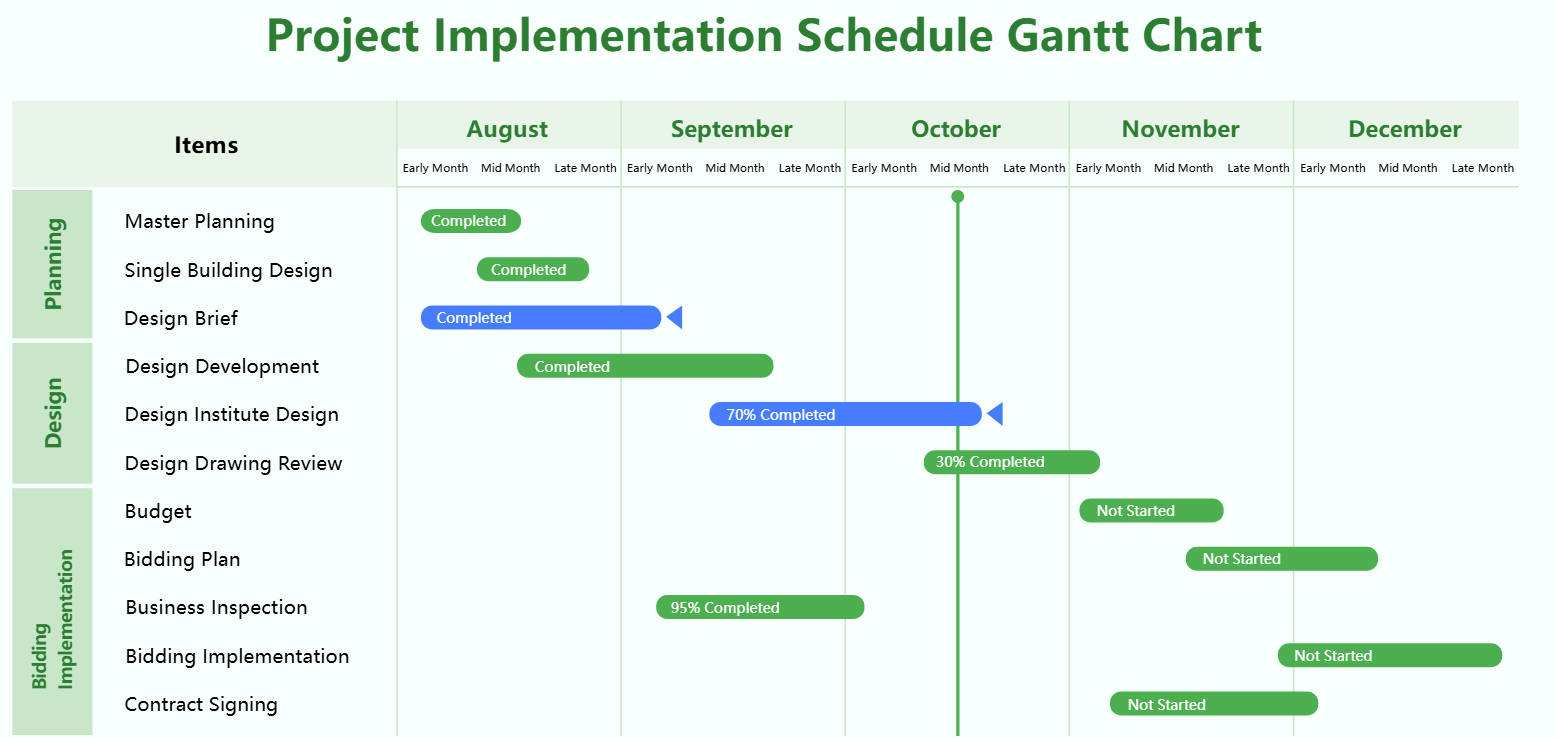
Design and Technical Development Phase
This stage involves turning concepts into reality through technical R&D and prototyping. Engineers focus on core technologies while testing and optimizing results. It is the most intensive part of the cycle, requiring precise tracking of technical milestones.
- Product Design Planning (100% Progress)
- Technology R&D Advancement (90% Progress)
- Testing Optimization and Adjustment (70% Progress)
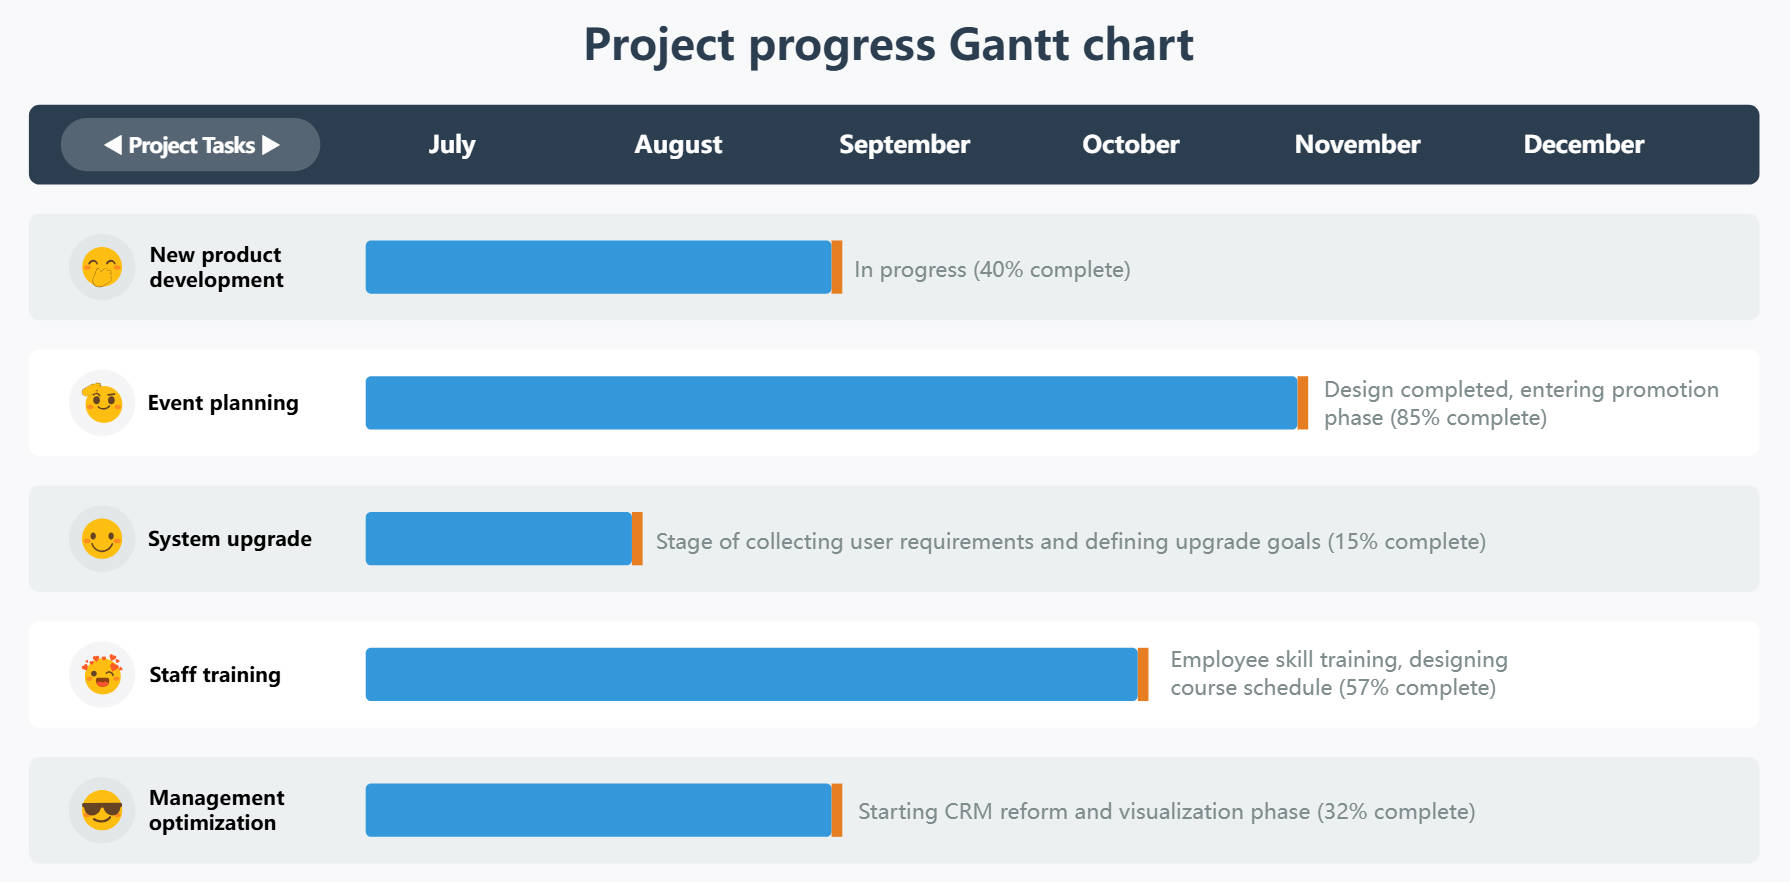
Market Entry and Strategy Phase
As technical work nears completion, focus shifts toward market entry and sales. Teams formulate marketing strategies and explore new distribution channels. Building customer relationships during this phase ensures a smoother transition from development to active commercial sales.
- Marketing Strategy Formulation (60% Progress)
- Channel Expansion and Development (80% Progress)
- Customer Relationship Maintenance (25% Progress)
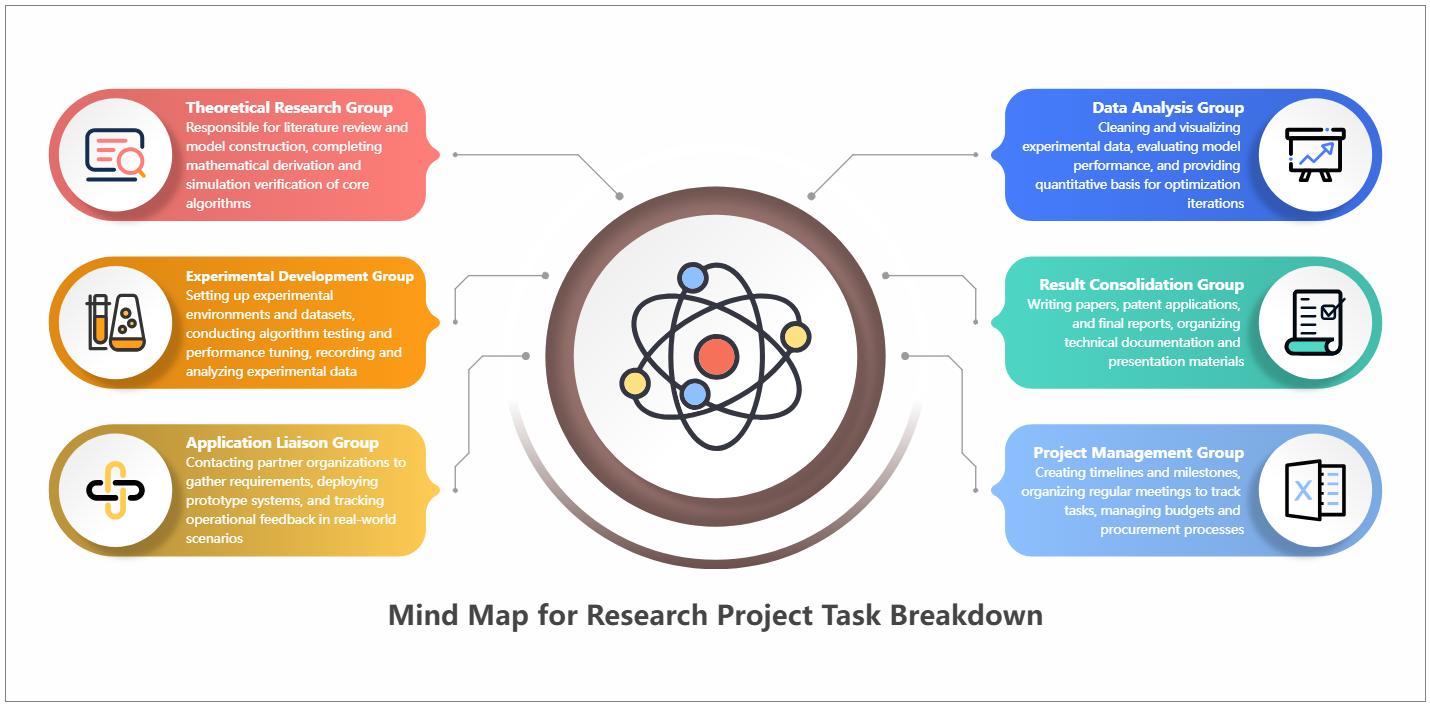
Evaluation and Future Planning Phase
The final phase involves measuring the success of the R&D cycle through data analysis. Teams evaluate performance results to prepare for the next version or project. This ensures continuous improvement and better preparation for future product development cycles.
- Data Analysis and Evaluation (10% Progress)
- Follow-up Planning and Preparation (0% Progress)