About Causal Loop Diagram Template
Map cause-and-effect relationships, label positive and negative links, and identify reinforcing or balancing feedback with an editable causal loop diagram.
What This Causal Loop Diagram Shows
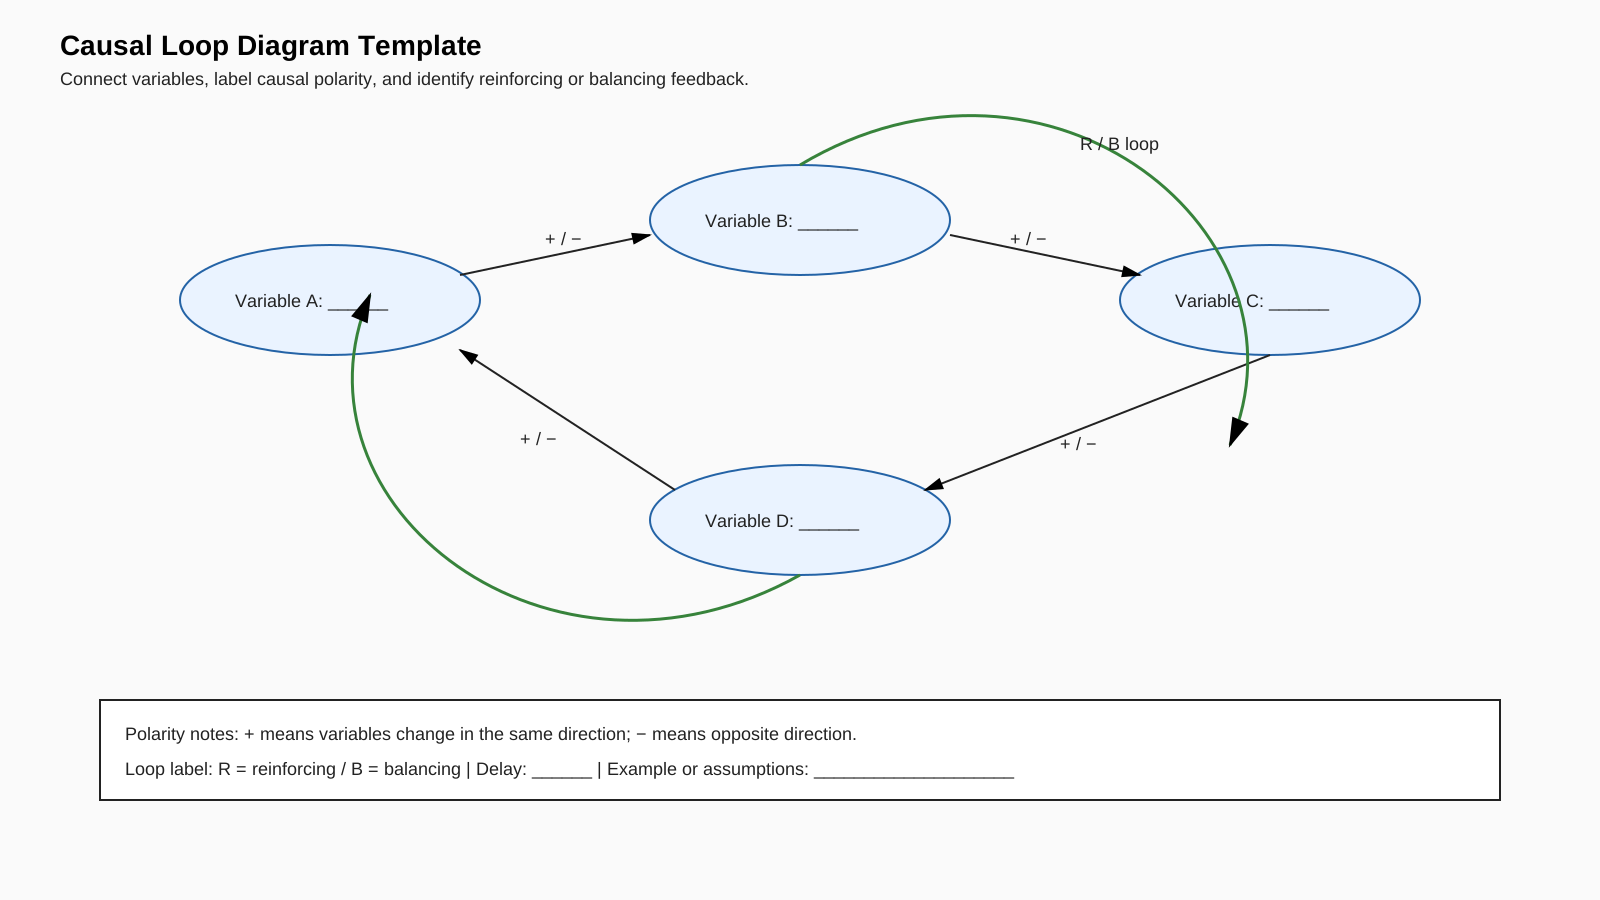
The template places four variable nodes in a closed system. Directional arrows show which variable influences the next, while blank polarity labels let you mark each relationship as positive or negative. A separate loop label records whether the completed feedback loop is reinforcing (R) or balancing (B).
How to Complete the Template
Replace Variable A through Variable D with measurable factors in the system you want to study. Follow each arrow and add a plus sign when the variables tend to move in the same direction, or a minus sign when they tend to move in opposite directions. Count the negative links around the loop: an even number indicates reinforcing behavior, while an odd number indicates balancing behavior. Use the notes area to record delays and assumptions.
Where It Is Useful
Use the diagram to explore recurring behavior in operations, product adoption, staffing, customer experience, sustainability, or policy discussions. It is most useful when a team needs to discuss how several factors interact over time rather than list a simple sequence of steps.
Review Before Sharing
Check that every arrow expresses a direct causal hypothesis, that polarity describes direction rather than desirability, and that the R or B label agrees with the link polarities. A causal loop diagram is a model for discussion; it does not prove causation or calculate the strength of a relationship.
FAQs about this Template
- What is a causal loop diagram template?
It is an editable canvas for mapping variables, directional causal links, link polarity, and feedback loops in a system.
- What do plus and minus signs mean in a causal loop diagram?
A plus sign means two linked variables tend to change in the same direction. A minus sign means they tend to change in opposite directions, with other conditions held constant.
- What is the difference between a reinforcing and balancing loop?
A reinforcing loop amplifies change, while a balancing loop counteracts change and tends to move a system toward a limit or target.
- Can this template prove that one variable causes another?
No. The arrows document causal hypotheses for analysis and discussion. Evidence is still needed to validate the relationships.

 (AI & Web)