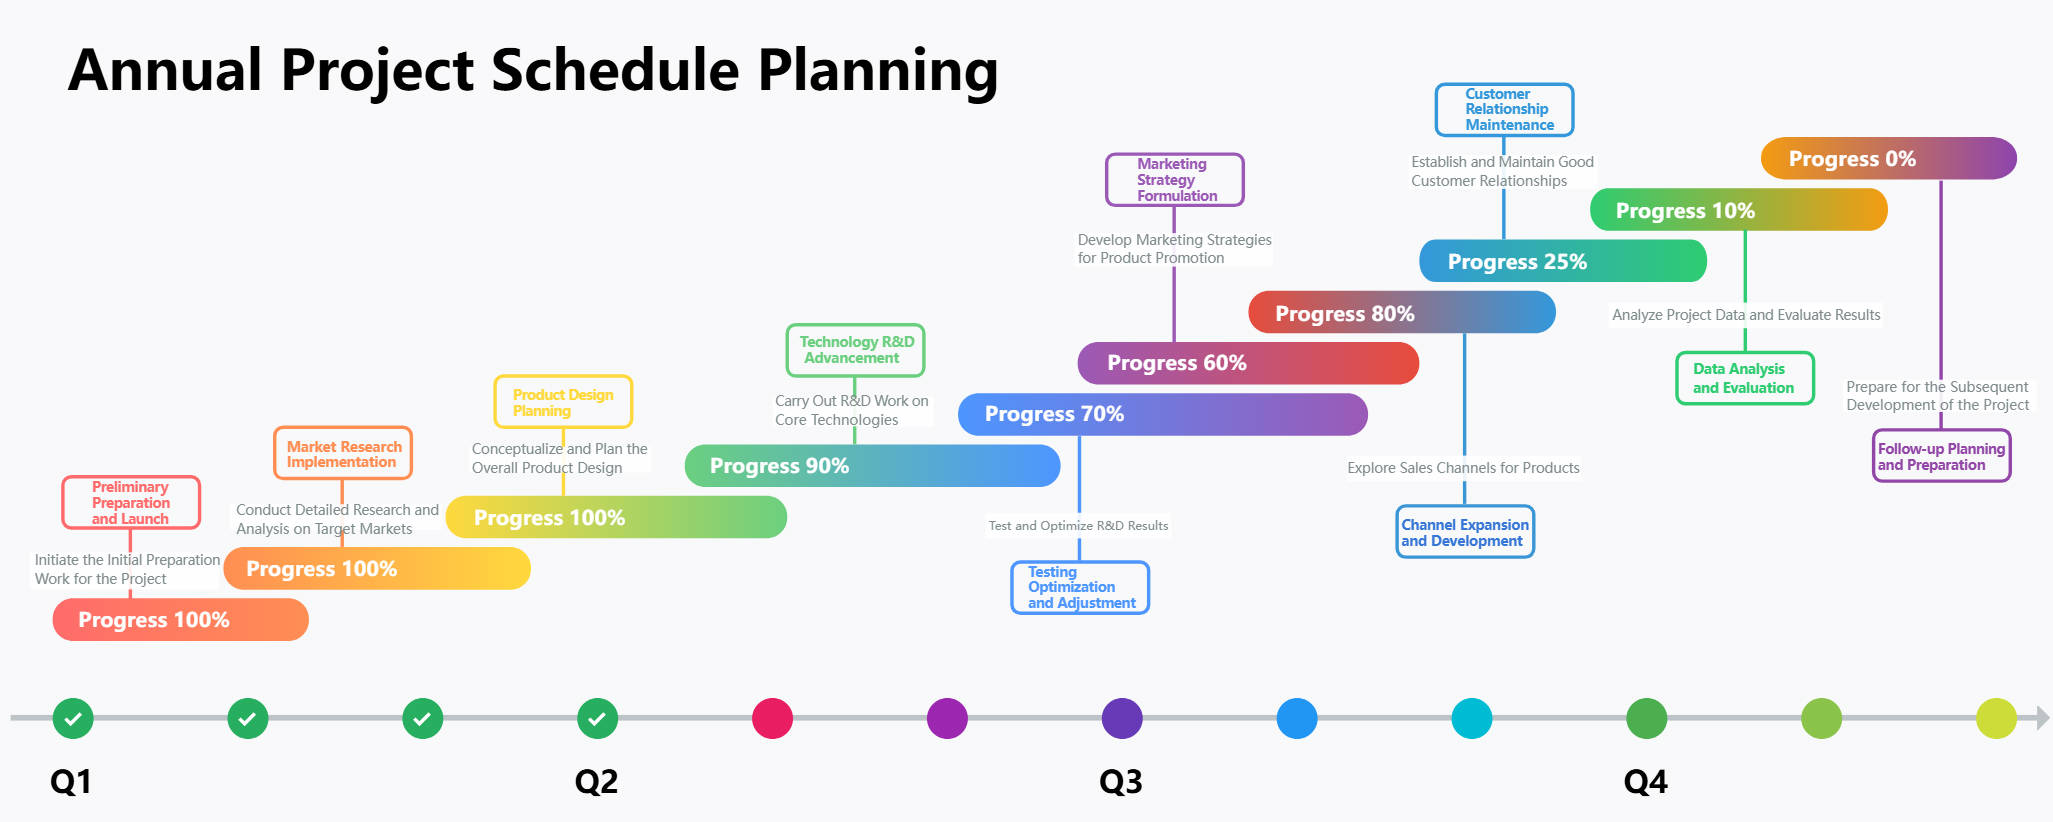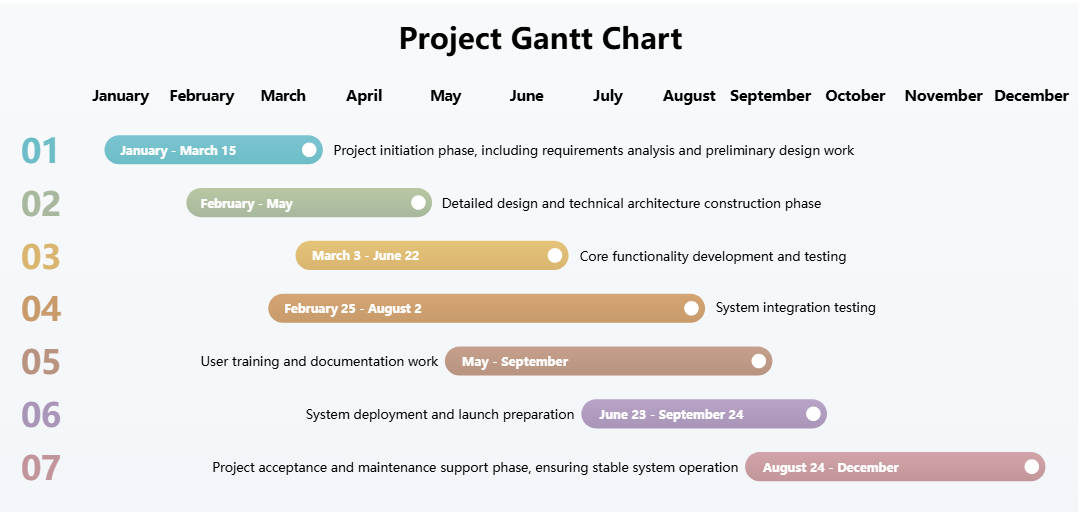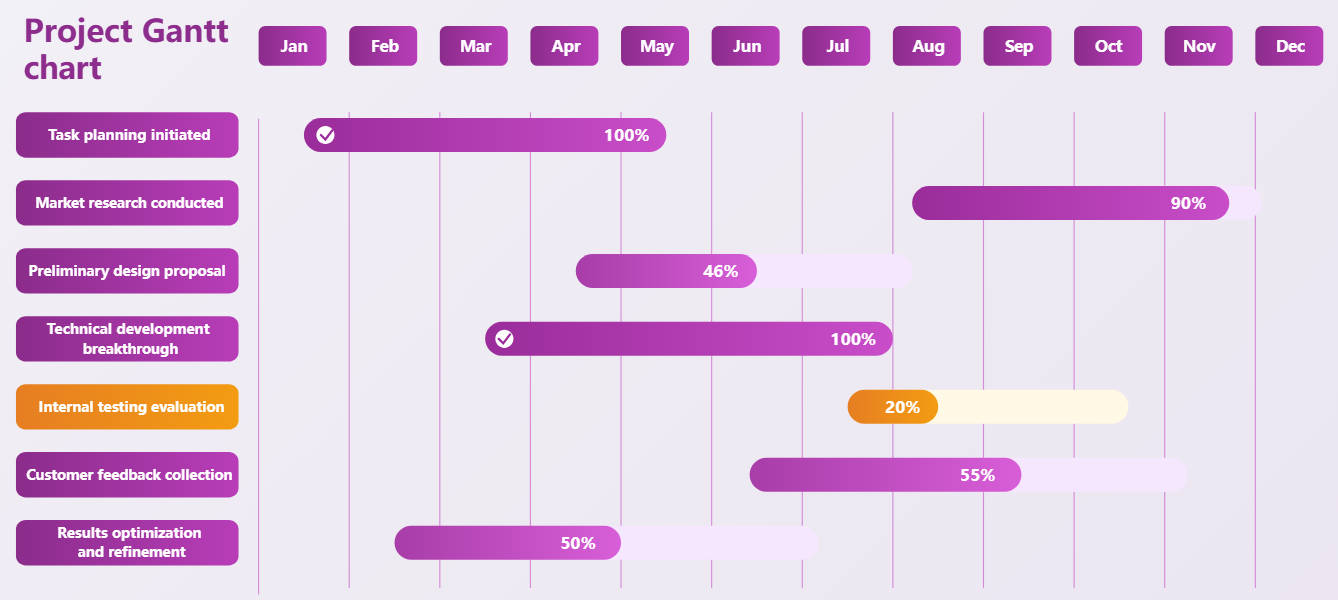
About this Yearly Project Gantt Chart template
This template provides a comprehensive overview of project tasks spanning a full calendar year. It allows teams to visualize progress percentages and timelines for multiple concurrent activities, ensuring better project management and timely delivery.
Task Planning and Initiation
This section focuses on the initial phase of the project cycle. It tracks the start of planning activities and their successful completion over several months to ensure a solid foundation for upcoming work.
- Task planning initiated (100% complete)
- Spans from January to May
- Initial project kickoff milestone
Development and Market Research
This node tracks critical technical breakthroughs and research efforts. It highlights the overlap between technical execution and market analysis, which is vital for creating products that meet actual user needs and industry standards.
- Technical development breakthrough (100% complete)
- Market research conducted (90% complete)
- Design proposal in progress
Evaluation and Feedback
Monitoring testing phases and customer responses is essential for quality control. This section illustrates how feedback is collected and evaluated in real-time to refine the final output before the project closes for the year.
- Internal testing evaluation (20% complete)
- Customer feedback collection (55% complete)
- Results optimization and refinement