About Spaghetti Diagram Template
Trace the movement of people, materials, information, or products and record improvement opportunities with an editable spaghetti diagram.
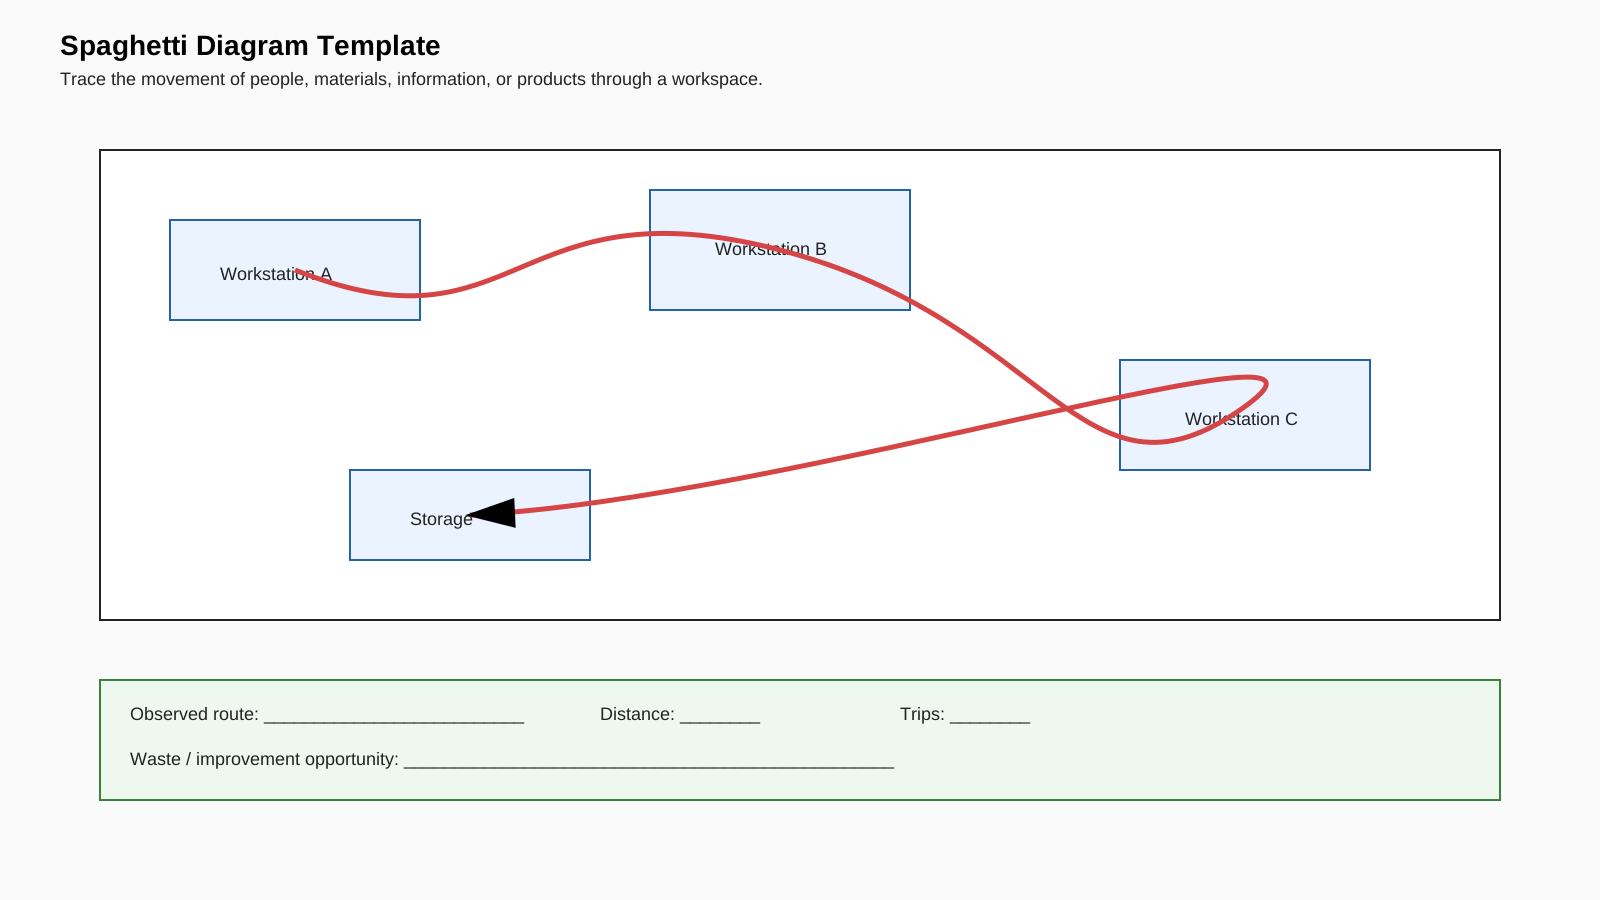
What This Spaghetti Diagram Shows
The workspace contains three workstations and a storage area connected by an observed route. The route is deliberately easy to replace, while the metrics panel records total distance, number of trips, and the waste or improvement opportunity identified during observation.
How to Use the Template
Replace the example blocks with the real layout and keep their relative positions accurate. Choose one subject, such as an operator, document, component, or customer. Observe a defined period and draw each movement in sequence. Record distance and trips using one consistent unit, then create a second version for the proposed layout.
How to Interpret the Result
Repeated crossings, long returns to storage, congestion, and backtracking may reveal unnecessary motion or transportation. The diagram shows where to investigate; it does not by itself explain why the movement occurs. Discuss safety, quality, staffing, equipment, and process constraints before changing the layout.
Review Before Sharing
State what was tracked, when the observation occurred, and whether the route represents one cycle or several. Compare current and proposed layouts at the same scale. Do not combine different people or materials into one path unless each route remains visually distinguishable.
FAQs about this Template
- What is a spaghetti diagram template?
It is a layout-based tool for tracing actual movement and identifying repeated travel, crossings, backtracking, and other potential waste.
- What can be tracked on a spaghetti diagram?
You can track people, materials, products, documents, information, or customers, provided the subject and observation period are defined.
- Does a spaghetti diagram show the cause of wasted movement?
No. It visualizes the route and helps focus investigation. Process constraints and root causes must still be examined.
- How should before-and-after spaghetti diagrams be compared?
Use the same layout scale, subject, observation period, and measurement units so changes in distance and trips are meaningful.

 (AI & Web)