About Value Stream Map Template
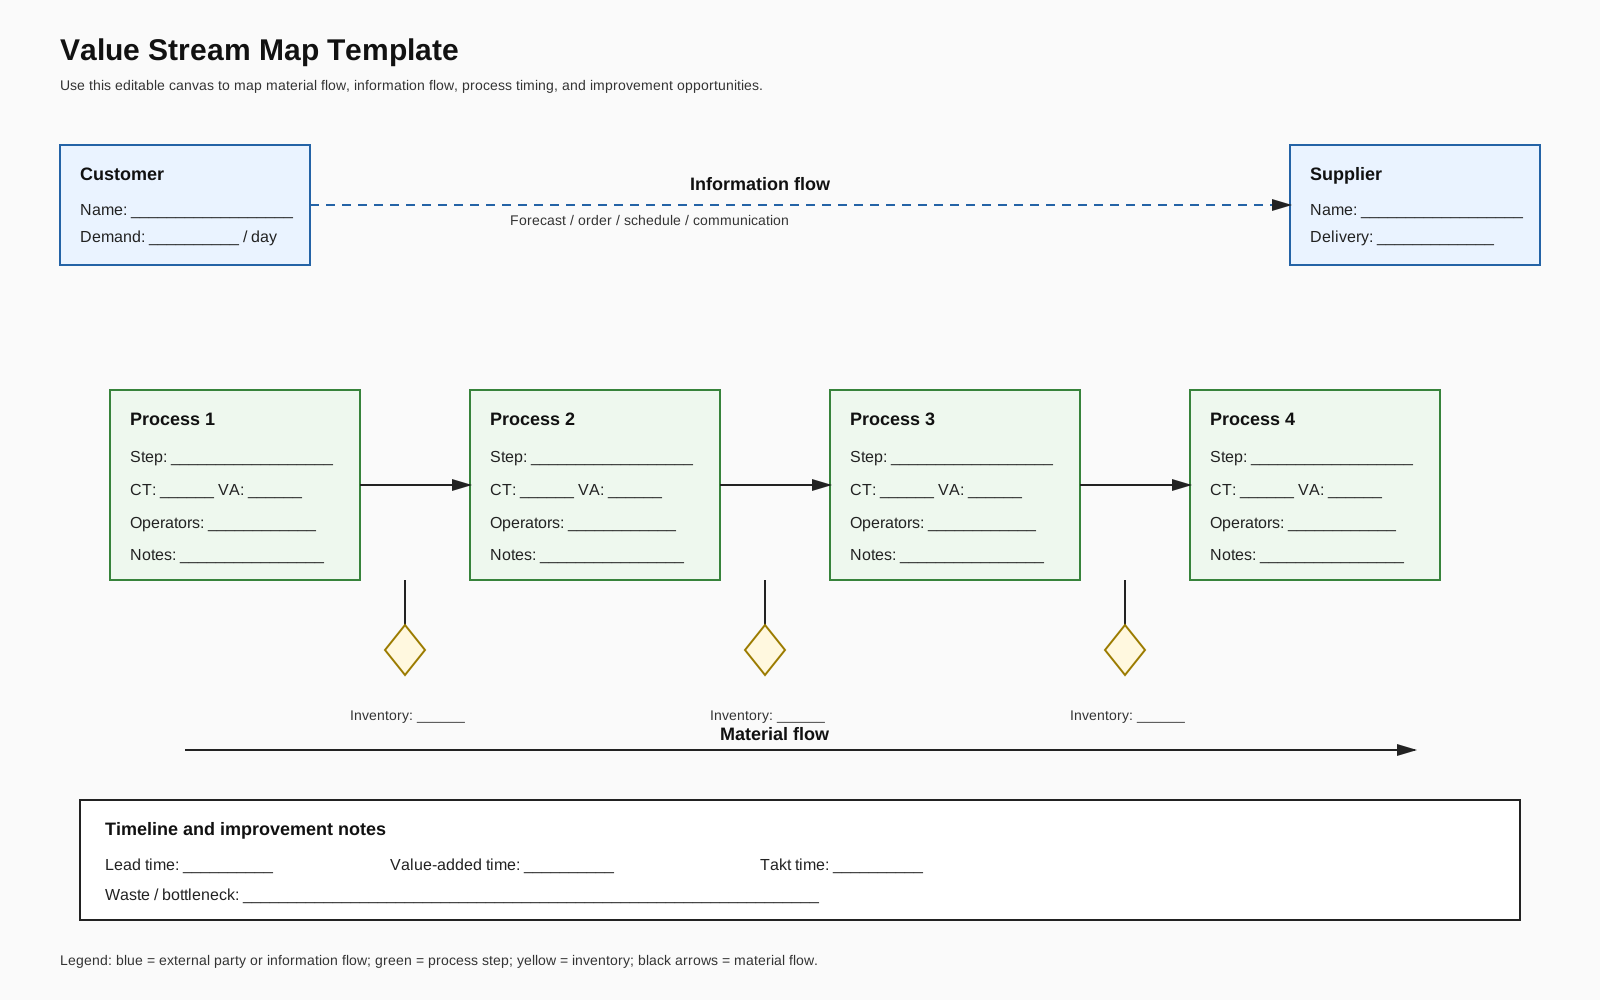
Map information flow, material flow, process timing, inventory, and improvement opportunities with an editable value stream map template.
What This Value Stream Map Includes
The template connects a supplier, customer, information flow, four process steps, inventory markers, material flow, and a timeline. Each process box includes fields for cycle time, value-added time, operators, and notes, while the bottom panel records lead time, takt time, and waste or bottlenecks.
How to Build the Current-State Map
Choose one product or service family and define the start and end of the value stream. Enter demand and delivery information, then add the major process steps in sequence. Record observed inventory and timing data using consistent units. Map how orders, forecasts, schedules, or other information trigger work. Calculate and review the timeline only after the underlying observations have been checked.
How to Use the Map for Improvement
Look for waiting, excess inventory, uneven flow, rework, long handoffs, and gaps between takt time and process capacity. Use the current-state map to agree on evidence, then create a separate future-state map. Keep assumptions visible so the team can distinguish measured data from proposed changes.
Review Before Sharing
Validate the map with people who perform and receive the work. Confirm the unit of time, demand period, inventory counts, and boundaries. This template is a simplified starting point; adapt symbols and data boxes to the conventions used by your team.
FAQs about this Template
- What is included in this value stream map template?
It includes supplier and customer fields, information flow, four process steps, inventory, material flow, timing data, and an improvement-notes area.
- What is the difference between cycle time, lead time, and takt time?
Cycle time is the time needed to complete a process cycle, lead time is the elapsed time across the defined stream, and takt time expresses the production pace required to meet demand.
- Should I map the current state or future state first?
Map the current state first so the future state is based on observed flow, delays, inventory, and constraints.
- Is a value stream map the same as a process map?
No. A process map emphasizes activity and decision sequence, while a value stream map also examines end-to-end flow, information, inventory, and time.
 (AI & Web)