


Power BI and Visio are two powerful business intelligence and data visualization tools from Microsoft. Integrating these tools can enhance data-driven insights and enable impactful data storytelling for businesses. This article will provide an overview of Power BI and Visio, discuss the role of integration tools, explain the connection between the tools, outline integration strategies, and explore EdrawMax as an alternative for seamless Power BI and diagramming capabilities.
In this article
Part 1. Overview of Power BI and Visio
Power BI is a business analytics service that provides interactive visualizations, AI-driven insights, and real-time dashboards by connecting to data sources. Key capabilities include data preparation, modeling, and, visualization.
Visio is a diagramming tool that enables the creation of flowcharts, diagrams, data visualizations, and other graphics. It simplifies complex information through visuals.
While Power BI excels at aggregating data for analysis, Visio helps supplement analysis with diagrams and process flows. Integrating these complementary tools can take data insights and analytics to the next level.
Part 2. Role of Tools like Power BI Visio in Visualisation
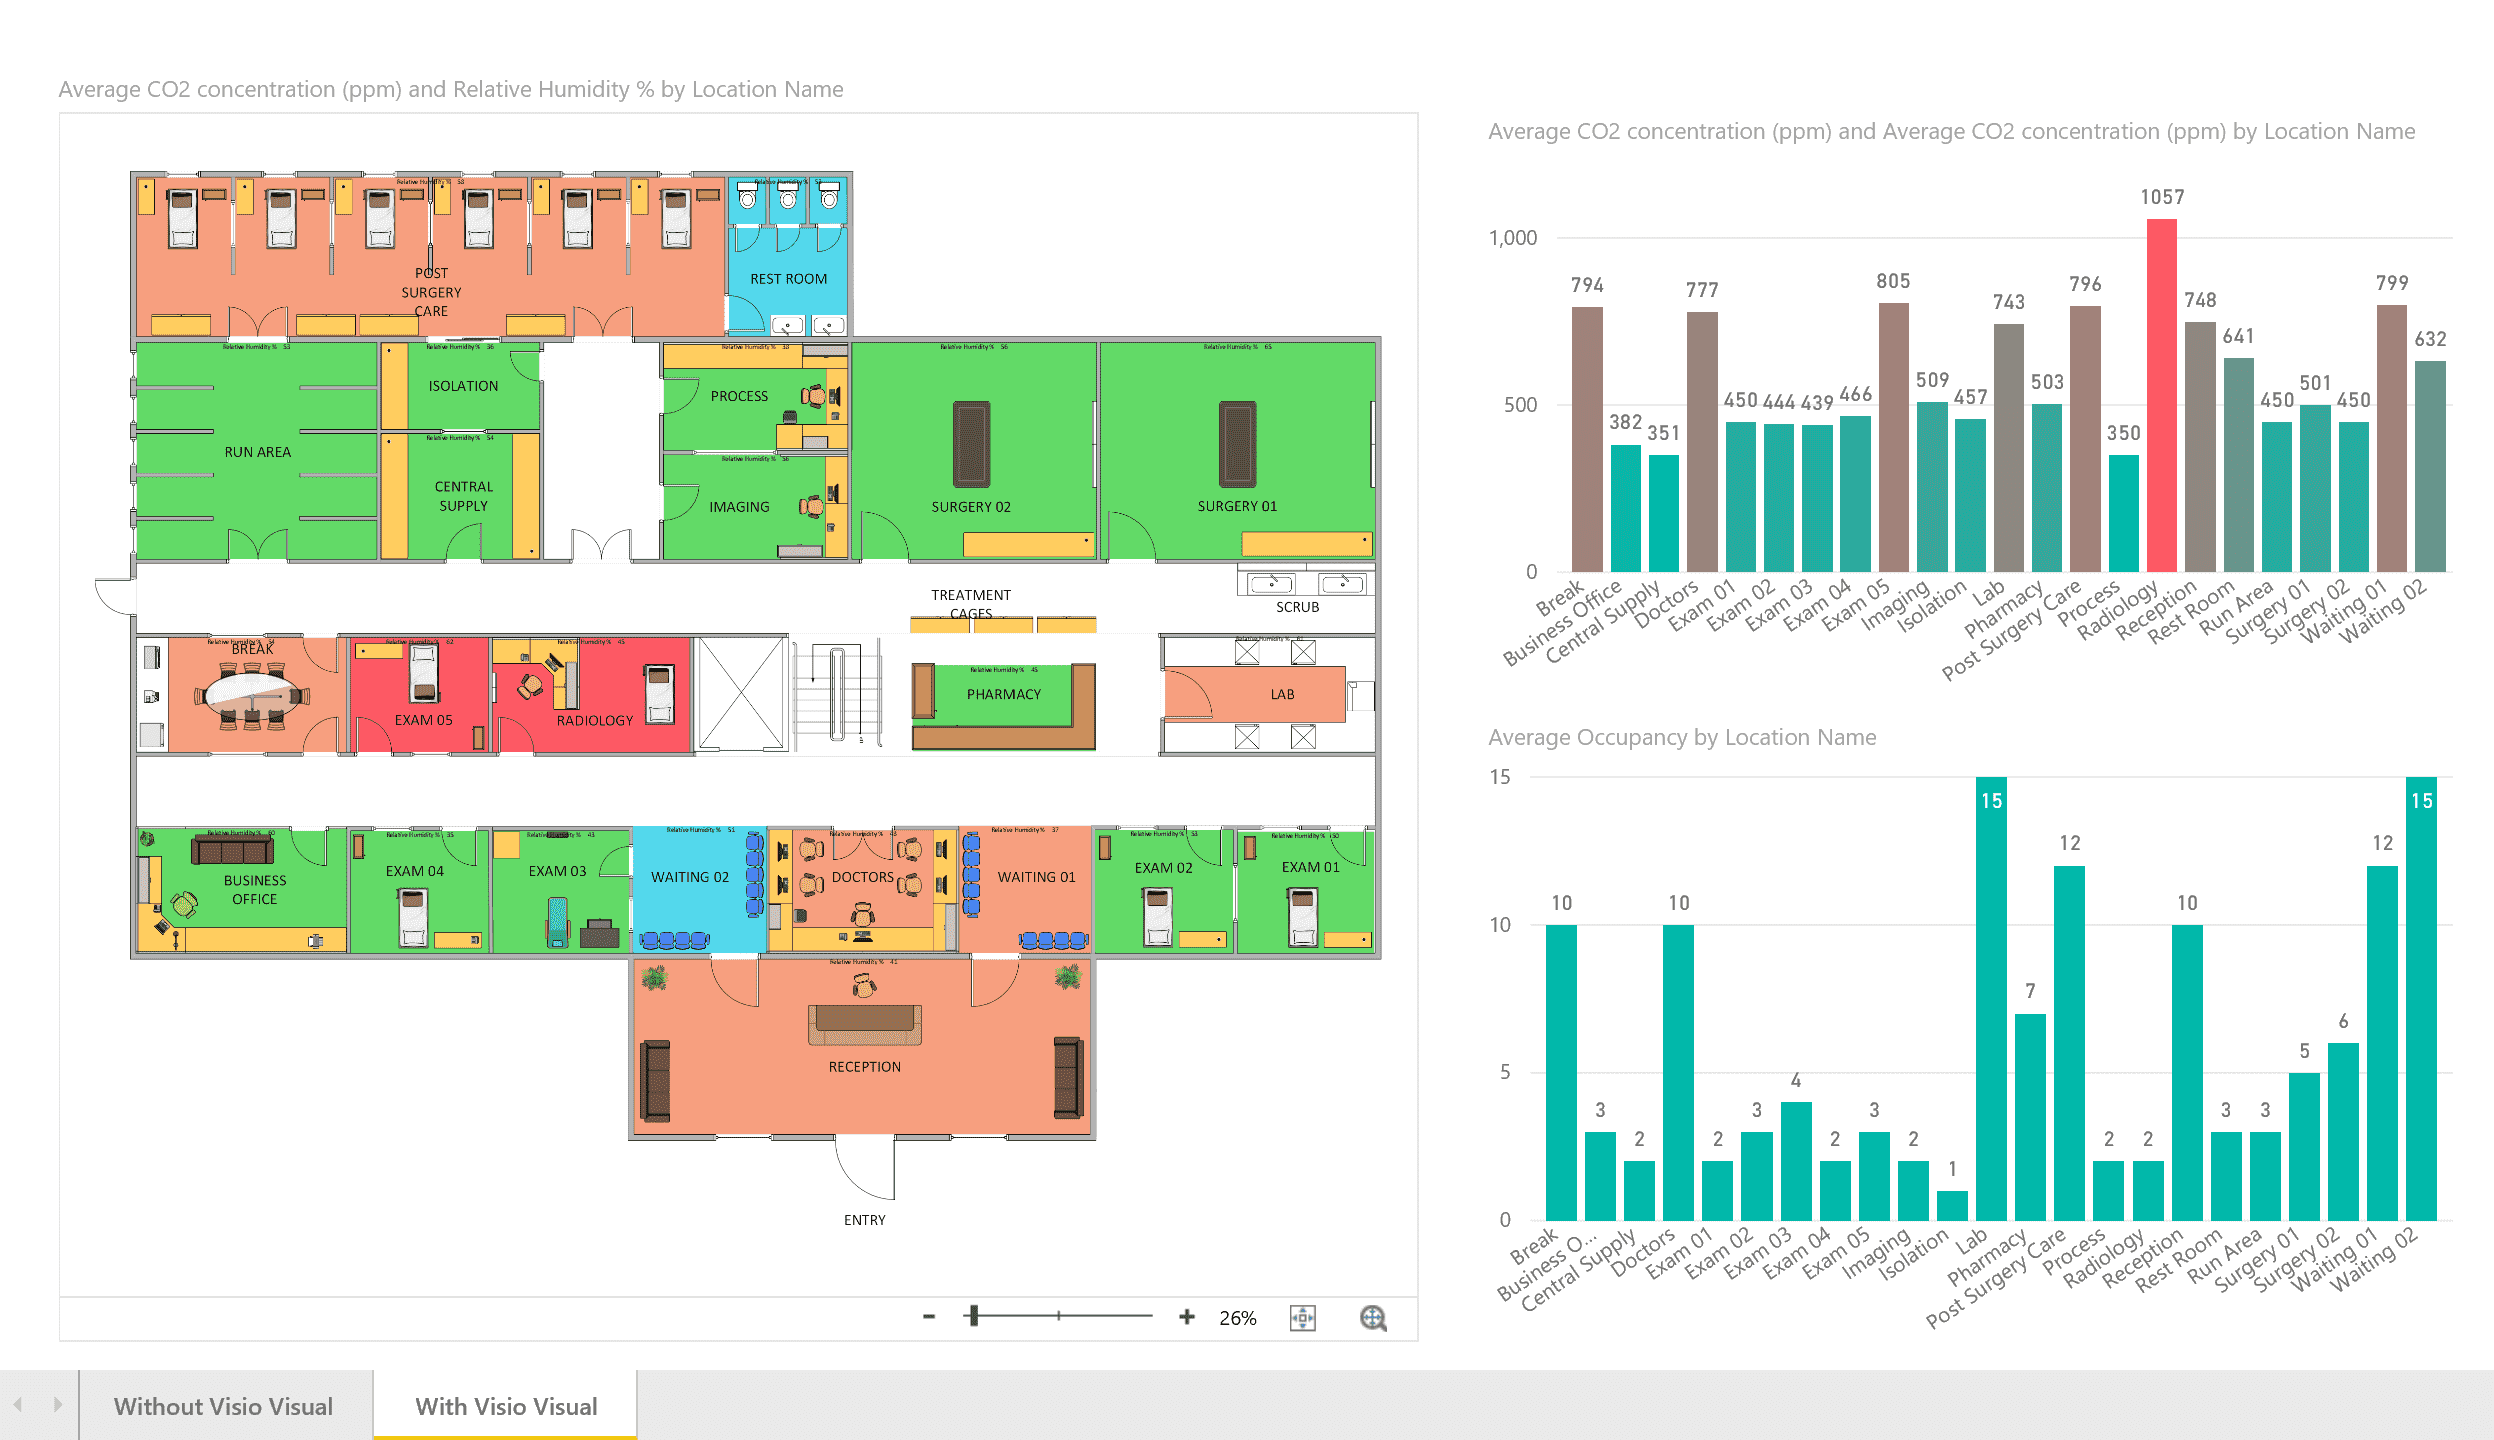
While Power BI provides a wide array of built-in visualization styles, sometimes custom visuals are needed to fully convey key data insights. This is where Visio comes in. The ability to design custom diagrams and link them to Power BI reports enhances data storytelling.
Tools like Power BI Visio allow the establishment of this integration seamlessly. It provides a live connection between Visio diagrams and Power BI reports. This enables the creation of diagram overlays on reports as well as linking data points between both tools.
Having this linked integration makes it easier to convey concepts and insights through professional data visualizations. Complex data stories can be told more visually and engagingly for the intended audience.
Power BI and Visio integration enable bringing the analytical prowess of Power BI together with the data visualization capabilities of Visio. Some key connections include:
- Live Visio diagrams can be overlaid on Power BI reports for greater context.
- Data points in Power BI reports can be linked and synced with Shapes and diagrams in Visio.
- Changes to data in Power BI get automatically reflected in linked Visio diagrams.
- Visio diagrams can be refreshed just like ordinary Power BI visualizations allowing flexibility.
- No need for manual work to update diagrams when data gets updated. The integration handles it seamlessly.
- Custom visuals help convey insights better to technical and non-technical audiences alike.
- Streamlines data visualization workloads for BI professionals allowing quicker turnaround.
The integrated solution bridges the gap between raw data and actionable business insights.
Part 3. Step-by-step guide on integrating Power BI with Visio
Here is a step-by-step guide to integrating Visio diagrams into Power BI reports:
- Open the Visio file containing the required diagram or process flow.
- Ensure data linking is correctly set up between Visio shapes and data. Save the Visio file.
- Go to Power BI Desktop and import the Visio file.
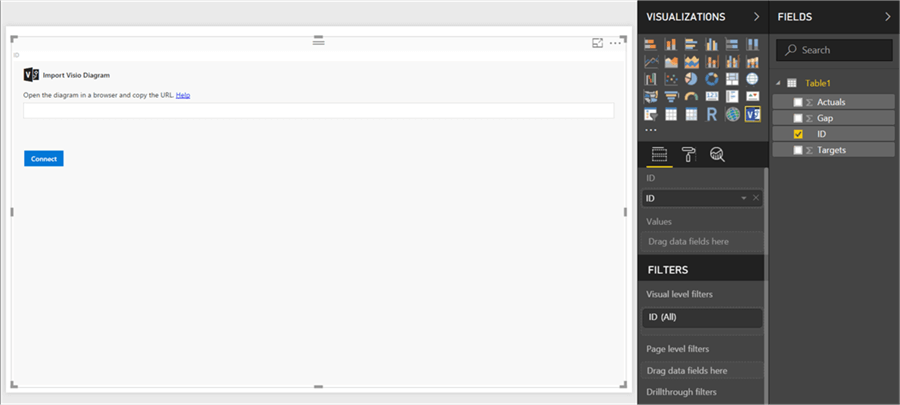
- The Visio diagram will be visible in the Power BI file. Drag it into the report canvas.
- Resize and position the diagram as needed in the report.
- Right-click the diagram and select ‘Activate’. This will link the Visio data.
- When Visio data changes, the linked diagram in Power BI will automatically update.
- Repeat steps for other required Visio files and diagrams.
- Publish the Power BI report as usual once all required diagrams are integrated.
With these steps, Visio diagrams can be seamlessly integrated into Power BI reports using connections between shape data and the Power BI dataset.
Part 4. Creating a DFD Using EdrawMax Easily
While Power BI and Visio integration works well, there are limitations in shape designs and a lack of advanced diagramming features within Visio. This is where EdrawMax comes in as a powerful alternative for both Power BI visuals and diagramming.
EdrawMax provides a complete diagramming toolset with thousands of pre-made shape designs across all major diagram types. Some key advantages over Visio include:
- A vast library of stylish shapes of all categories.
- Advanced customization of shapes with color, effects, formatting, etc.
- Numerous diagram types from flowcharts to org charts and floor plans.
- Easy visual integration with Power BI for live diagrams.
- Link diagram data points with Power BI seamlessly.
- Streamlined diagram design experience for faster creation.
- Cost-effective pricing without subscription fees.
- Excellent technical support.
With EdrawMax, BI professionals and business users get an integrated diagramming and reporting solution that out-classes what Visio offers.
Let's go through how to easily create a Data Flow Diagram (DFD) visual within EdrawMax and integrate it with Power BI reports:
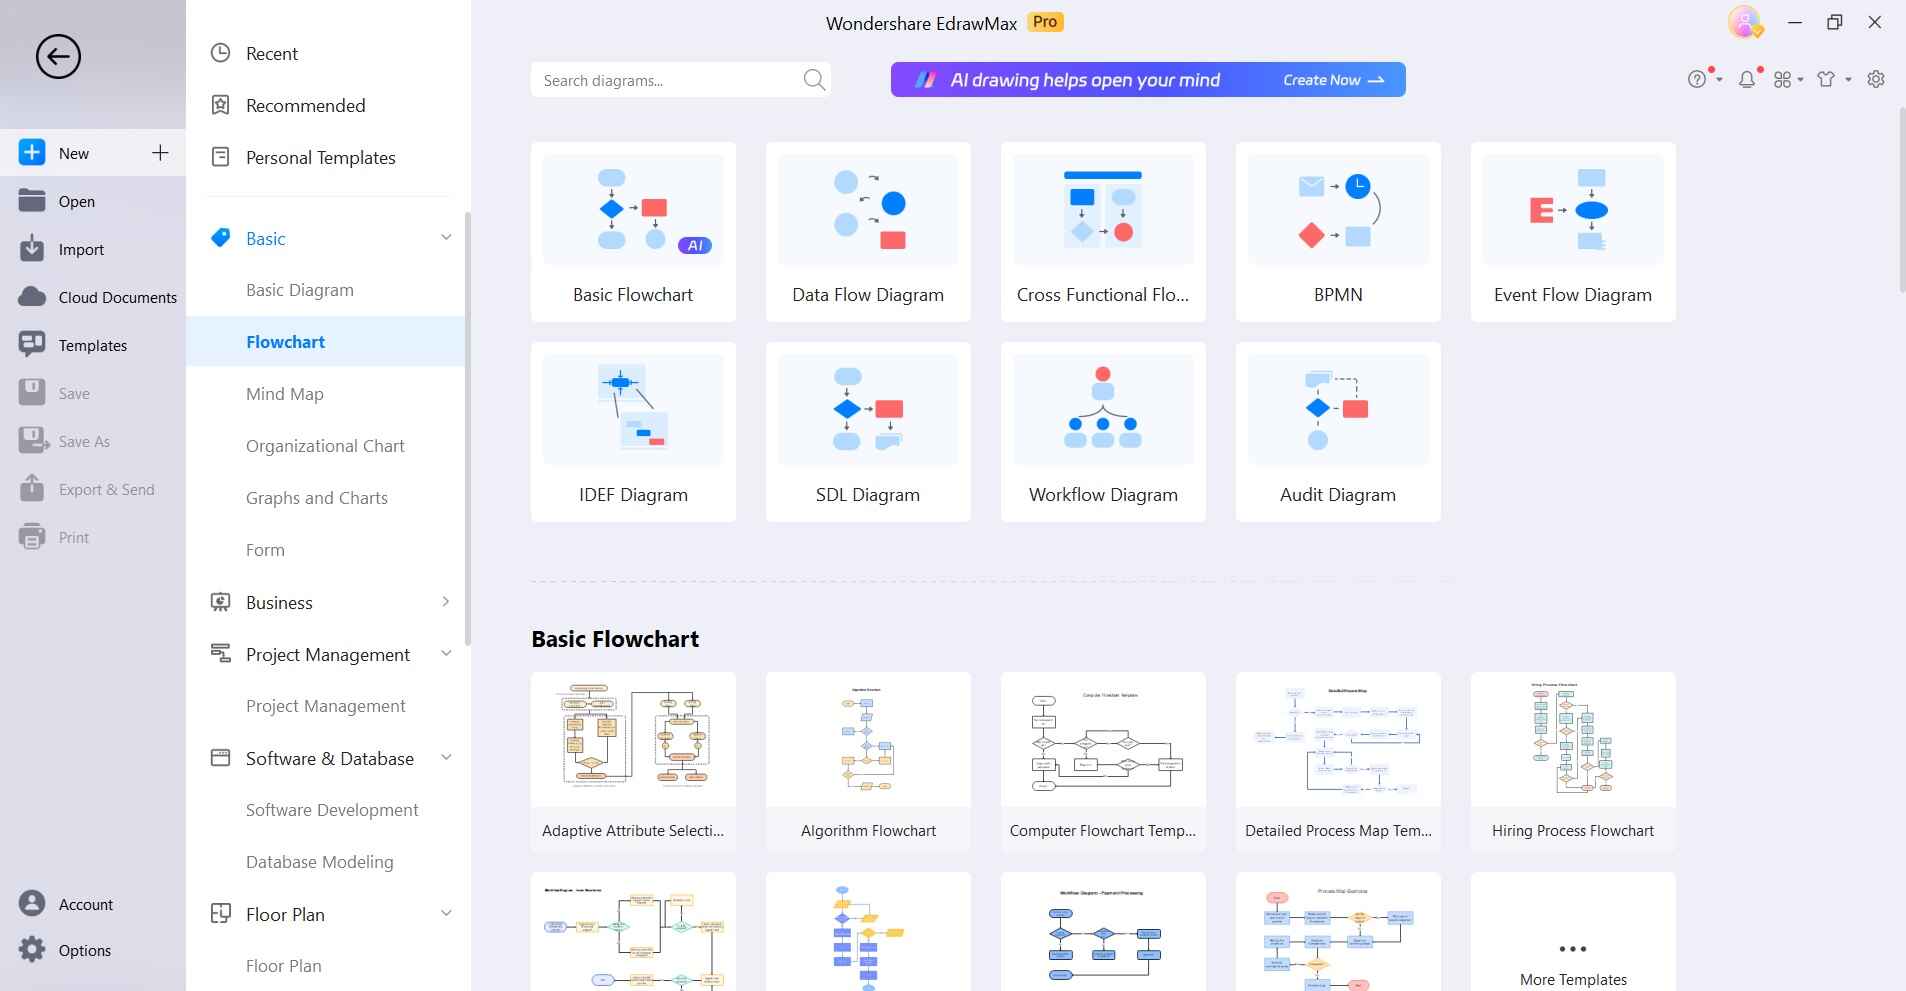
Step 1: Download and install EdrawMax on your PC. Open EdrawMax and select New -> Flowchart -> Data Flow Diagram
Step 2: Drag and drop DFD shapes like processes, data stores, external entities, etc from the toolbar. Connect shapes with connectors showing data flows.
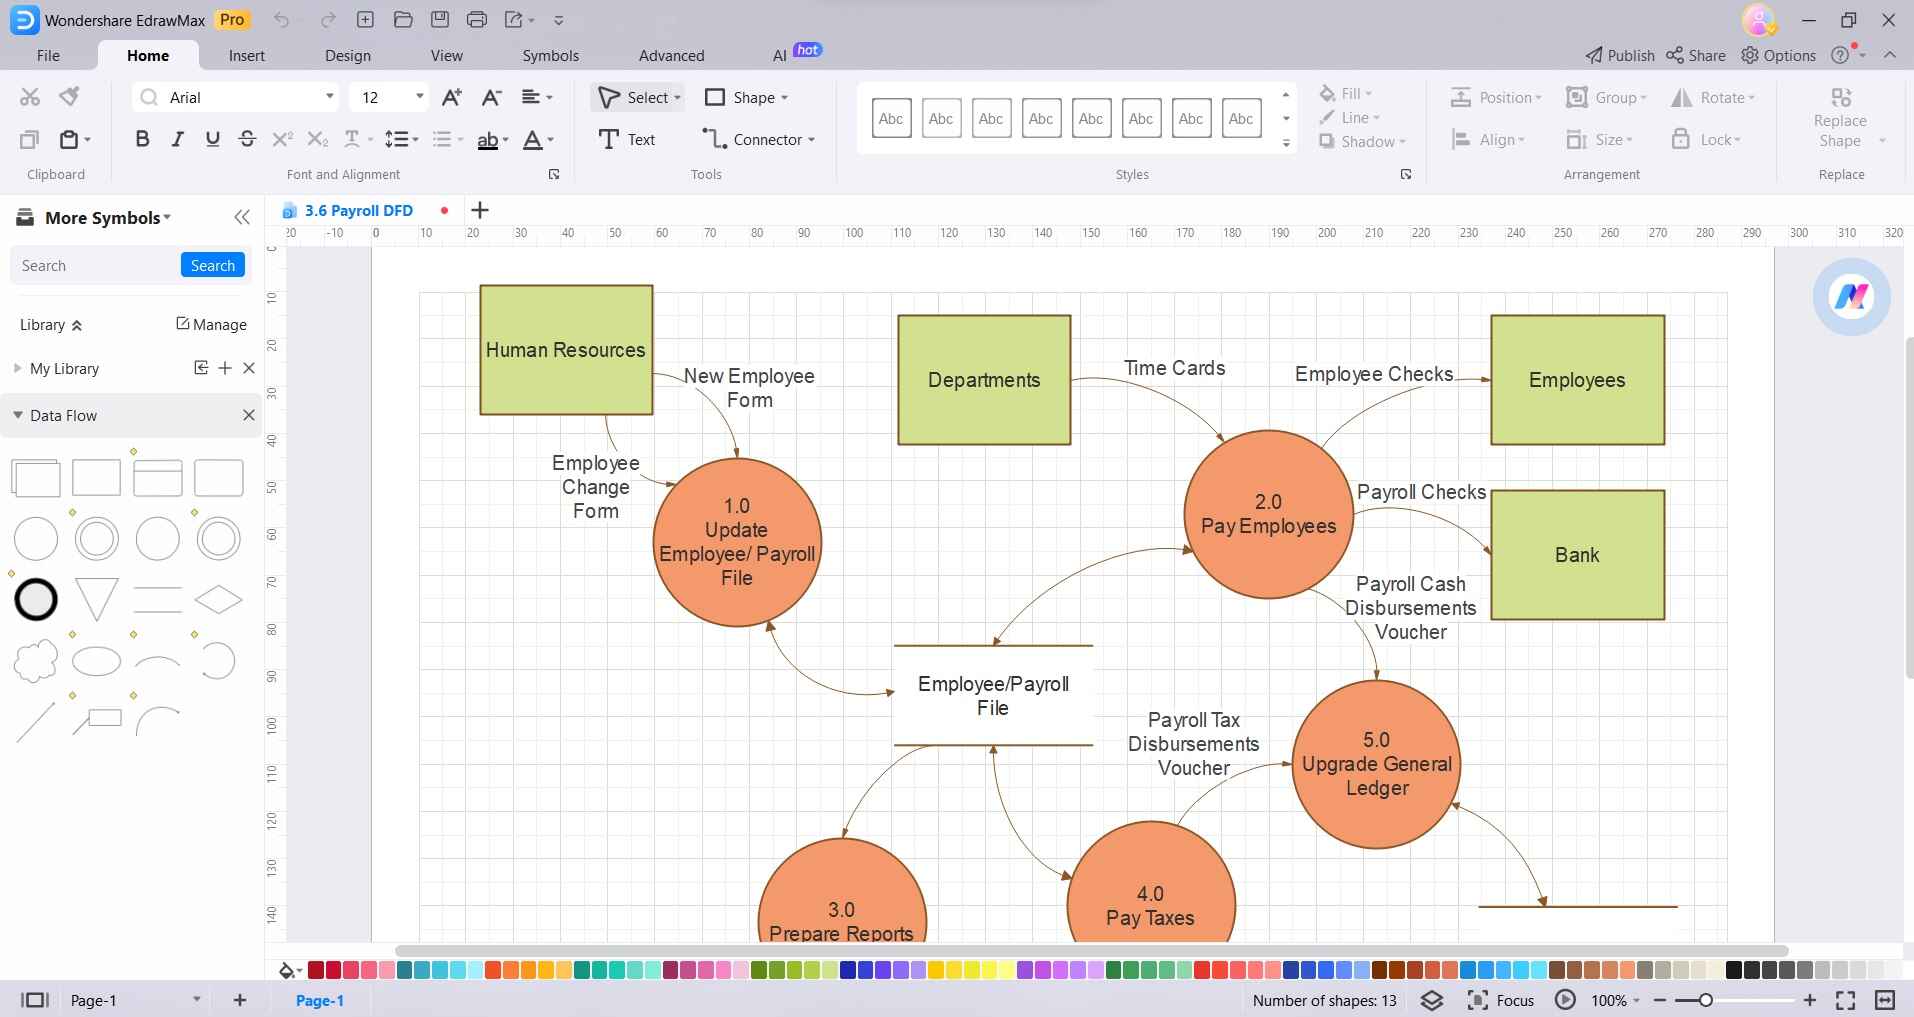
Step 3: Enter text labels for shapes and connectors. For data linking, go to the Shape Data tab. Enter data field names.
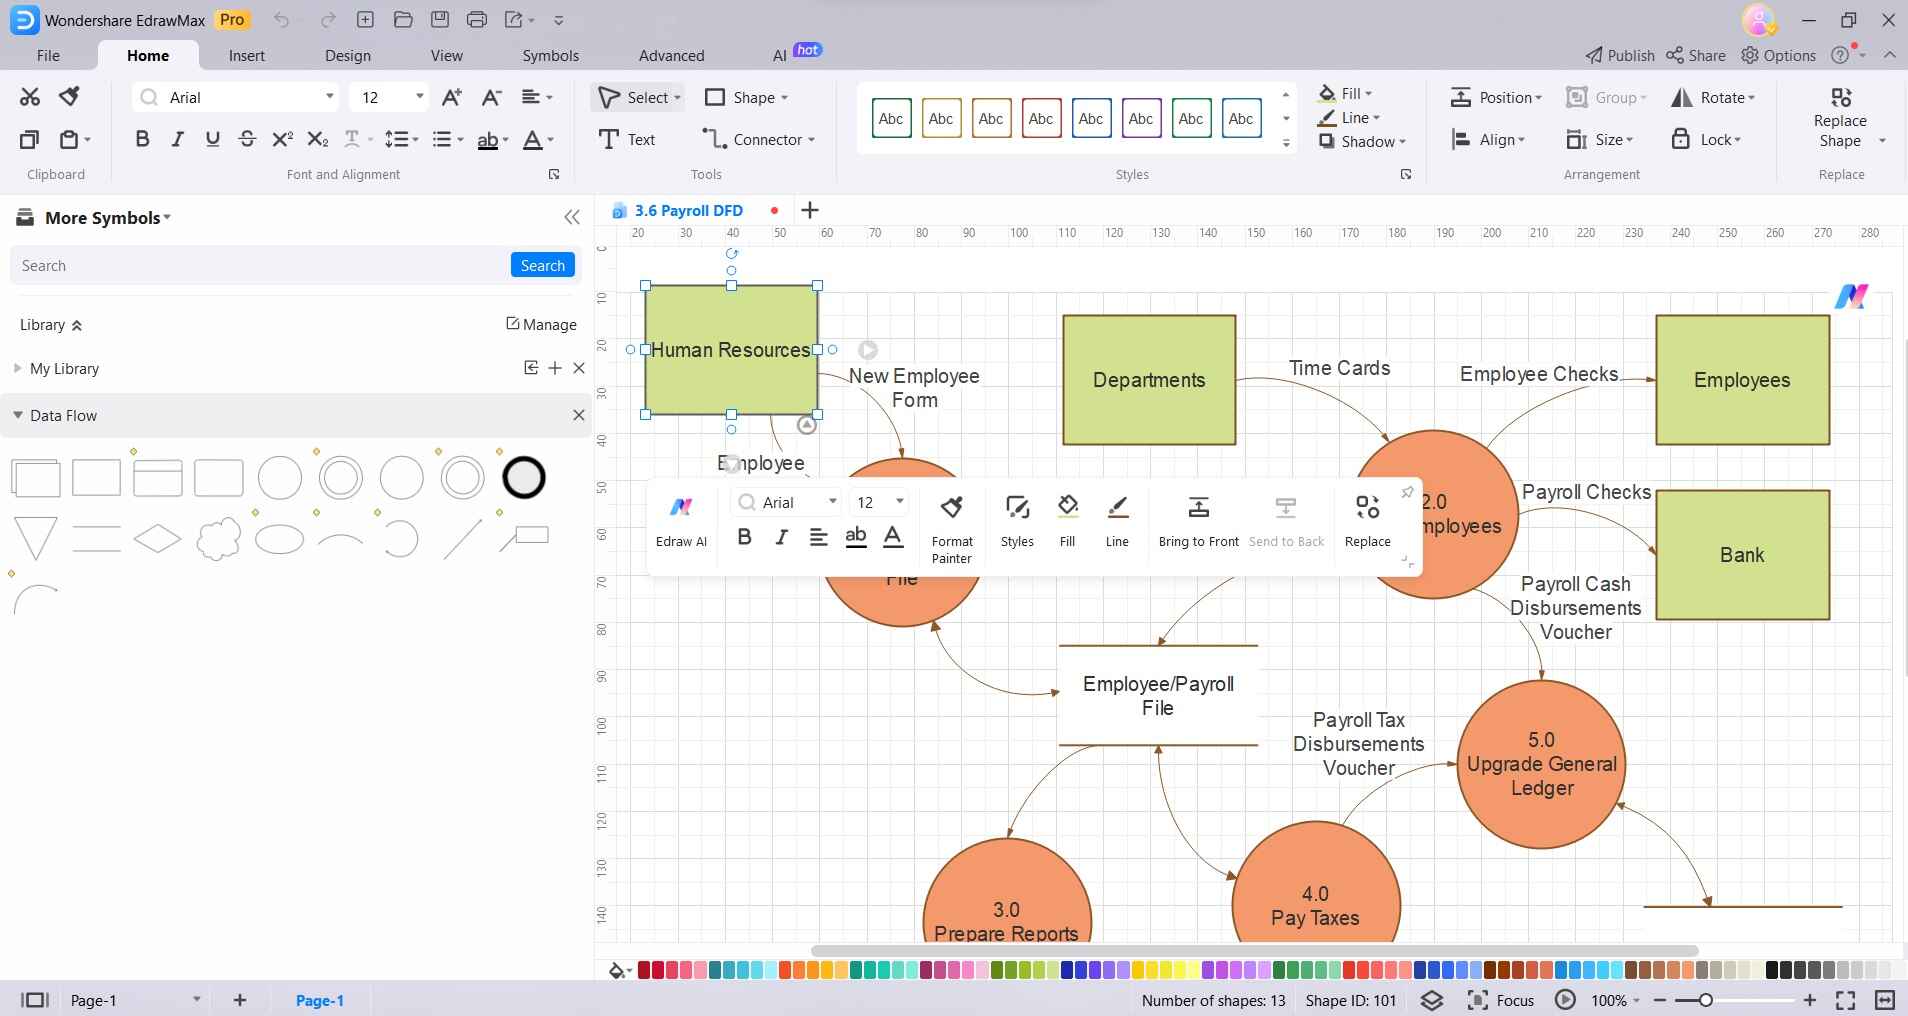
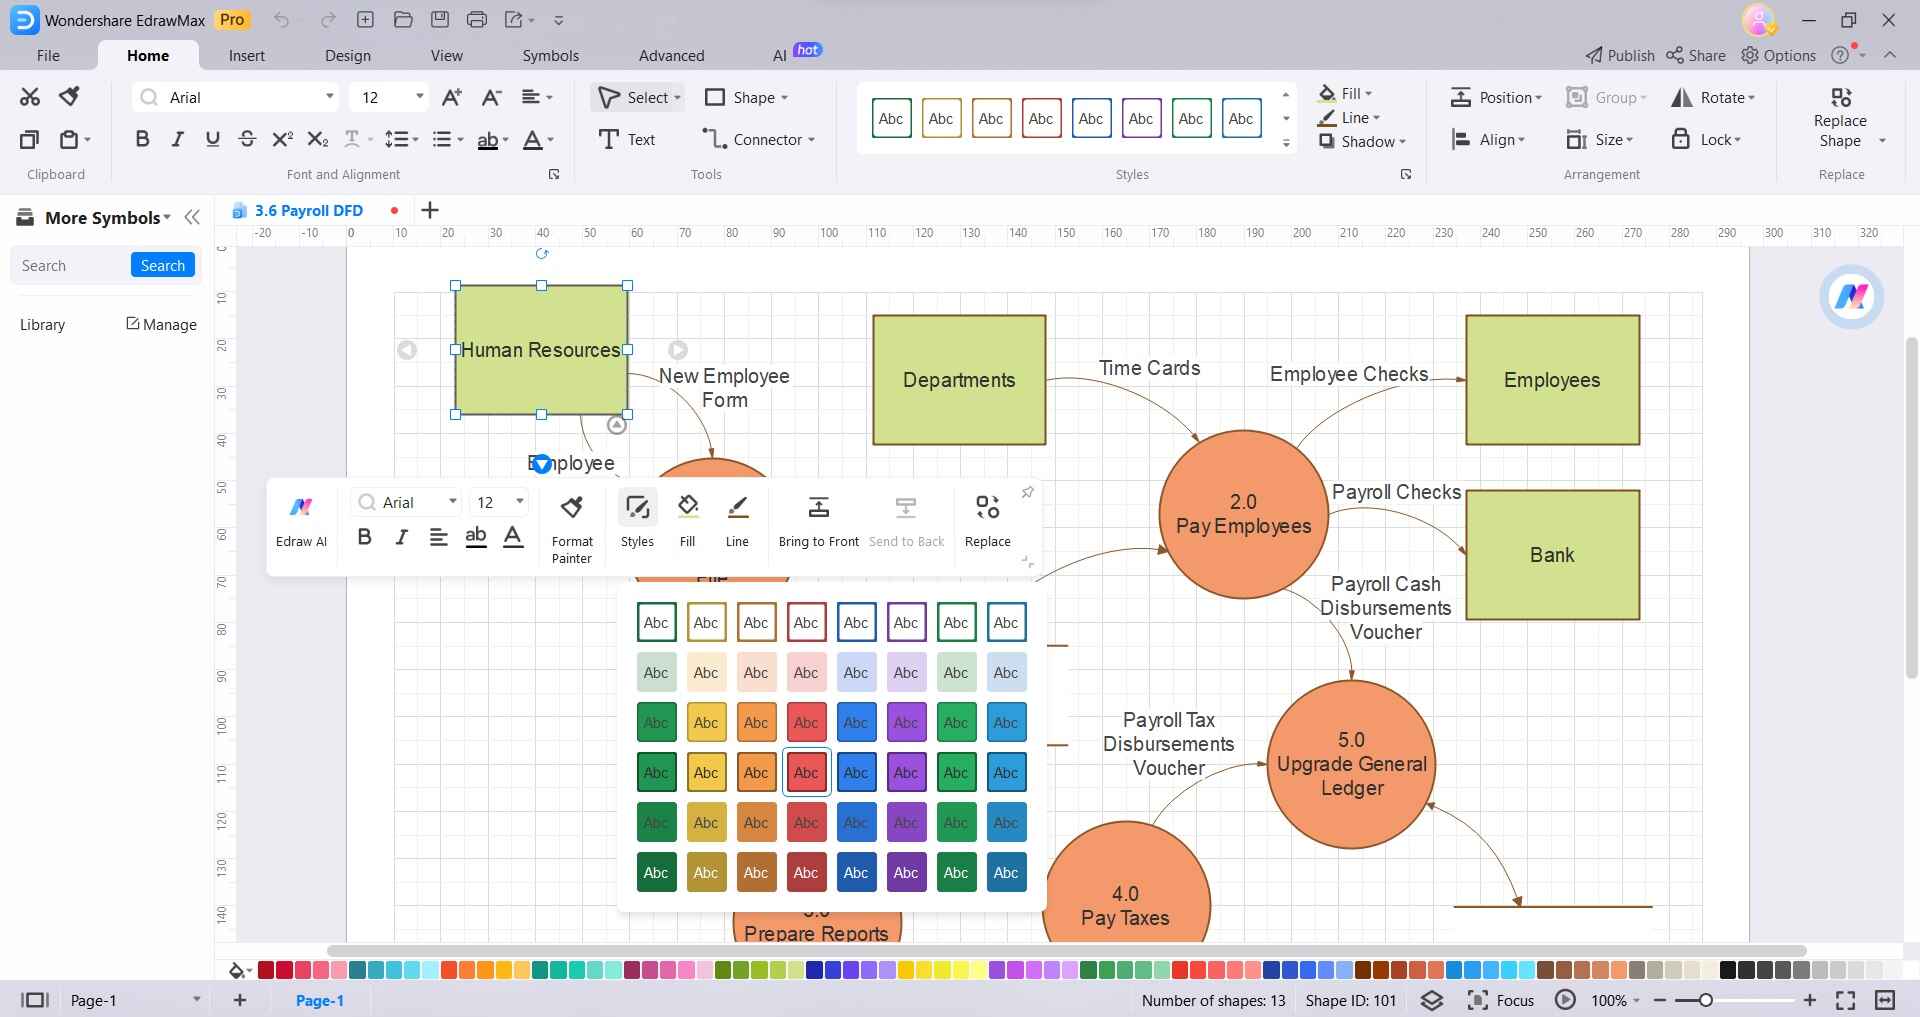
Step 4: Customize shapes with color, size, and styles from the formatting toolbar.
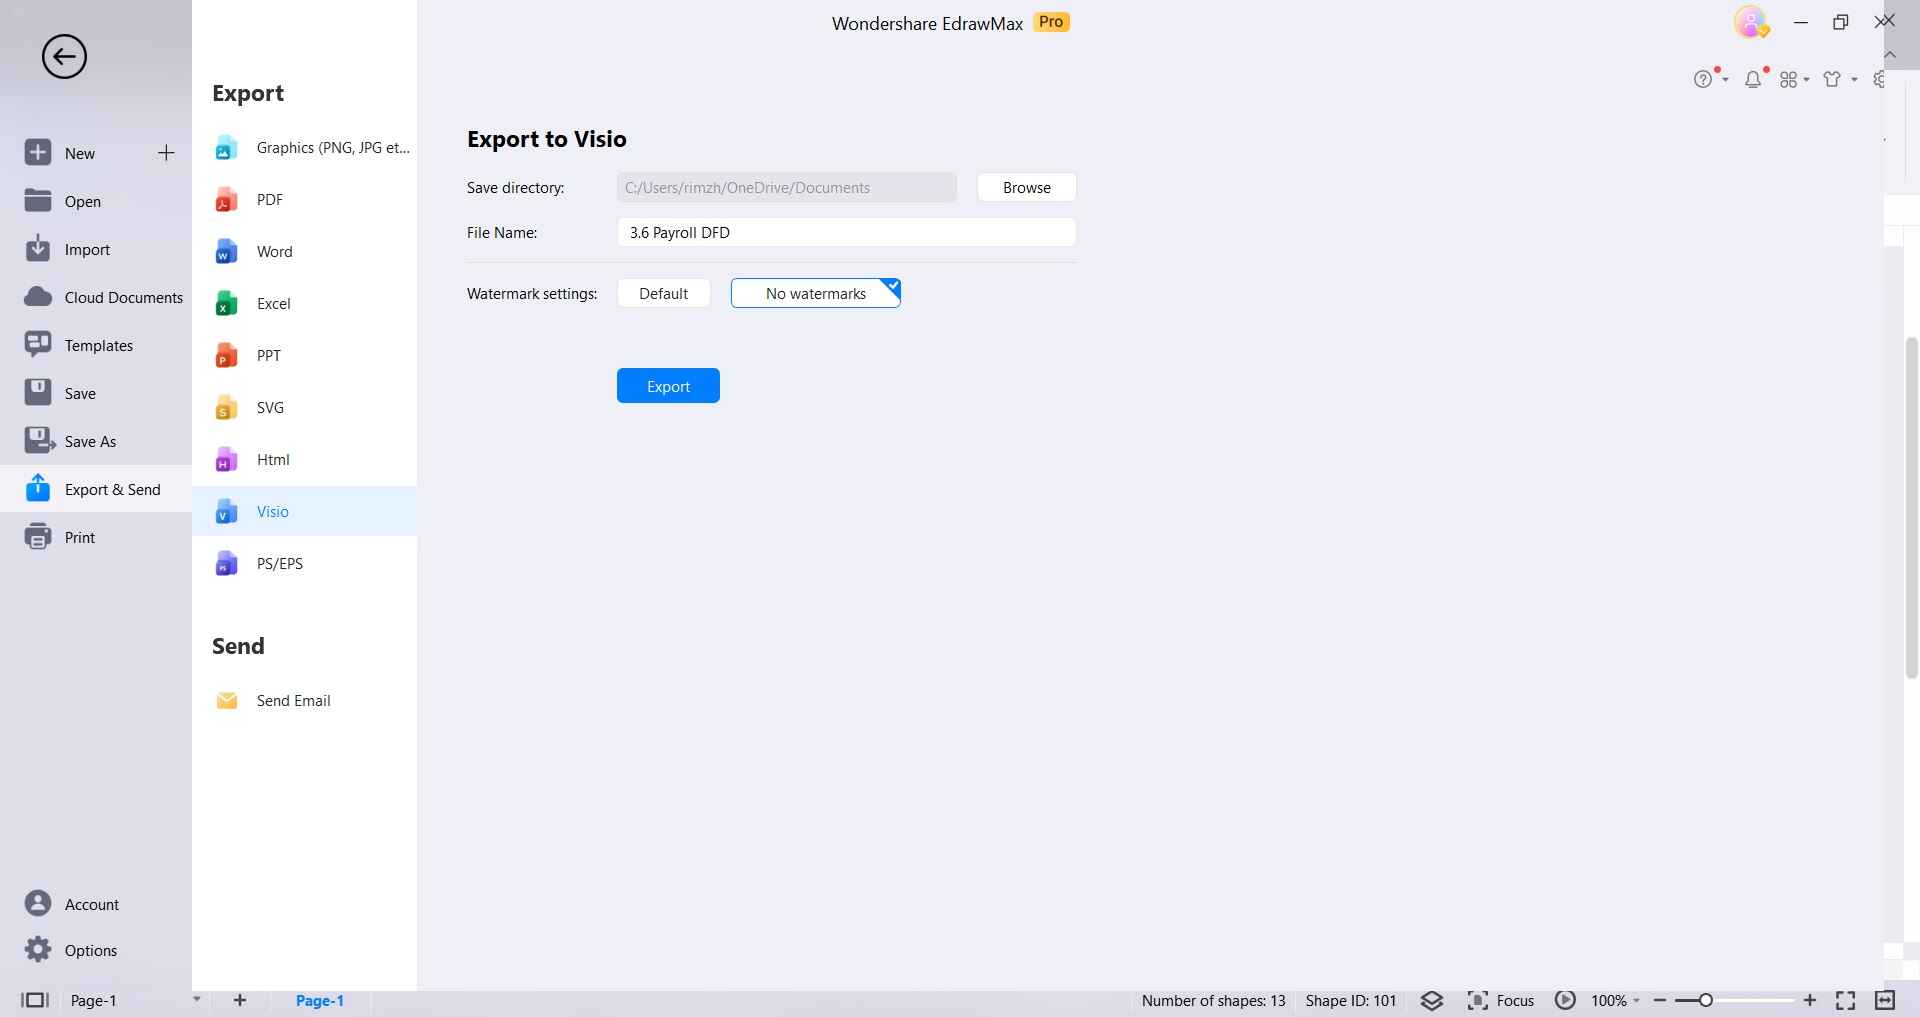
Step 5: Once DFD is complete, export it in the preferred format from the File menu.
Conclusion
Integrating Power BI with Visio brings together analytical and diagramming capabilities for impactful data storytelling. However, Visio has limitations. EdrawMax provides a more powerful alternative for creating any type of diagram integrated seamlessly with Power BI.
With custom shapes, styles, data linking, and easy workflows, EdrawMax helps BI professionals maximize productivity and take data visualizations to the next level.
