


Process flow diagrams are visual representations of business processes that help document and analyze workflow to improve efficiency. Microsoft Visio provides effective tools for creating detailed and visually appealing process flow diagrams.
This guide will provide a complete overview of creating professional process flow diagrams with Microsoft Visio.
In this article
Part 1. What is Microsoft Visio
Microsoft Visio is a diagramming and vector graphics application software. It allows users to visualize, create, and share professional diagrams such as flowcharts, network diagrams, org charts, floor plans, engineering designs, and more. The drag-and-drop interface makes it simple for anyone to create detailed diagrams, process maps, and visual representations of complex information and systems.
Some key features of Microsoft Visio include:
- Intuitive drag-and-drop interface for easy diagramming.
- Numerous templates for flowcharts, workflows, network diagrams, floorplans, and more.
- Ability to link diagrams to data sources.
- Tools for data visualization and business process modeling.
- Connectors and alignment guides for clean diagrams.
- Professional shapes and icons for all diagram types.
- Seamless integration with Microsoft 365 and SharePoint.
Part 2. Visio Process Flow: A Brief Understanding
A process flow diagram depicts the end-to-end workflow of a process. The diagrams display the sequence of activities and their relationships through standardized shapes connected with arrows that indicate direction and flow.
Process flow diagrams are used for:
- Documenting processes for analysis.
- Identifying inefficiencies and pain points.
- Planning improvement initiatives.
- Onboarding new employees.
- ISO certification.
- Visualizing workflows and business processes.
Key elements of process flow diagrams:
- Shapes - represent steps, activities, decisions.
- Connectors - indicate relationships and flow between shapes.
- Swimlanes - organize activities by function or role.
- Data flows - show inputs and outputs.
- Labels - provide additional information.
Part 3. Creating a Visio Process Flow Diagram
Follow these steps to create a process flow diagram in Microsoft Visio:
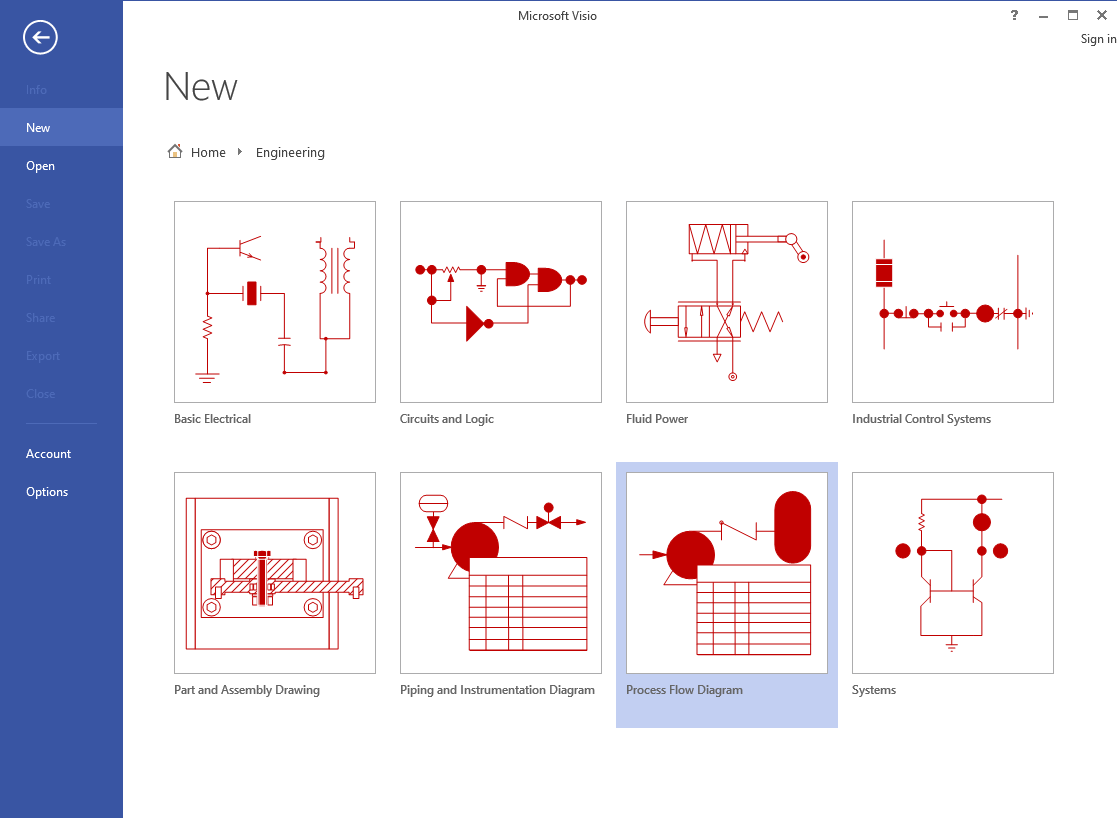
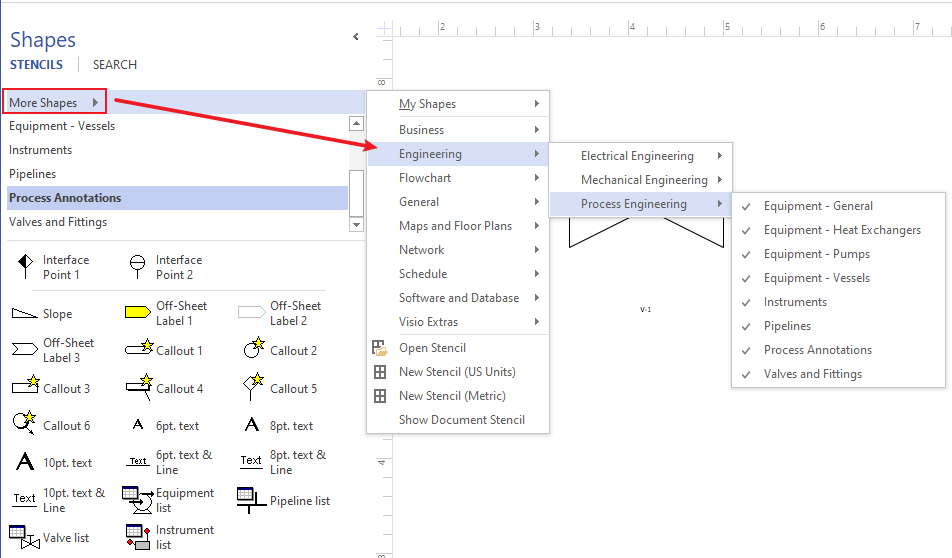
Step 1: Launch Microsoft Visio on your computer. Choose the "Process Flow Diagram" category and select the specific process flow diagram template that best fits your needs. This sets up the basic structure for your diagram.
Step 2: Drag and drop shapes from the "Shapes" pane onto the canvas. Use shapes like rectangles for processes, diamonds for decision points, and arrows for the flow of the process.
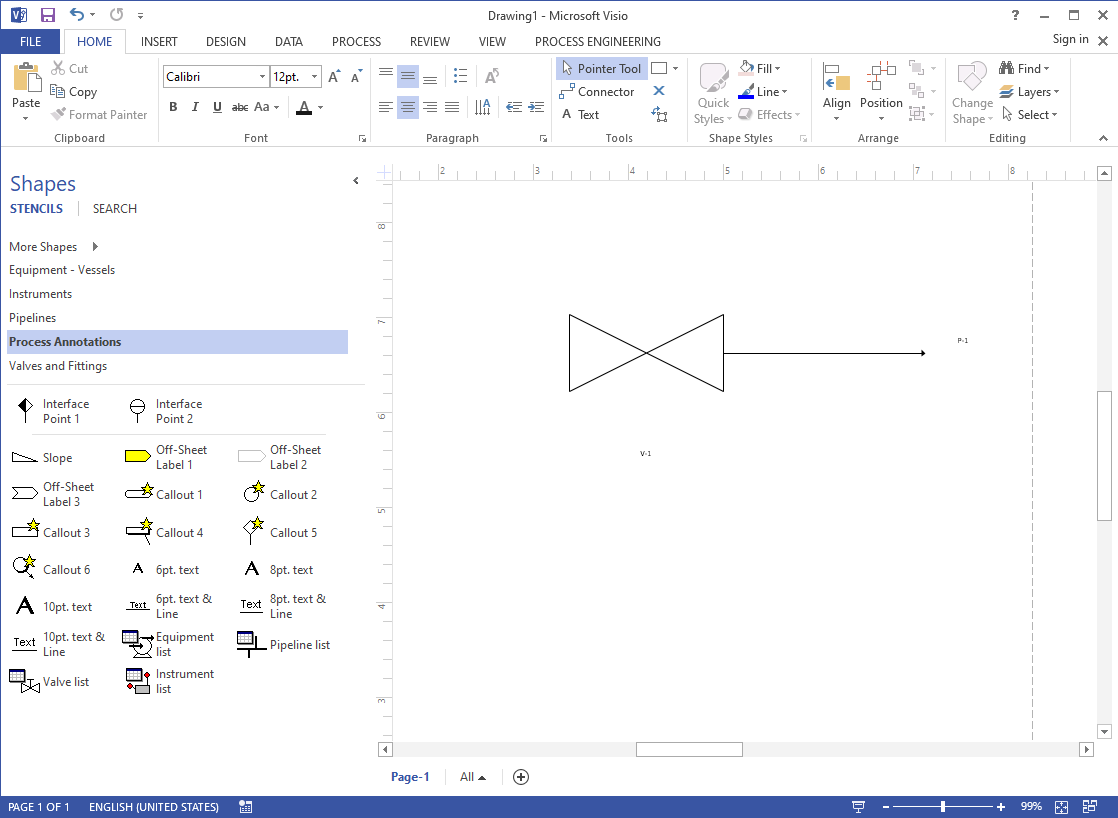
Step 3: Use the connector tool to draw lines (arrows) connecting the shapes in the order of the process flow. This visually represents the flow of the process from one step to the next.
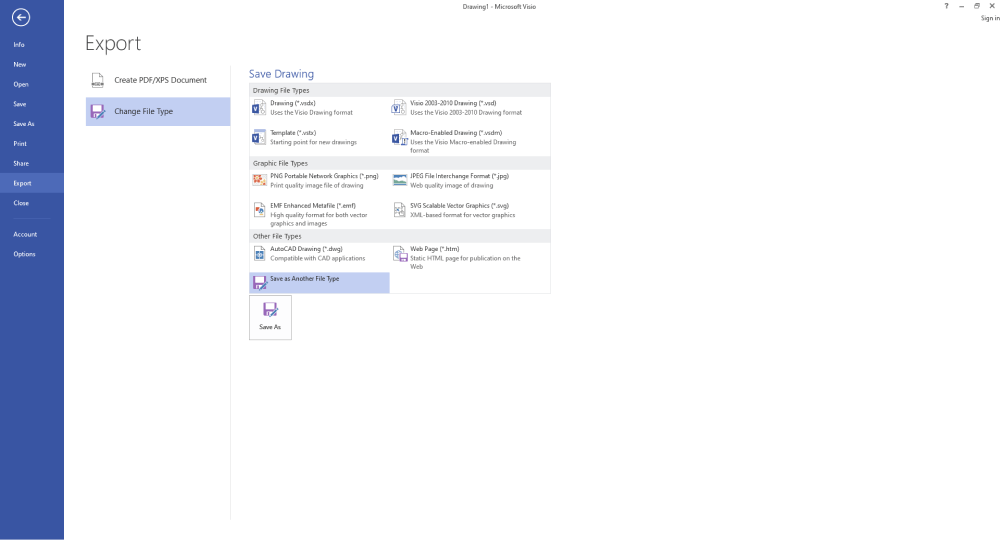
Step 4: Click on "File" and then select "Save" to save your process flow diagram. Choose a location on your computer and give your file a descriptive name.
By following these steps, you can create a clear and effective process flow diagram using Microsoft Visio.
Part 4. Types of General Purpose Process Diagrams
There are various types of process flow diagrams that can be created with Microsoft Visio:
Basic Flowchart
The most common process diagram is the basic flowchart. It shows the basic steps in a linear process and decision points. Useful for documenting simple to medium complexity processes. The linear flowchart is easy to understand and helps analyze business processes.
Cross-functional Flowchart
Depicts a process that involves multiple departments. Swimlanes are used to distinguish between functions. Illustrates handoffs and cross-department dependencies. Cross-functional diagrams provide clarity on complex workflows spanning functions.
Work Flow Diagram
Emphasizes the sequential flow of work or information between people or systems. More focused on human-centered processes versus software or technical processes.
Data Flow Diagram
Visualizes how data flows through systems and processes. Helps document data handling and requirements. Useful for understanding data dependencies and requirements for processes.
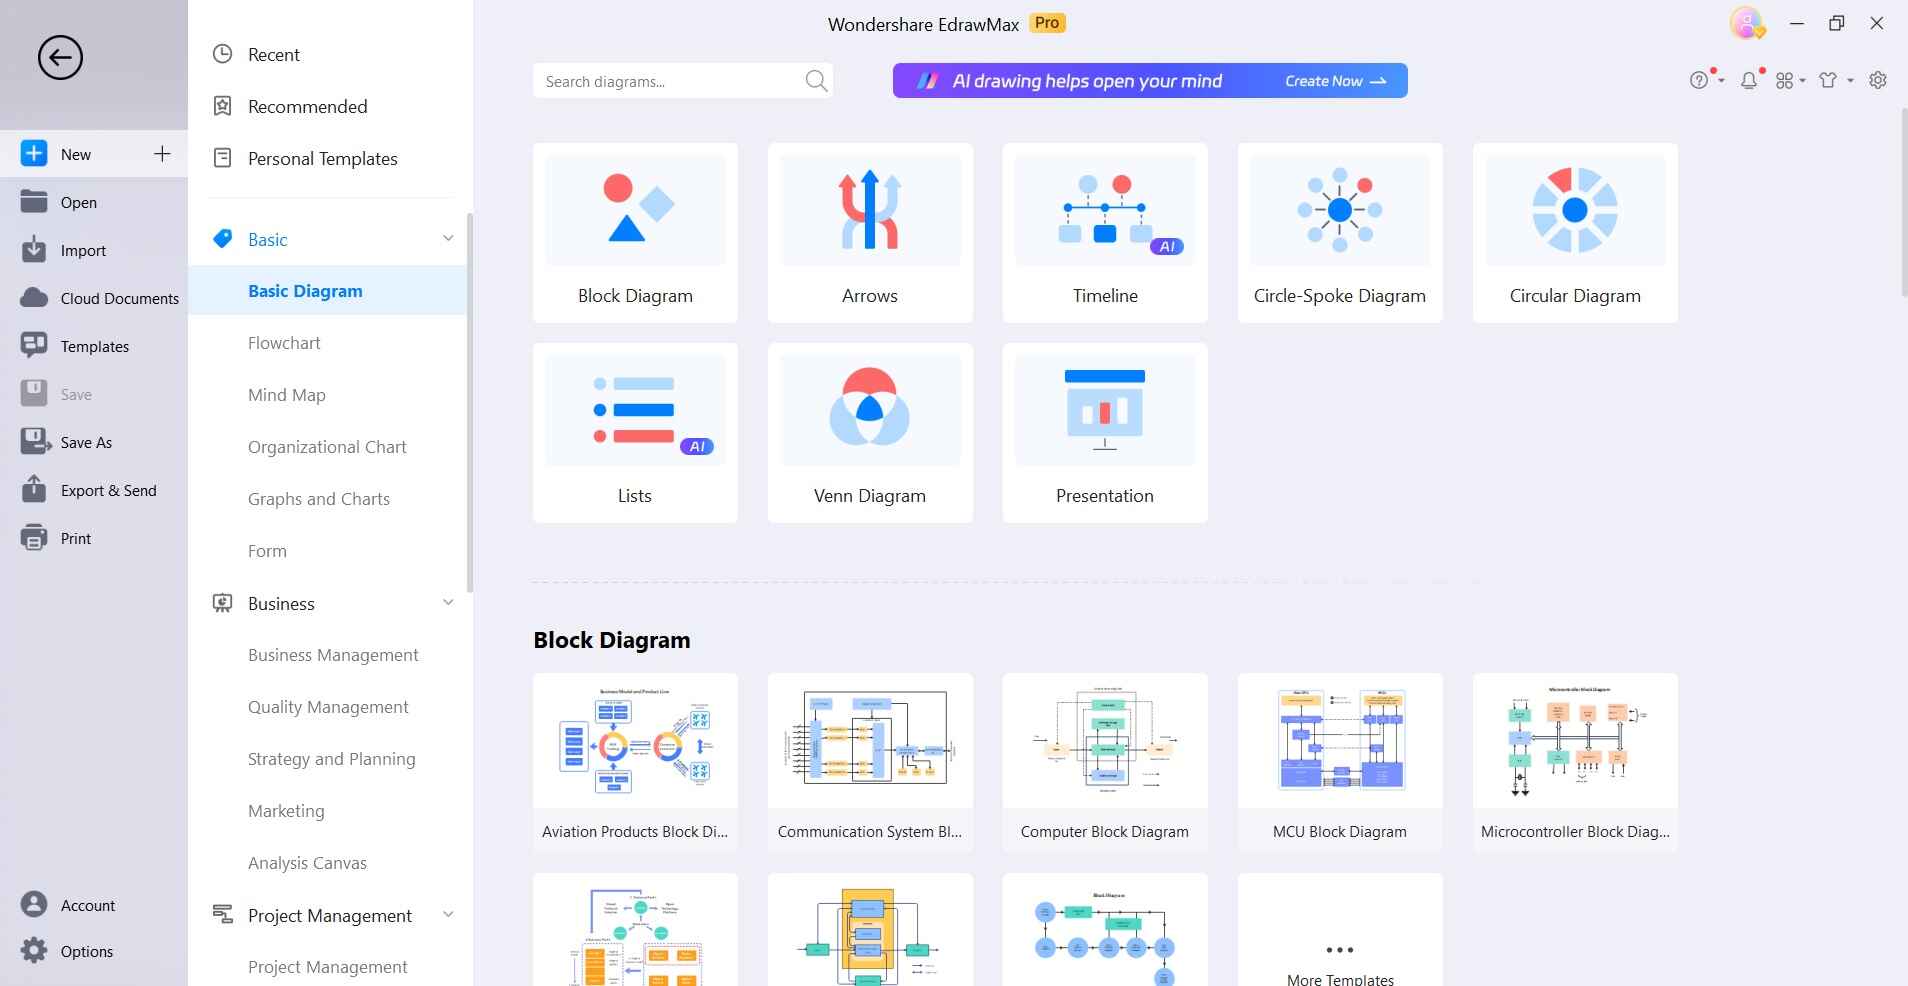
Part 5. How to Create a Process Flow Diagram Using EdrawMax
EdrawMax is a cross-platform diagramming and vector graphic tool that can also be used to create professional process flow diagrams. EdrawMax offers a user-friendly and versatile platform for creating diagrams, flowcharts, and other visual representations, making it a preferred choice for many over traditional tools. Its intuitive interface allows users to easily design and customize diagrams without a steep learning curve.
Additionally, EdrawMax stands out with its extensive library of templates, ensuring the quick and efficient creation of various visuals. With cross-platform compatibility, affordable pricing, and regular updates, EdrawMax proves to be a cost-effective and accessible solution, catering to the diverse needs of users seeking an efficient and modern diagramming tool.
Here are the steps to create a process flow diagram in EdrawMax:
Step 1: Launch EdrawMax and select the Flowchart template under Business.
Step 2: Drag process steps, decisions, connectors, data, and terminators from libraries. Organize with swimlanes if cross-functional.
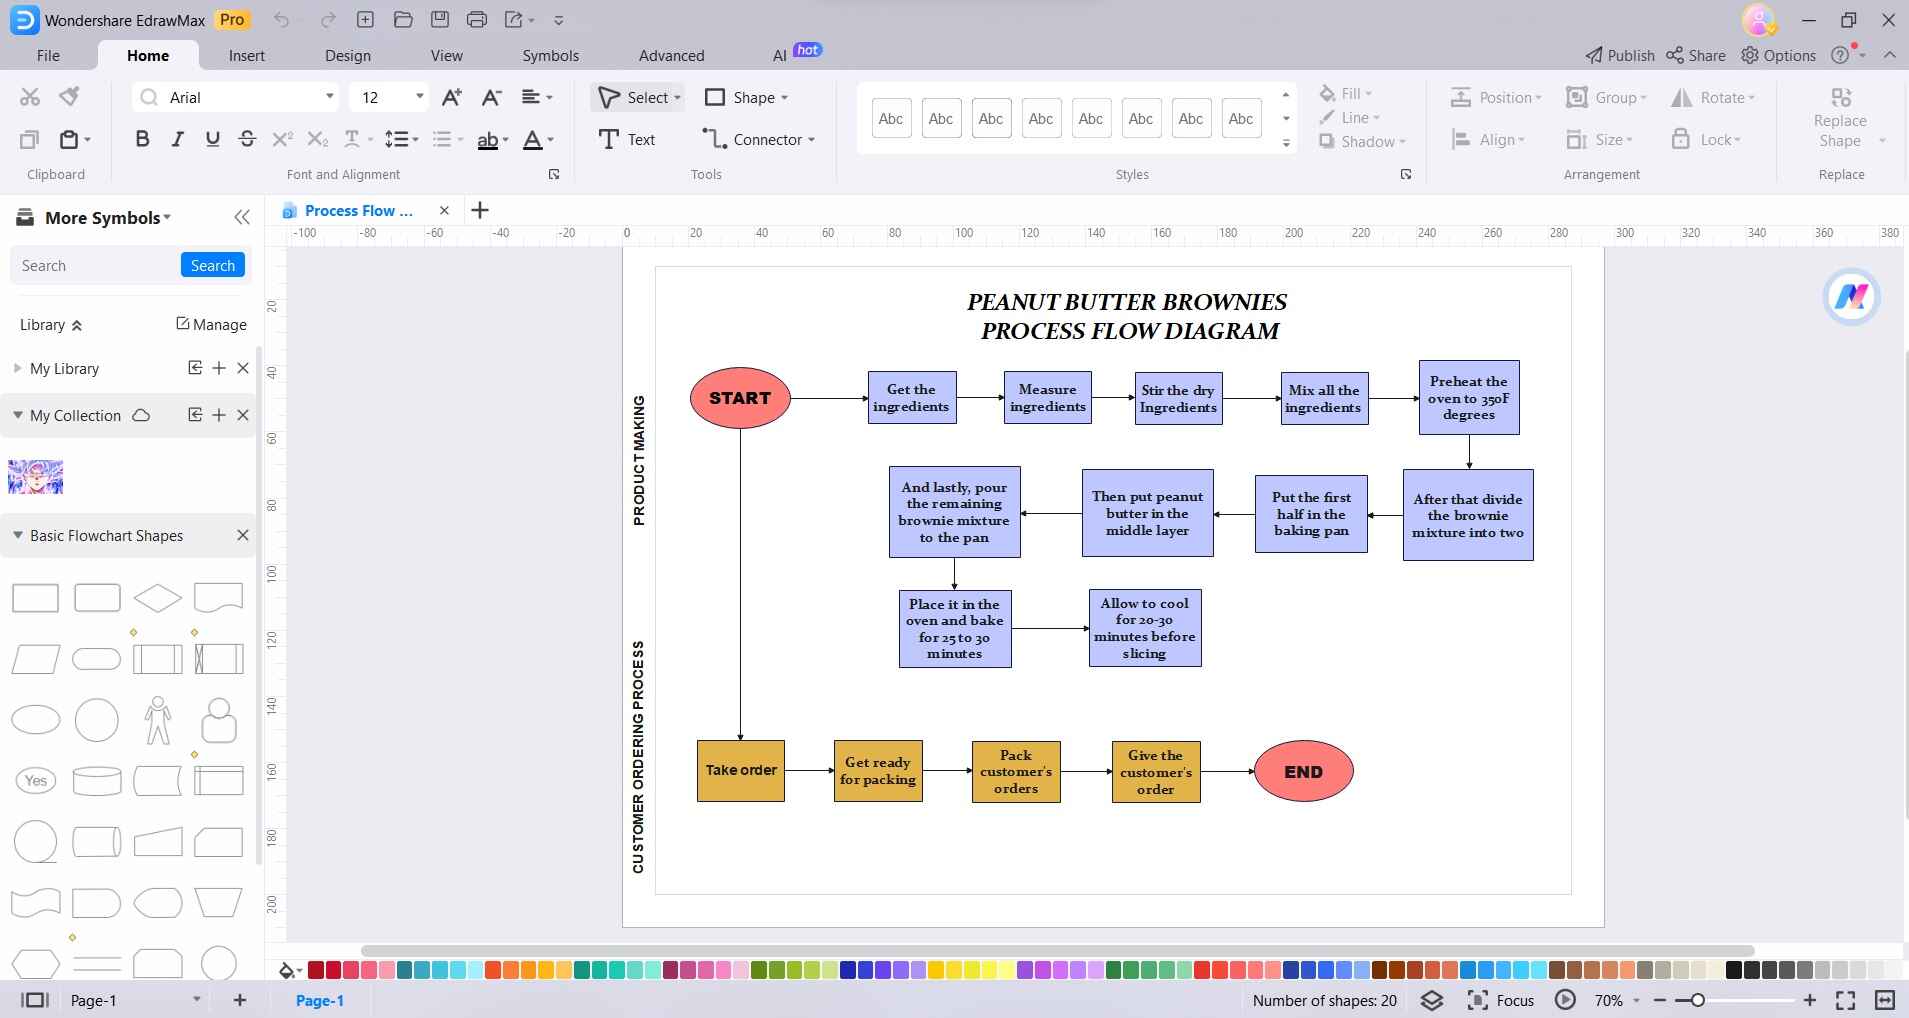
Step 3: Right-click shapes to add context menus. Use curve, elbow, and rounded connectors for clean flows. Add labels for clarity and details.
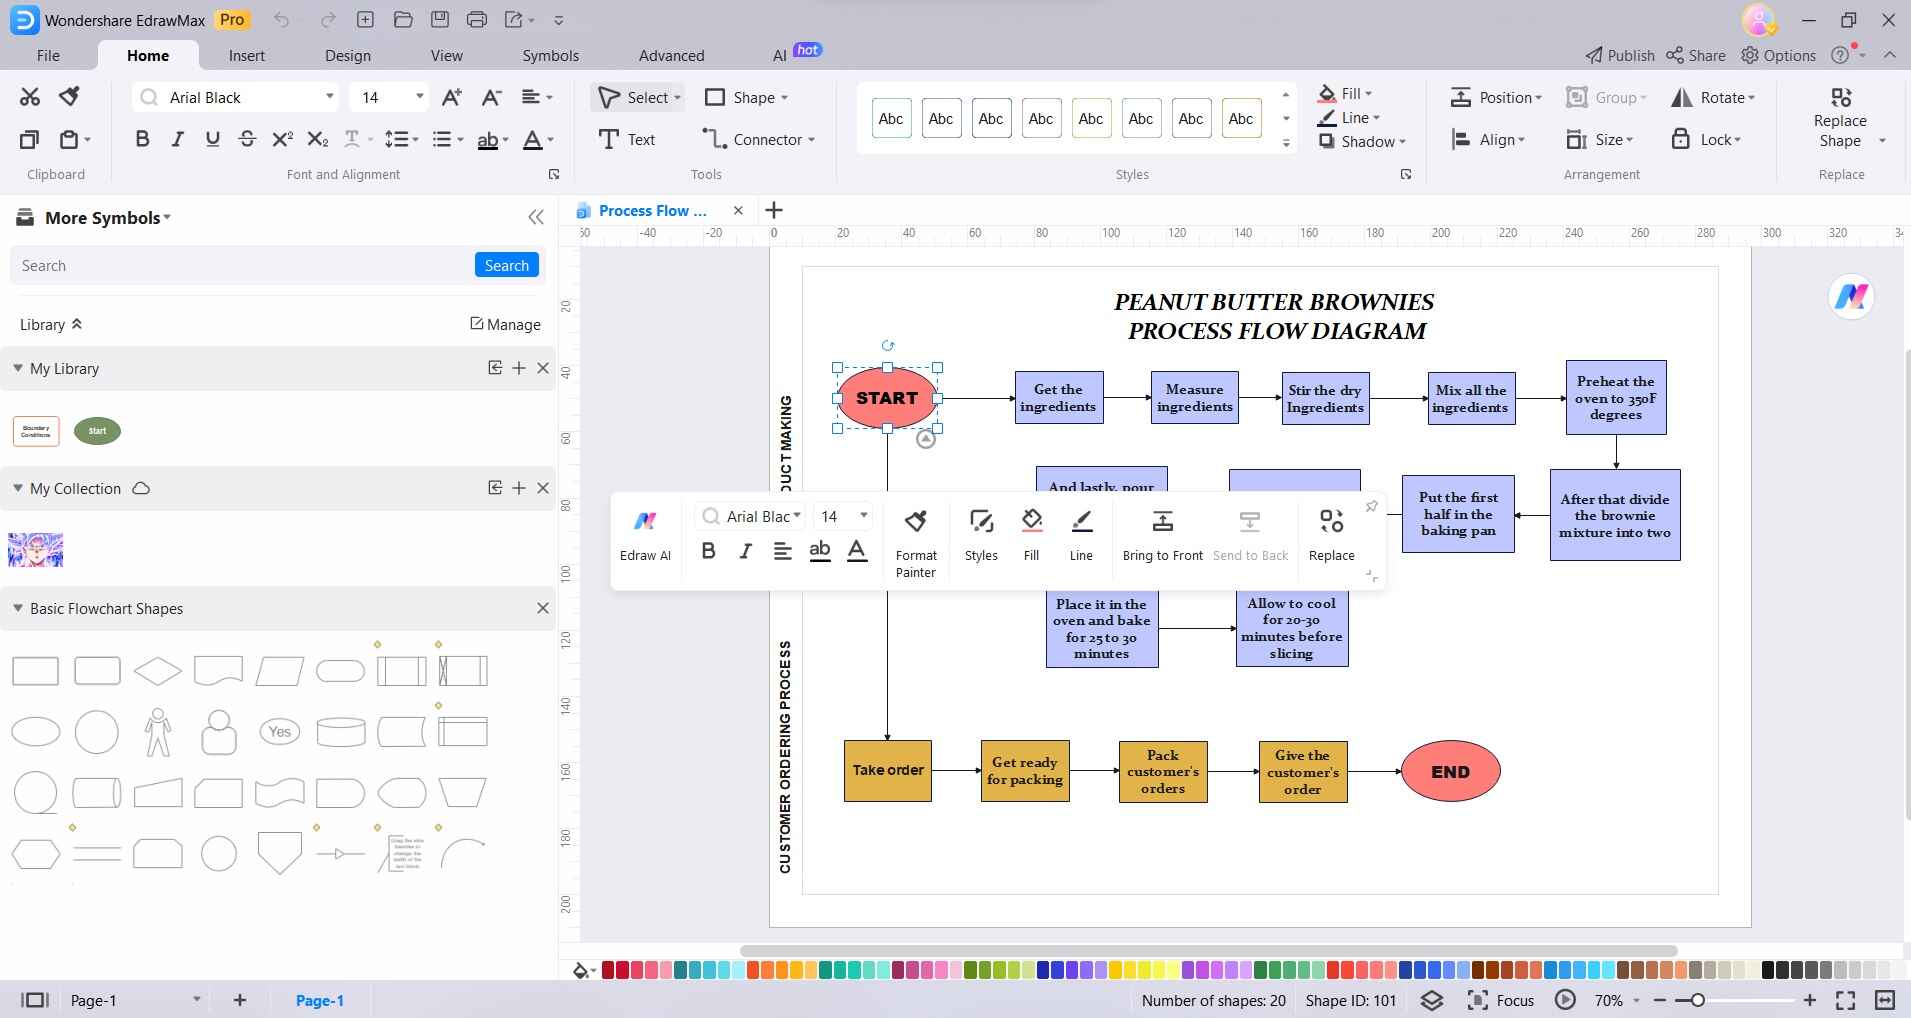
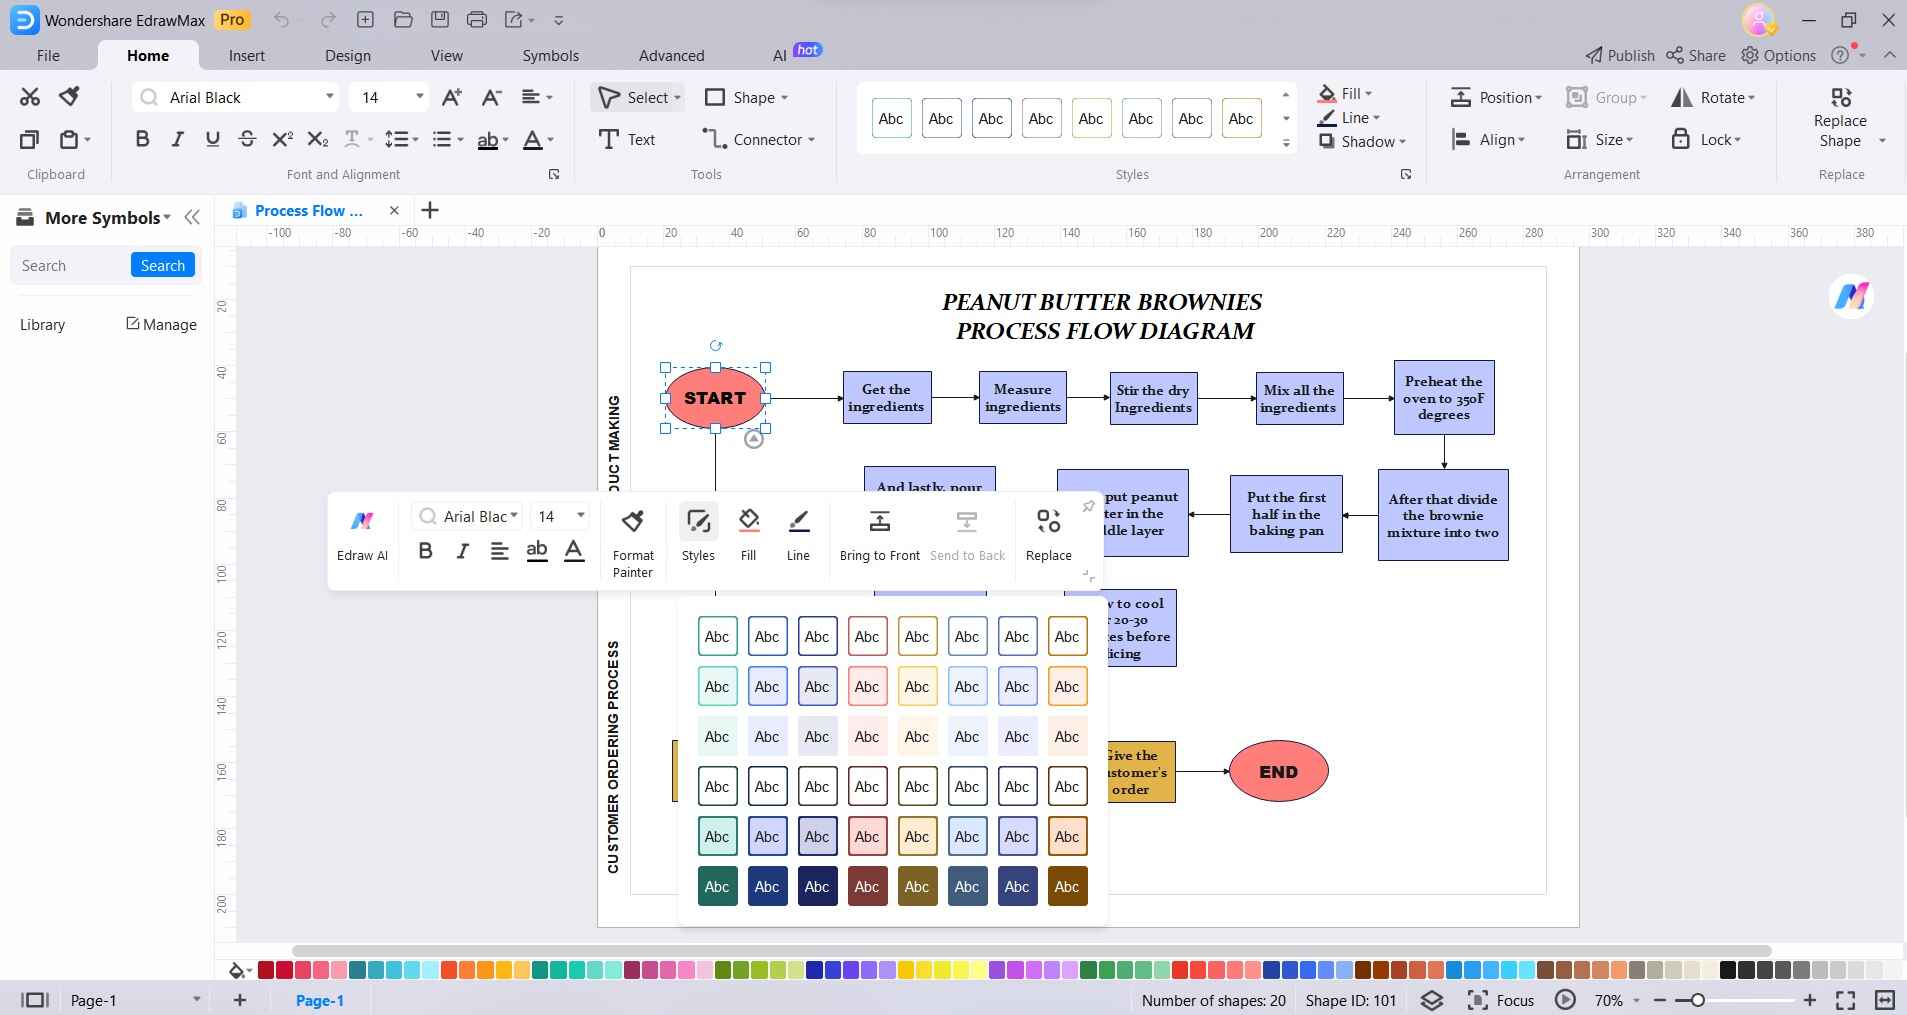
Step 4: Apply styles and visual effects to enhance appearance. Customize shapes with color, icons, text, and sizing.
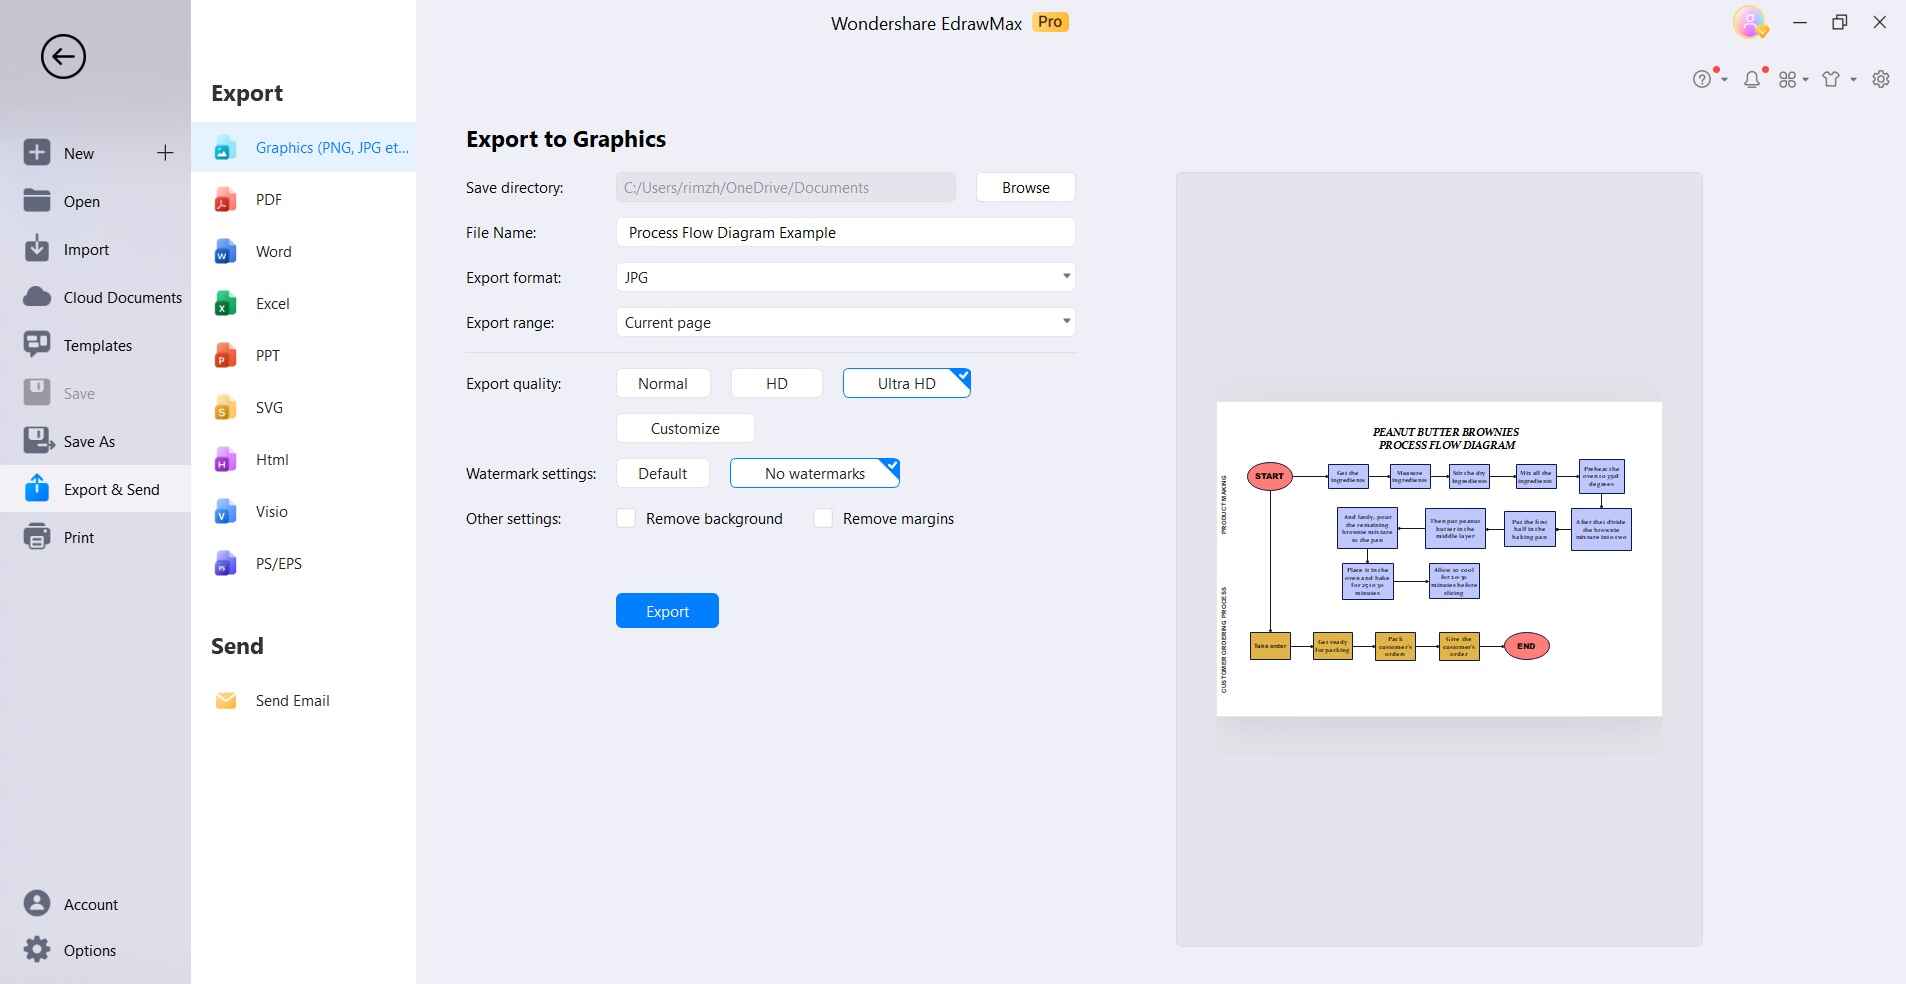
Step 5: Export as image files or Visio files for sharing.
Conclusion
Process flow diagrams are invaluable for visualizing business processes and workflows. Microsoft Visio provides a powerful toolset to create comprehensive process maps that are clear, and professional and help drive process improvement initiatives. The key is spending time upfront planning the key elements, flows, and relationships before starting to diagram.
The result is professional process flow diagrams that communicate processes effectively to various stakeholders.
AI Diagram Generator
Enter your prompt. Upload files if needed. Generate diagrams, charts, or slides instantly.


