


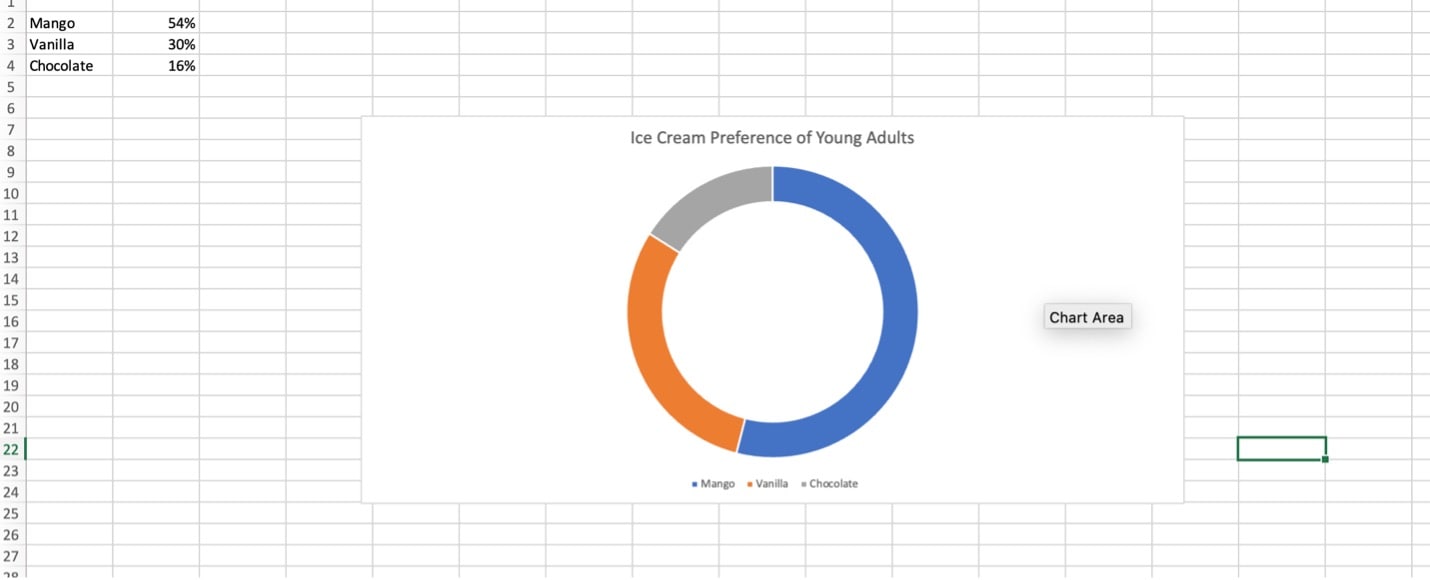
Welcome to the world of data visualization as we embark on a journey to learn how to create captivating doughnut charts in Excel. These circular charts are your perfect companions when presenting parts of a whole. They may be for budget allocations, survey responses, or other scenarios. As long as it involves showcasing proportions, doughnut charts are the way to go.
Excel is undeniably a widely used tool for data processing and charting. However, EdrawMax chart creation to the next level. Imagine having a professional diagramming tool at your fingertips. It has a free version and is accessible online. What’s more, with EdrawMax’s extensive collection of free templates, symbols, and icons, you can effortlessly create a stunning diagram even if you are a beginner.
In this article
Part I. Creating Doughnut Charts in Microsoft Excel
Meet Microsoft Excel, a tool like a digital wizard for numbers and graphs. While it's mainly known for making tables, it can also whip up some impressive charts. These charts are like visual guides that help you understand numbers better. You don't need to be a computer whiz to create a doughnut chart in Excel. Gather your data, tell Excel you want a chart, and choose the doughnut style.
Excel has its magic when it comes to chart-making. It offers step-by-step options to guide you through creating various charts, including doughnut charts. So, if you're ready to dive into doug hnut chart creation, follow the steps below:
Step1
Create a new file in Excel.
Step2
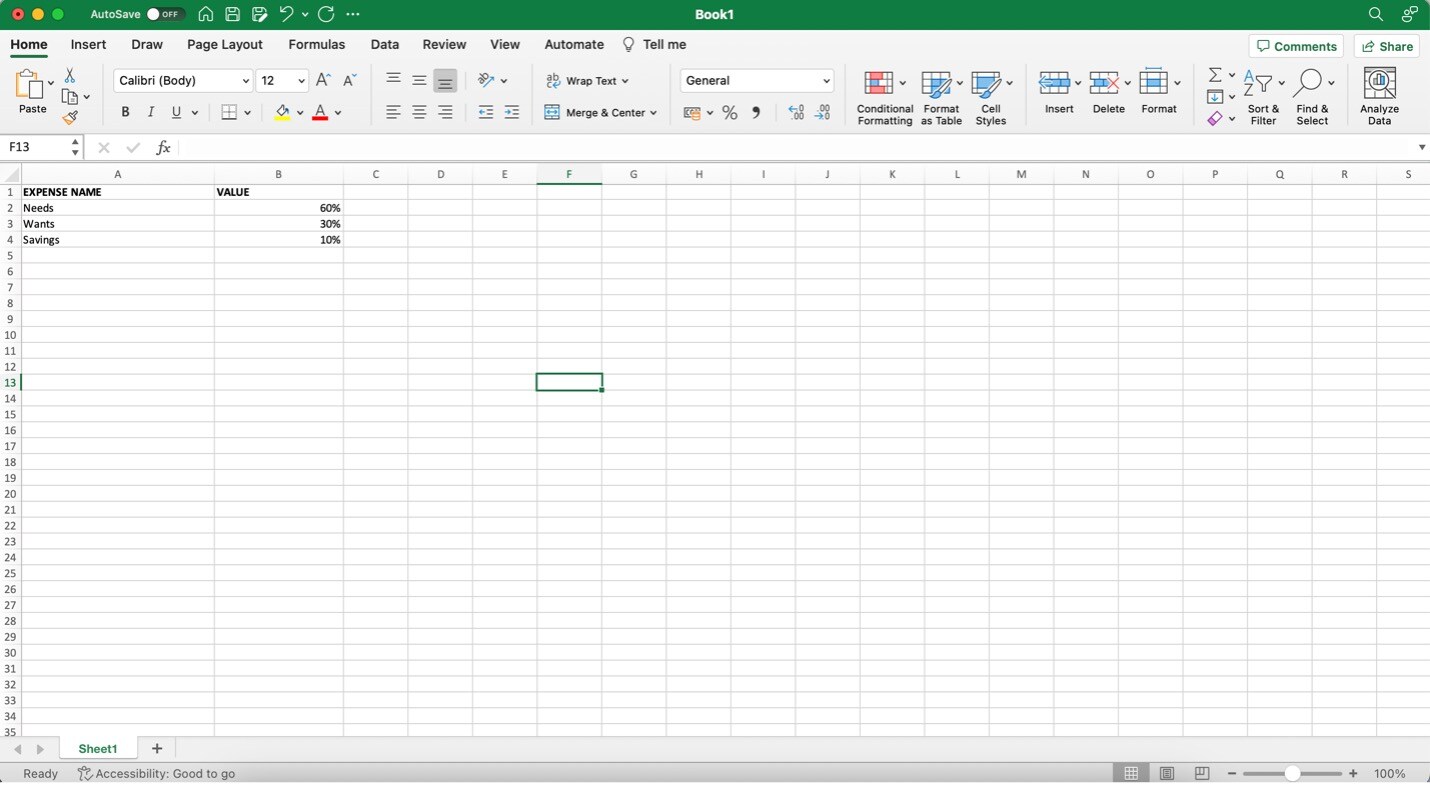
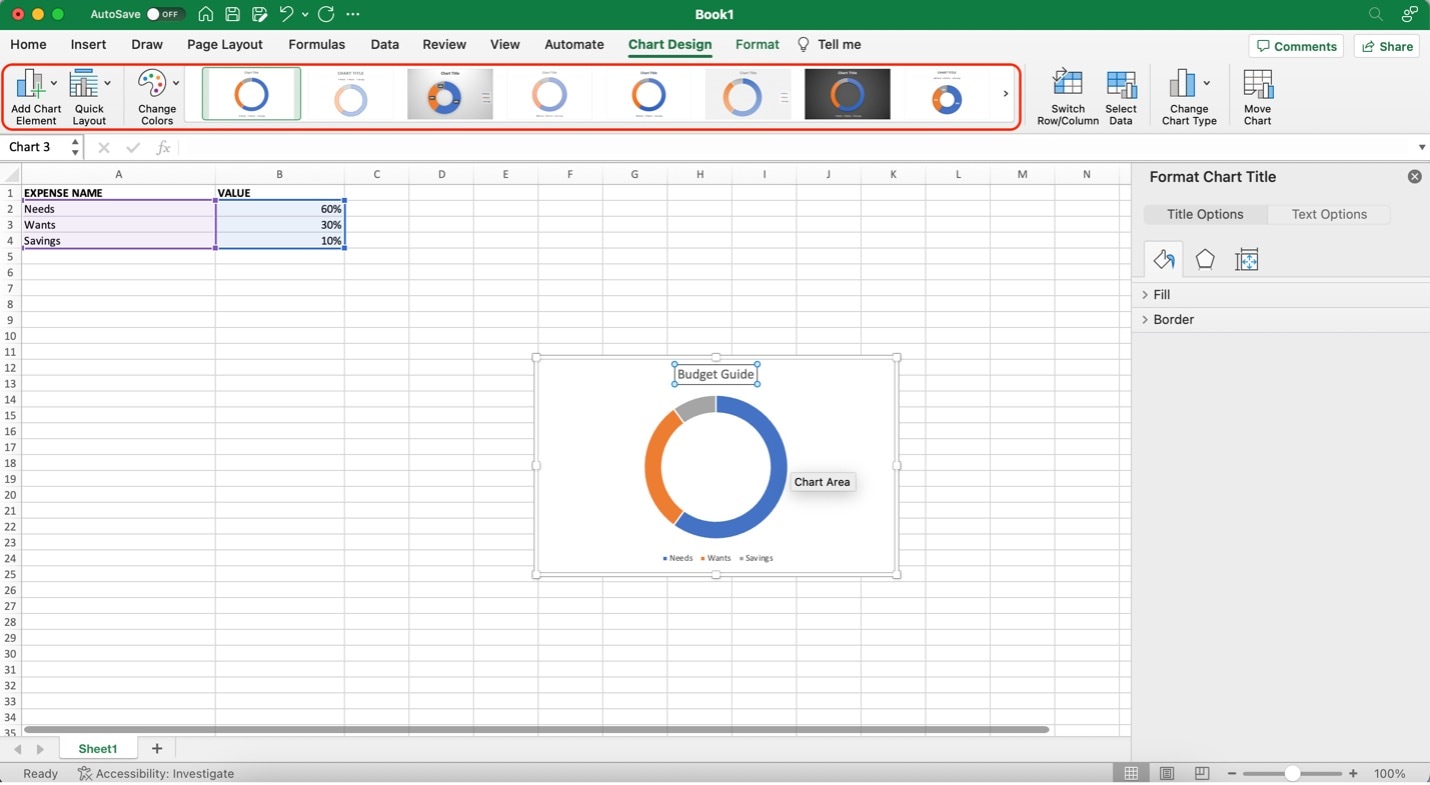
Type in your data in two separate columns. Use one column for the data label and one for the value. In this example, the labels are under "Expense Name." The values are under "Value."
Step3
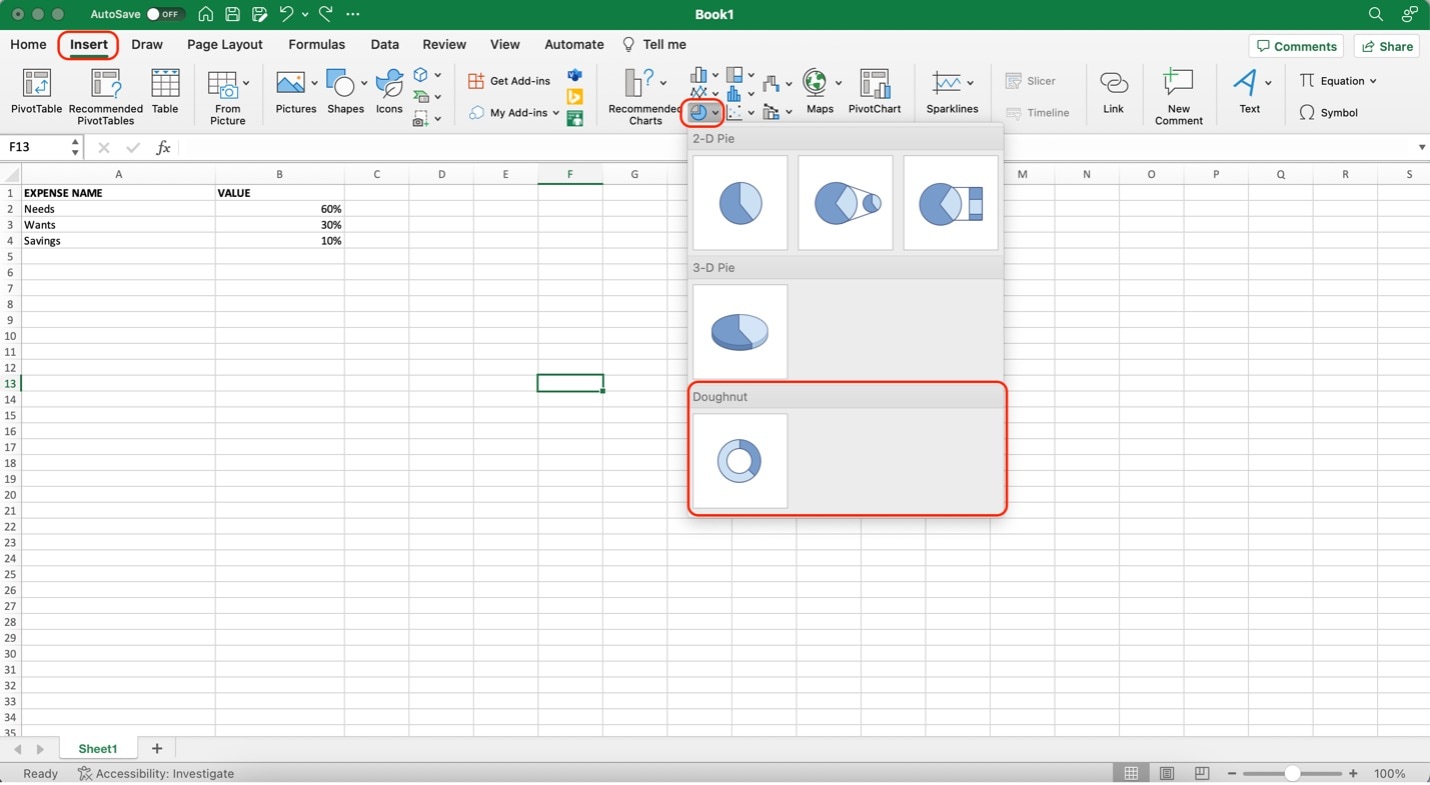
To add a doughnut chart, click on any other cell. Then, click Insert on the menu bar. Afterward, click the Pie icon. On the appearing menu, click Doughnut.
Step4
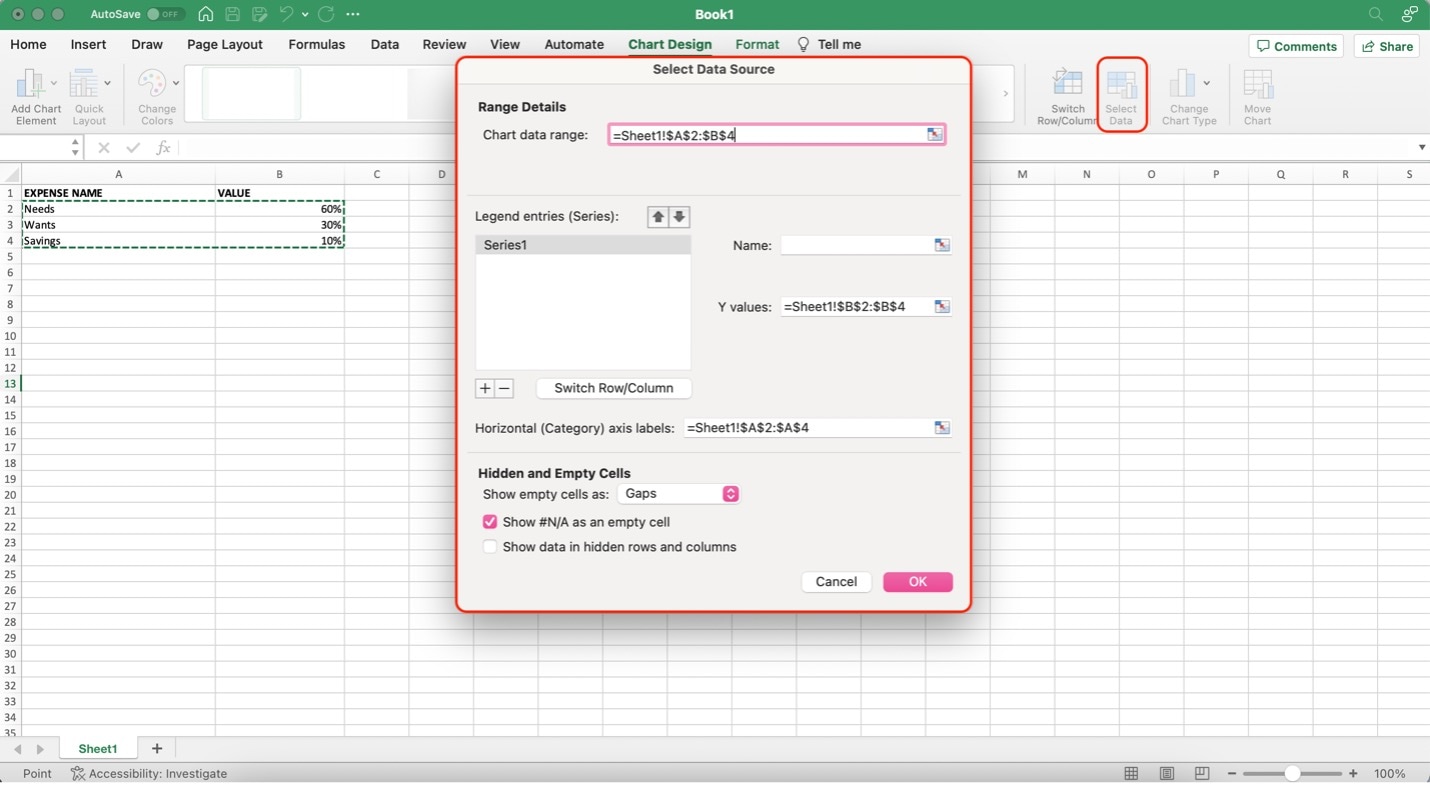
To add your data, go to the new Chart Design menu on the menu tab. Then, type in your data range as shown below. Alternatively, you can click and drag to select the range of data. Excel will automatically detect your data range. After you finish it, click OK.
Step5
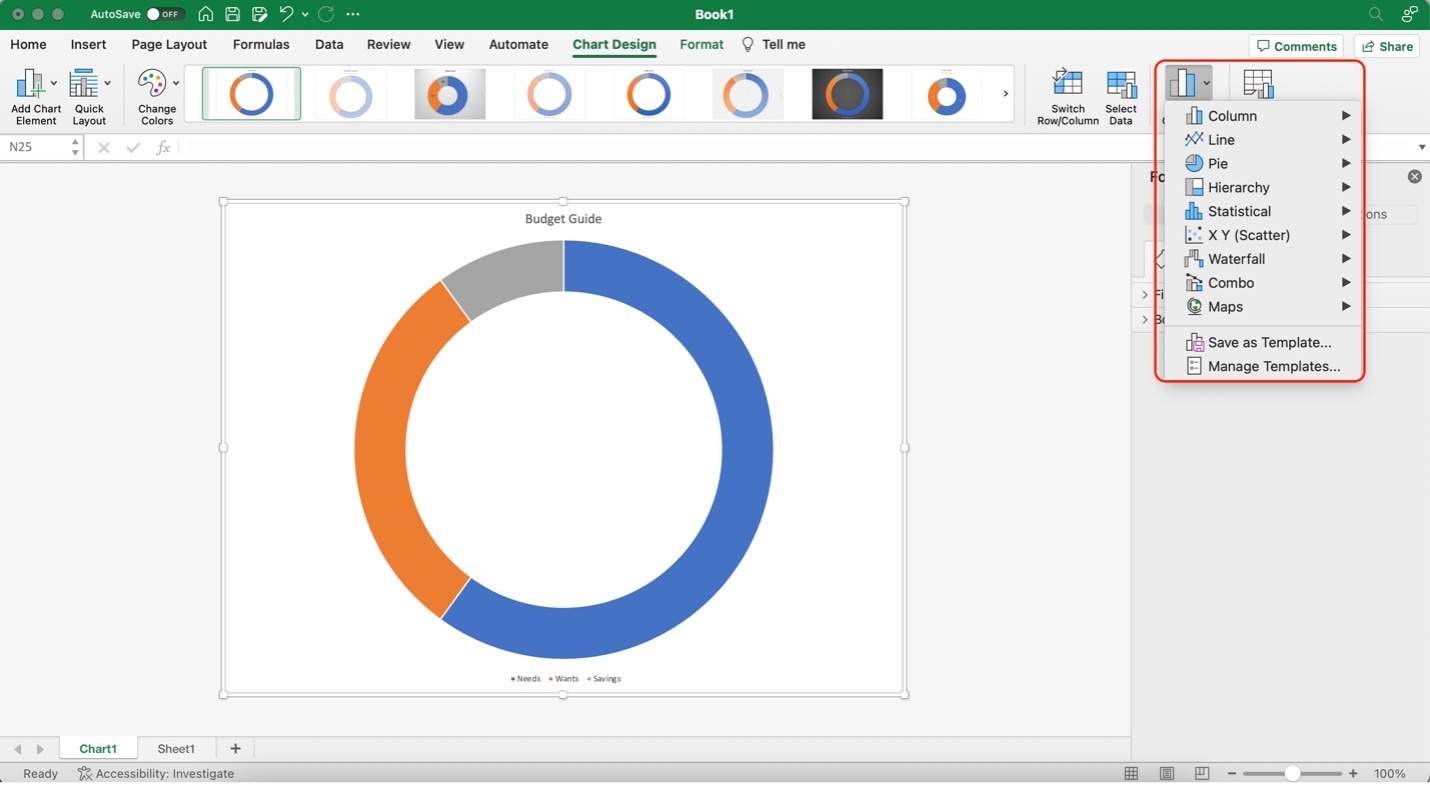
Use the customization options on the toolbar under the Chart Design menu to customize your chart. To edit the title of your chart, double-click the name text and type away.
Step6
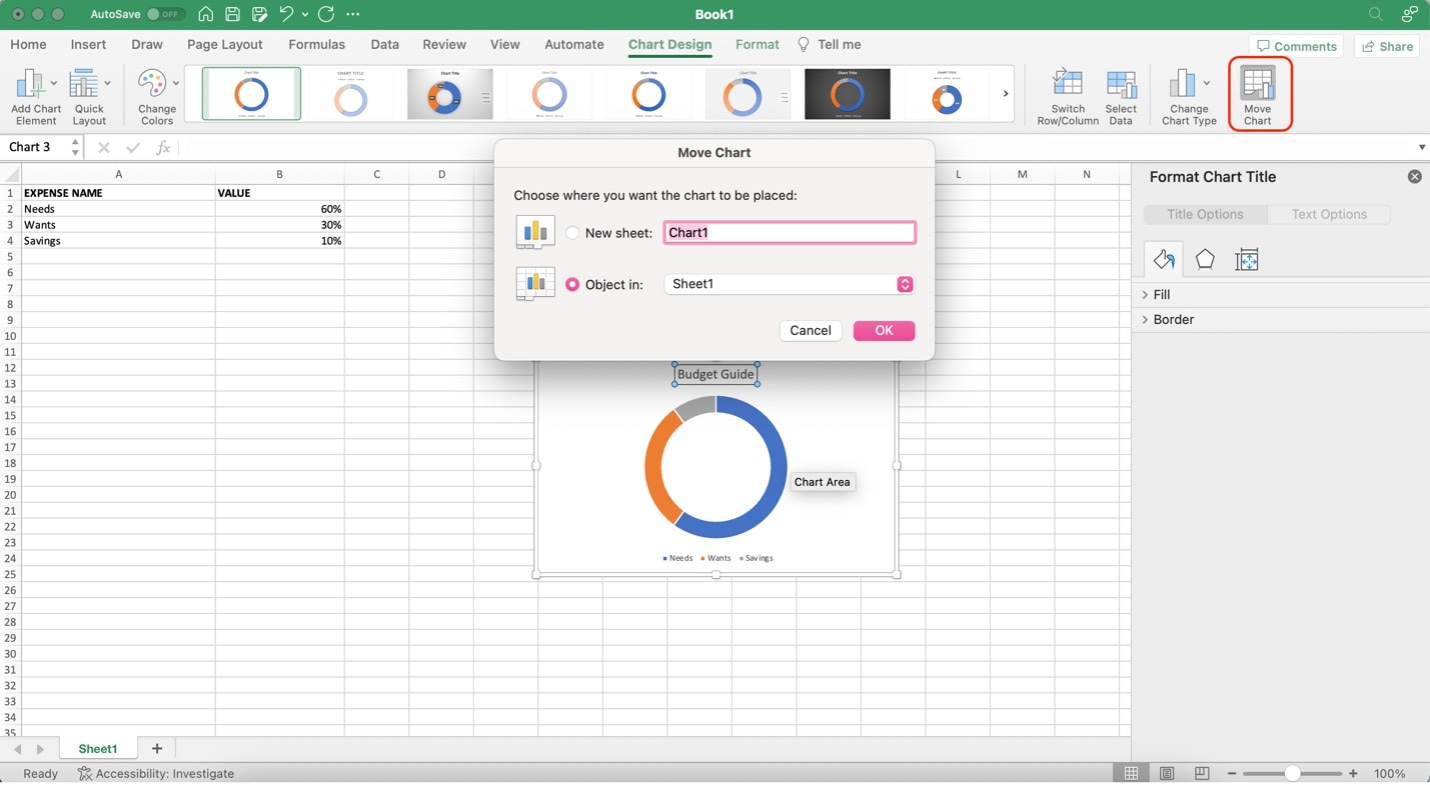
To move your chart to another sheet, click the Move Chart button on the right-most part of the Chart Design menu toolbar. Click New sheet, rename it, select the target sheet in the dropdown menu beside Object in:, and click OK.
Part II. Create Doughnuts Charts with Wondershare EdrawMax: Better and Faster
Now that you've mastered creating doughnut charts in Excel, take things up a notch. Are you eager to develop those same charts with even more finesse and speed? EdrawMax is a professional diagramming tool that will strengthen your charting game. Get ready to enhance your data visualization skills. Follow the steps to learn how to create doughnut charts like a pro using EdrawMax Online.
Step1
Access the EdrawMax website. Click Try it free and login.
Step2
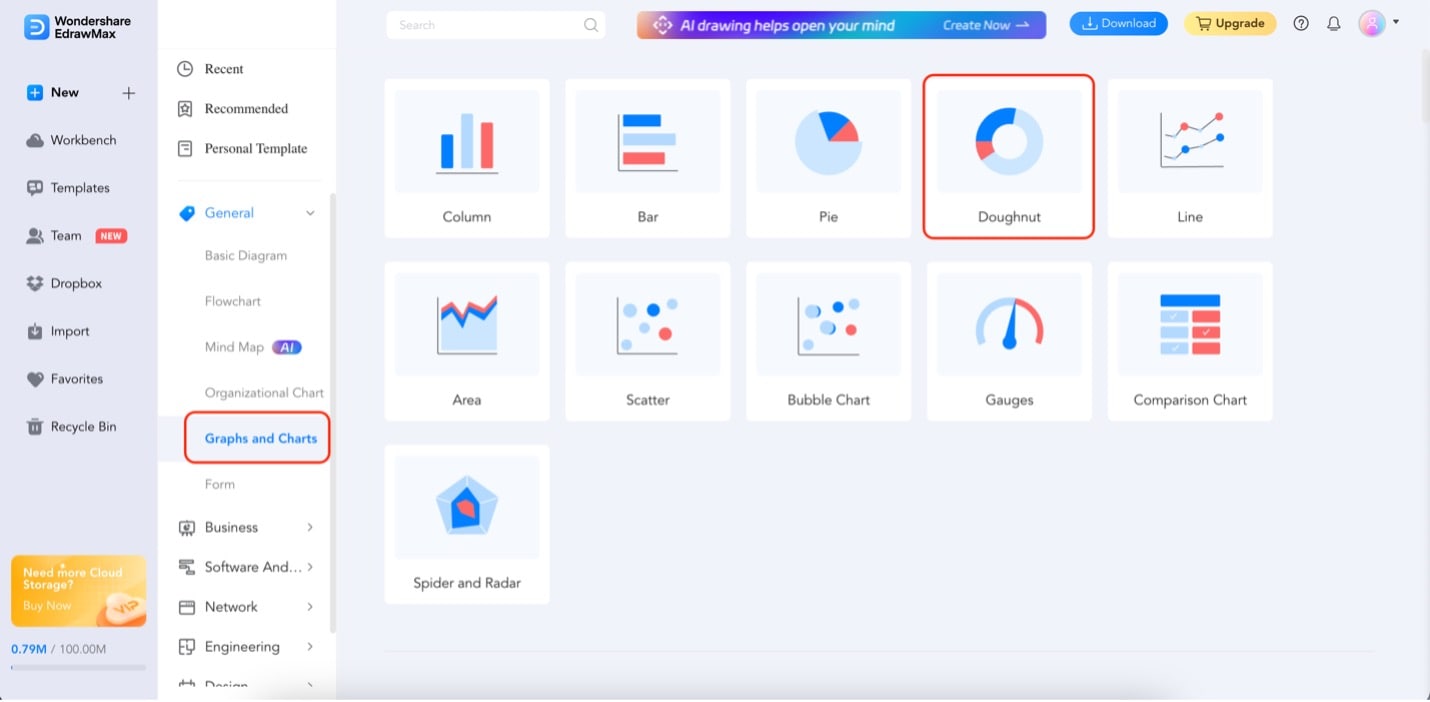
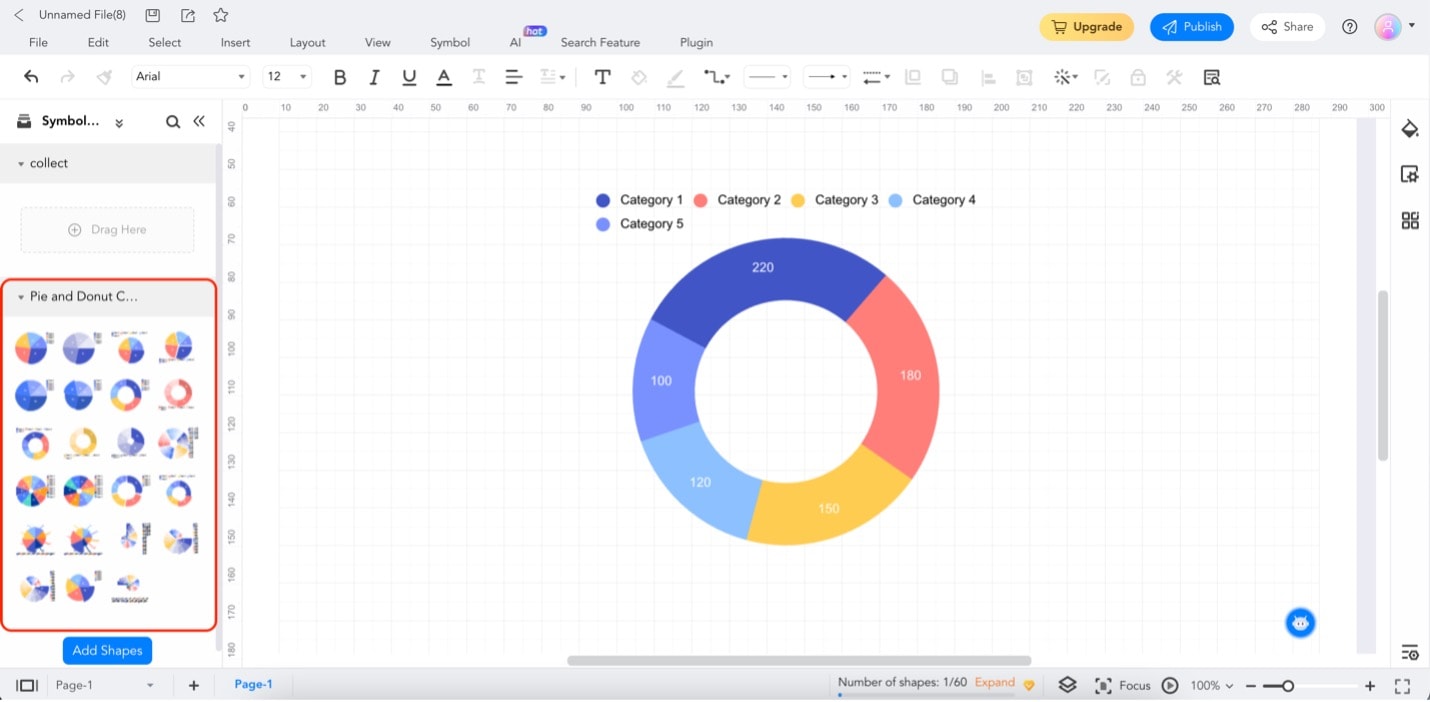
Under General, click Graph and Charts. Then, click Doughnut.
Step3
From the elements toolbar on the left, drag any doughnut chart template you want. You can also use this toolbar to add other details to your canvas.
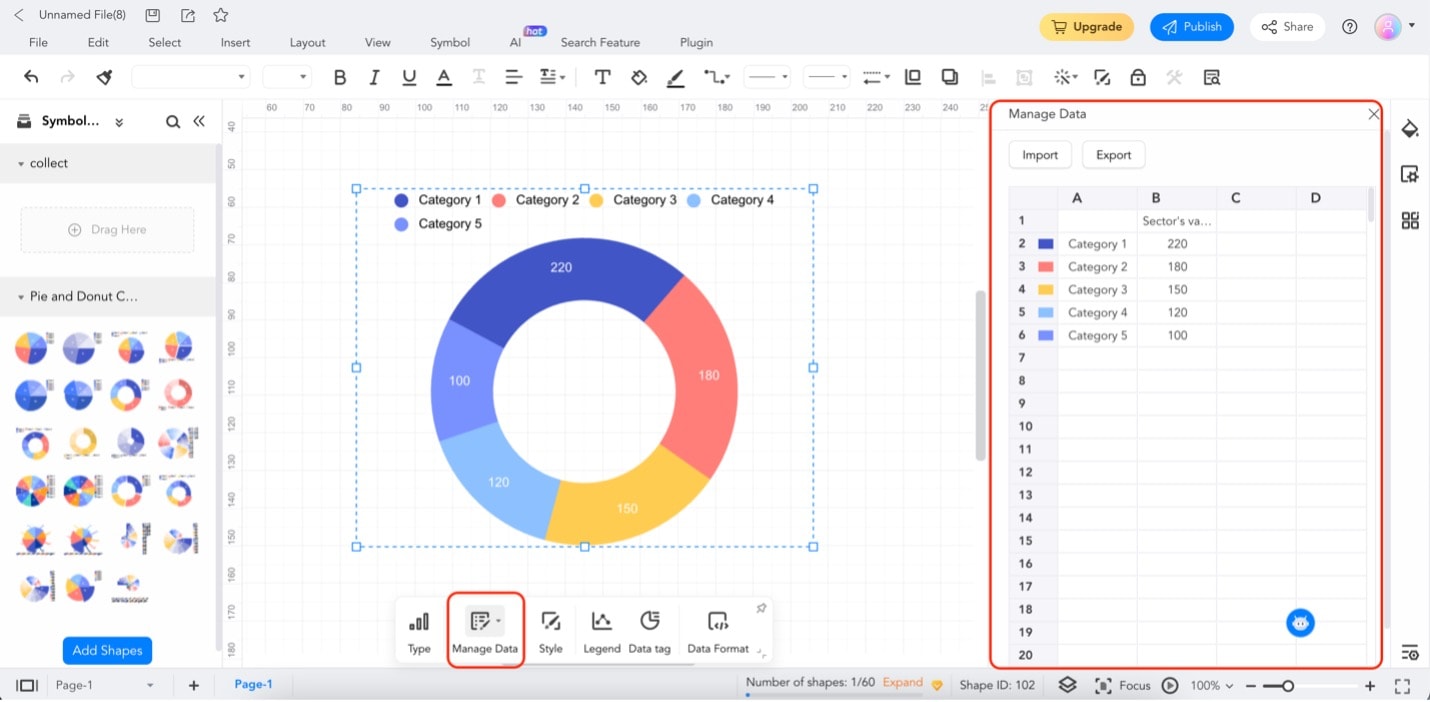
Step4
To change the chart values, click the chart. Then, click Manage Data on the appearing toolbar. Edit your data accordingly on the appearing sheet. Column A refers to the value label. Column B refers to the actual value. Delete or add data as needed. To change the color of each slice, use the color boxes on the left of each row.
Part III: Common Types of a Workflow Diagram
EdrawMax is an excellent alternative for creating doughnut charts in Excel. It has powerful features that give you a professional charting experience. Compared to using Excel, a dedicated spreadsheet app, EdrawMax is a fully-dedicated diagramming and charting app. This means that you can expect a fantastic experience while creating doughnut charts. To break it down:
- Professional Diagramming. EdrawMax is not just your average charting tool; it's a professional diagramming powerhouse. It offers a comprehensive platform to create various visual representations, including doughnut charts. With its user-friendly interface and robust features, you can take your charting skills to the next level.
- Free Version. EdrawMax offers a free online version with ample functionalities for creating impressive doughnut charts. You can get started without financial commitment and still achieve remarkable results.
- Abundance of Resources. EdrawMax has an extensive library of templates, symbols, icons, and more. This rich collection empowers you to customize your doughnut charts with various elements.
- Ease of Use. Whether you're a seasoned chart creator or a beginner, EdrawMax's intuitive interface ensures a smooth experience. Its drag-and-drop functionality and user-friendly tools streamline the chart-making process, allowing you to focus on crafting compelling visuals.
- System Compatibility. EdrawMax supports multiple operating systems, including Windows, macOS, and Linux. Hence, it's accessible to many users. This flexibility ensures you can work on your doughnut charts regardless of your preferred platform.
- AI Tools: EdrawMax AI can even make your doughnut chart creation faster. Ask it to fill up your chart's data, give suggestions, and more.
EdrawMax also boasts a solid G2 rating of 4.3, a testament to its reliability and user satisfaction. This rating reflects the positive experiences of users who have benefited from EdrawMax's features and functionalities.
If you want to create doughnut charts that truly stand out, EdrawMax offers the tools and resources to turn your visualization ideas into reality.
Part IV. Tips When Creating Doughnut Charts in Excel
Mastering the art of creating doughnut charts in Excel requires a blend of creativity and precision. Here are some handy tips to ensure your charts shine:
- Keep It Simple. When crafting doughnut charts, simplicity is vital. Avoid cluttering your chart with excessive data or elements. Stick to the essentials to ensure your audience quickly grasps your presentation information.
- Strategic Color Choices. Opt for a limited color palette to enhance readability. Choose appealing colors and effectively convey your doughnut chart's different segments.
- Label Thoughtfully. Labels are crucial for understanding chart components. Ensure your labels are concise, clear, and properly positioned to prevent confusion.
- Highlight Key Data. If there are specific data you want to emphasize, consider adjusting the size or color of specific segments. That draws attention to crucial information and aids comprehension.
- Using Other Apps To Create Pie Charts. If you're having difficulty making doughnut charts in Excel, use another charting app like EdrawMax. EdrawMax offers export options so you can add your diagrams to your sheets.
Conclusion
You've learned how to create doughnut charts in Excel, but to level up your charting game, use EdrawMax. While Excel is handy, it does have its limitations in terms of professional-level customization and design options. EdrawMax offers professional tools, free templates, and enhanced customization. It will empower you to create stunning doughnut charts that leave a lasting impact. Try it out now.
[没有发现file]