When creating a deployment diagram, users may face challenges in choosing a platform as well as understanding the various components that are involved in a deployment diagram. This article provides a step-by-step guide on creating a deployment diagram as well as introduces the various elements involved in making the diagram.
By the end of this article, you will learn how to create a deployment diagram on popular platforms like Visio and EdrawMax. The article will provide a step-by-step guide for you to create your diagram.
In this article
How to Draw a Deployment Diagram on Visio
1. Open the Template
Start by opening the Microsoft Visio application.
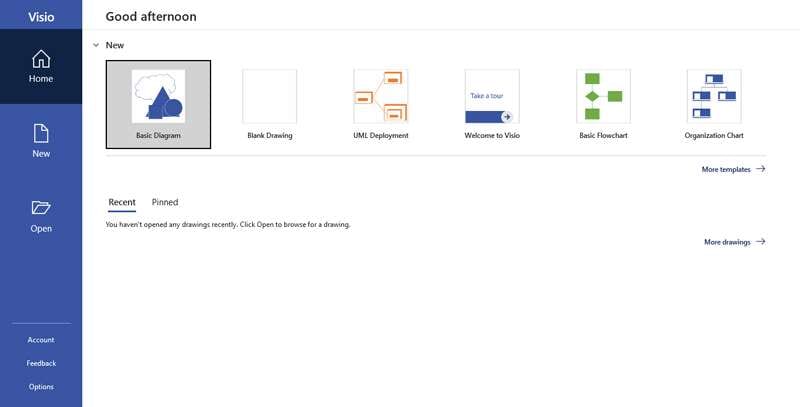
Select the New option present on the left side pane. In the search box, type “UML deployment diagram”.
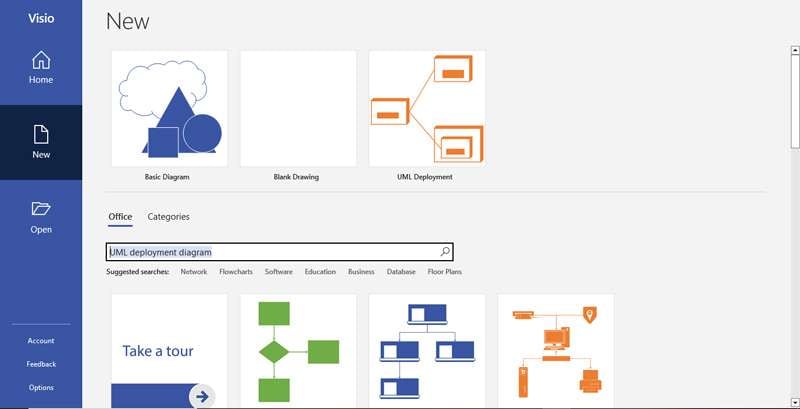
Click on the deployment diagram from the list of templates and select Create.
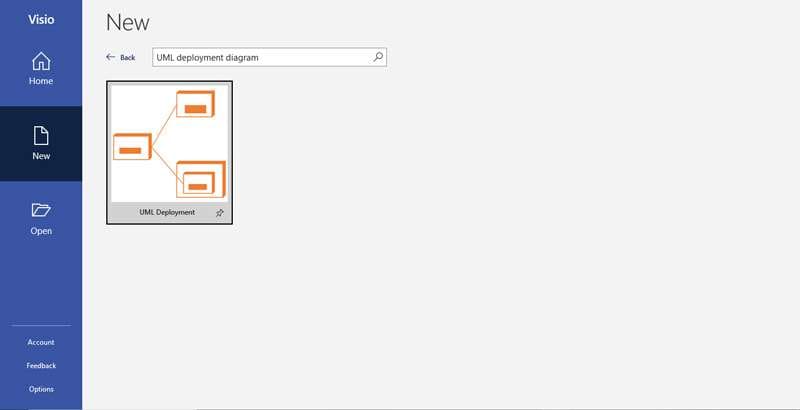
The template will open for you to design your systems design.
2. Place the Nodes
First, identify the hardware components within your system.
Select the New option present on the left side pane. In the search box type “UML deployment diagram”.
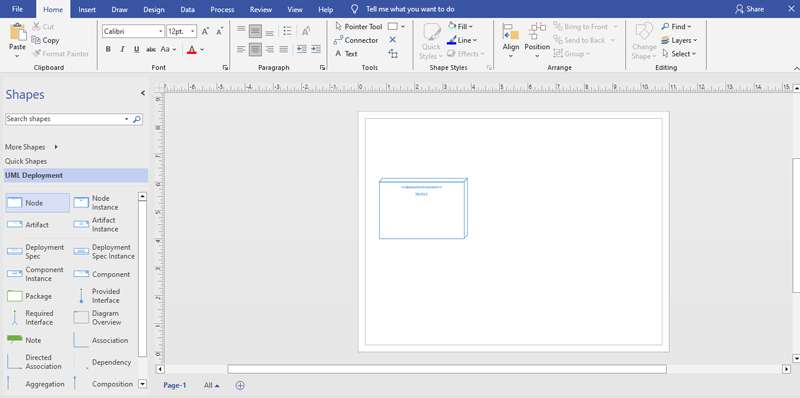
Double-click on the text field “Node” and enter the name of your node. Also, specify whether the node is a device or an environment.
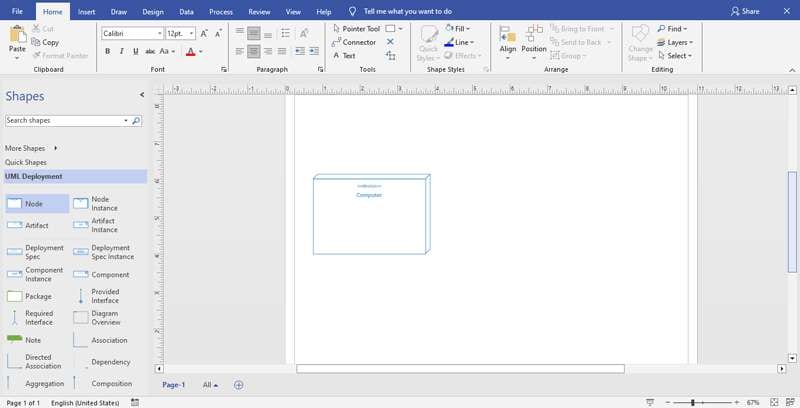
3. Place the Artifacts
First Identify the software components within the system.
Select Artifact from the shapes present on the left side pane. Then drag and drop the shape to your desired positioning.
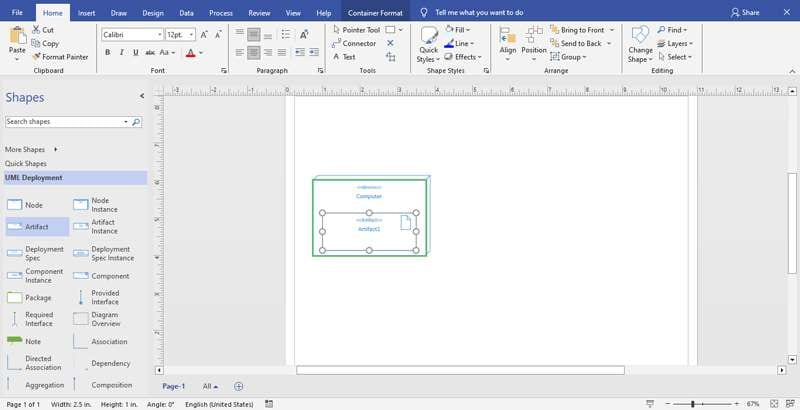
Double-click on the text field “Artifact” and enter the name of the artifact.
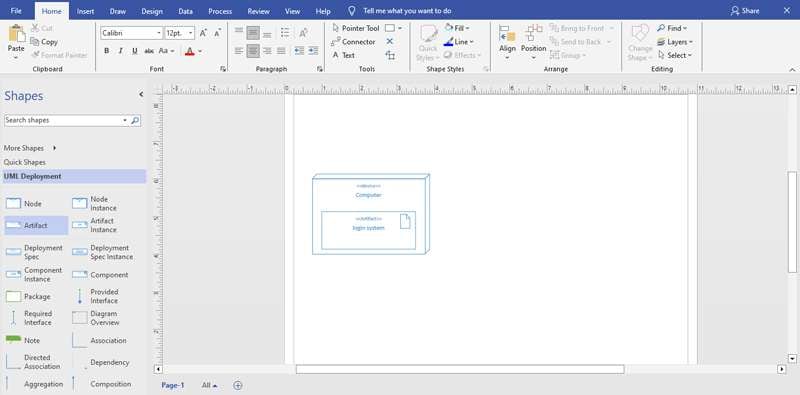
4. Add Interfaces
After you have designed the diagram. Identify the provided and required interfaces.
Drap and drop the provided and required interfaces from the left side pane, and place them on the specified nodes. Also, label the artifacts.
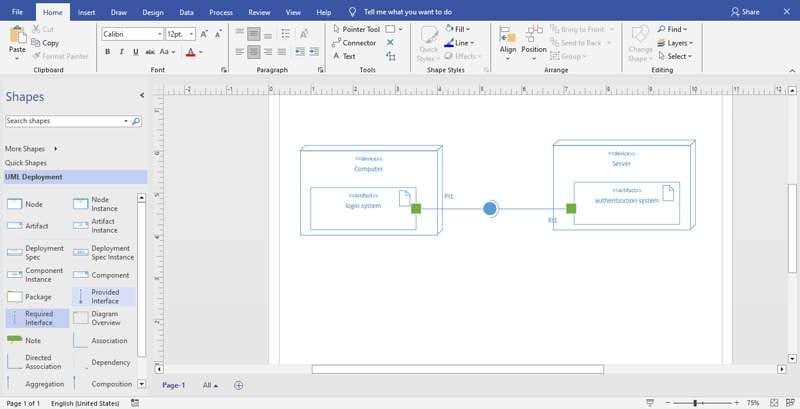
Also, Add labels to the interfaces.
5. Style the Template
Add colors to the respective elements. You can color the shape by selecting it, clicking on the fill option, and choosing the color.
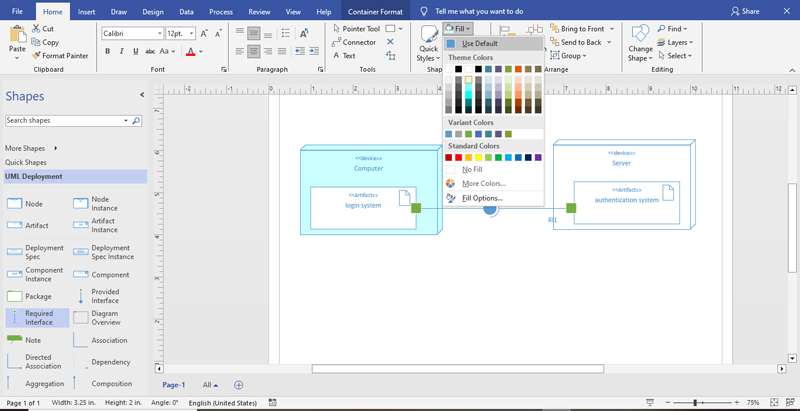
You can change the color of fonts by selecting the text and then clicking on the font color and choosing the color.
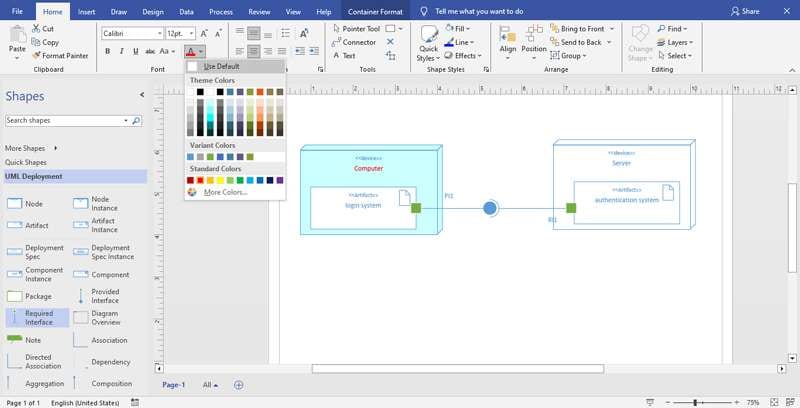
You can also change the font as well as the font size by selecting the text and choosing your desired format.
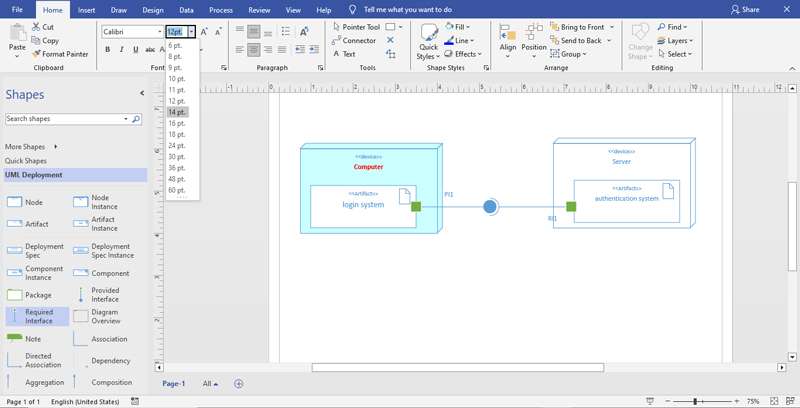
6. Save the Design
Once you are finished designing your diagram, click on the save icon present on the top-left side of the screen.
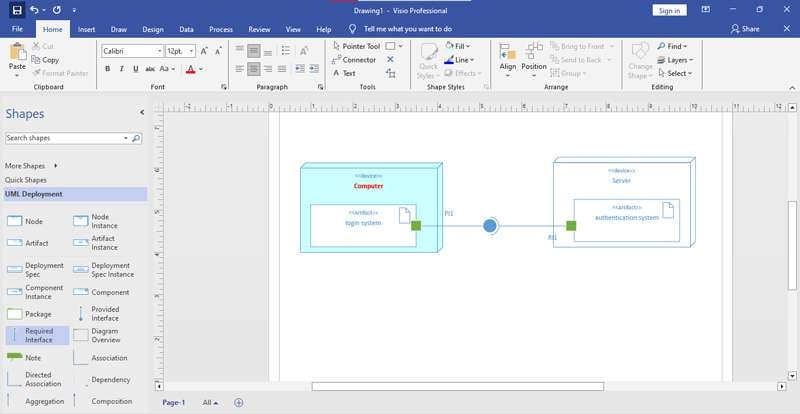
After that select the location and the format you wish to save your designed deployment diagram.

Congrats! You have successfully created your very own deployment diagram.
Components of the Deployment Diagram
1. Nodes
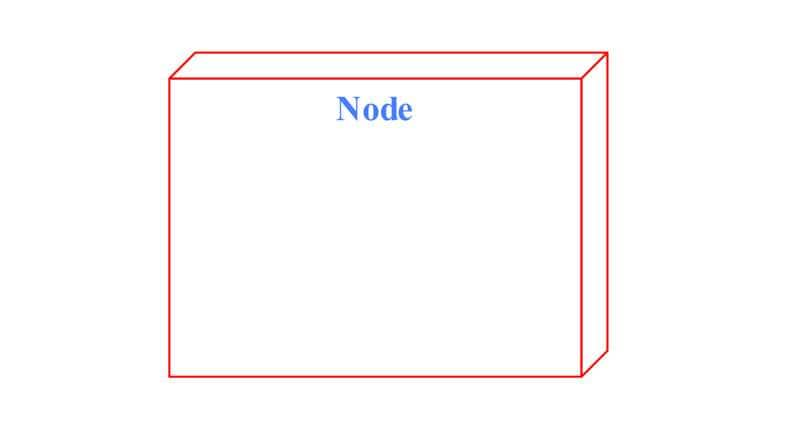
A node is used to represent the hardware component within a system. It may represent computers, servers, scanners, or any other hardware device that the system utilizes to achieve the overall functionality. It is represented using three-dimensional boxes. Each node is identified by a unique name written inside the three-dimensional box.
2. Artifacts
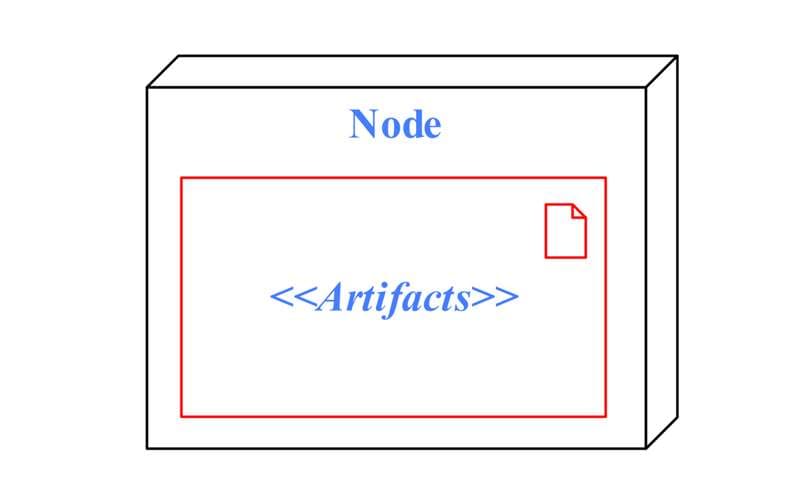
An artifact is used to represent the software or implementation units within the system. An artifact can be a library, software components, executable files, or even databases. It is represented using a rectangular shape. An artifact is placed inside the node or in the physical hardware component it's stored in.
3. Component
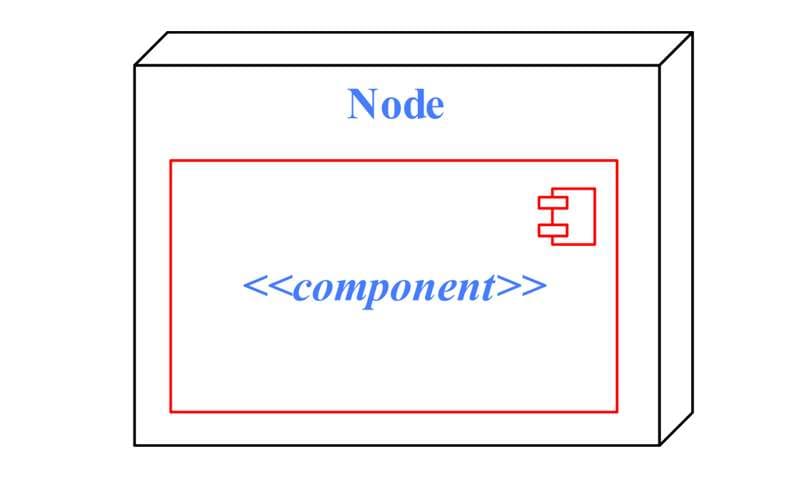
A component is used to represent the modular part of a system. It's used to break down a large system into smaller chunks which makes it easier to understand the functionality of a system. It is represented using a rectangular shape and using the keyword component. The name of the component is written within the rectangular box.
The purpose of using components within a deployment diagram is to model the software modules and how they are deployed on the hardware devices.
4. Interfaces
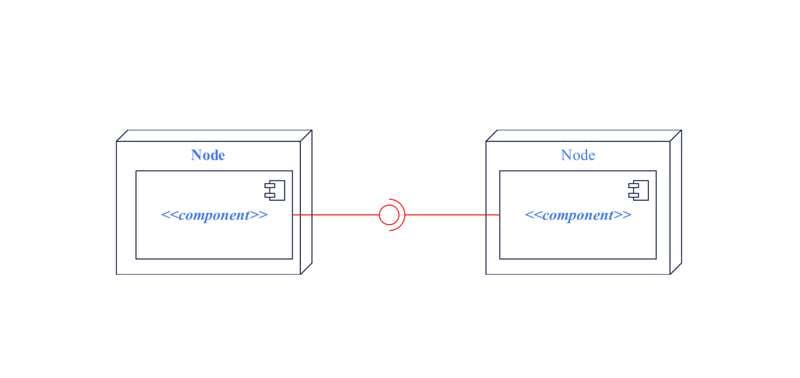
An interface is used to represent the interaction among various components within a deployment diagram. There are two types of interfaces. The provided interface is represented using a circle or lollipop-like shape and the required interface is represented using a socket.
The provided interface is used to depict that the system is offering some functionality. On the other hand, the required interface indicates that the system requires a certain functionality to execute.
5. Hierarchal Nodes and Package
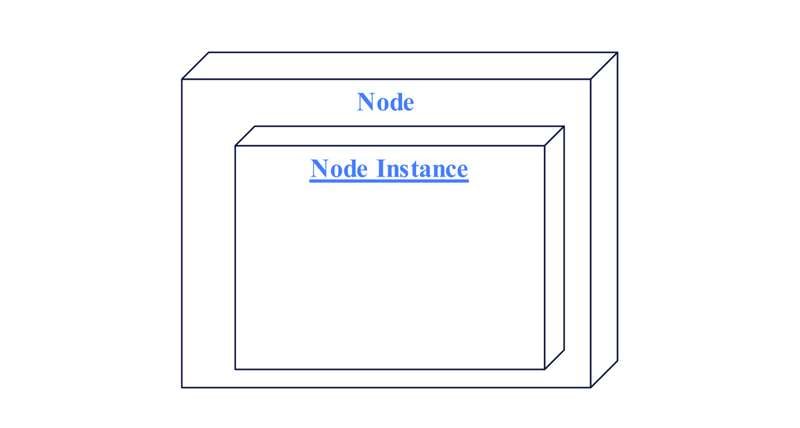
A node can be nested inside another node in a deployment diagram. This is known as a hierarchal node. The node is used to represent how different hardware components are nested inside a particular node..
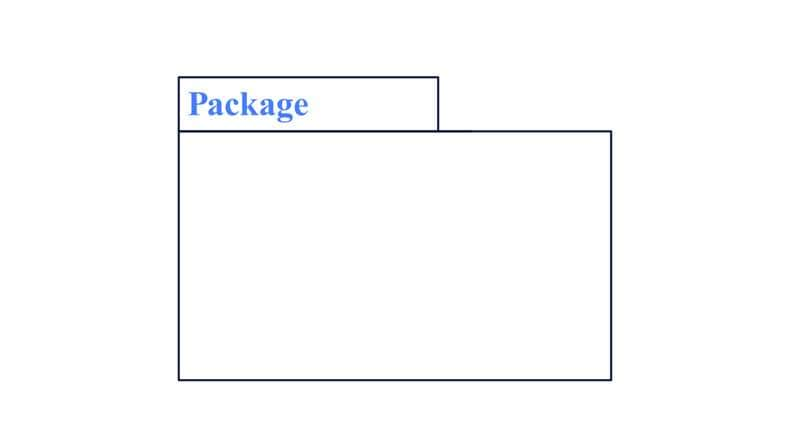
A package groups related elements within the system. A package may include classes, interfaces, artifacts, and nodes. These help in organizing large systems and shapes.
What is EdrawMax
EdrawMax is a free-to-use online platform where you can design your system or organization's architecture with easy-to-use design templates. Here you can choose your template design from the various categories offered by the platform. The user-friendly interface further simplifies the diagram creation process.
The platform also supports collaboration through the use of a cloud-based workspace where team members can share their progress and work towards the same project.
EdrawMax is cross-platform, meaning it is available on Mac OS, Windows, and even on Linux. Also, through the implementation of cloud-based architecture you can access, edit, and manage your designs from anywhere around the world. Also, once you’re done, you can export your work in various formats like JPG, PNG, PDF, Word, Excel, PPT, HTML, and more
How to Create a Deployment Diagram on EdrawMax
Step 1:
First, open your EdrawMax desktop application or EdrawMax web diagram access.
Step 2:
On the home page, select the templates option from the left side pane. Here search for UML deployment diagram on the search bar present at the top of the page.

Step 3:
Explore various design templates present on the platform. Select and click on one of the templates. Then press Use immediately present on the top of the page.
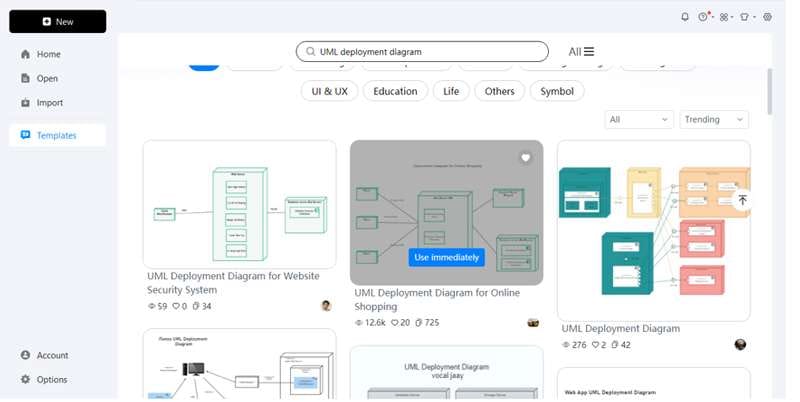
Step 4:
After the template opens, you can customize the diagram by dragging and dropping new shapes from the libraries present on the left side.
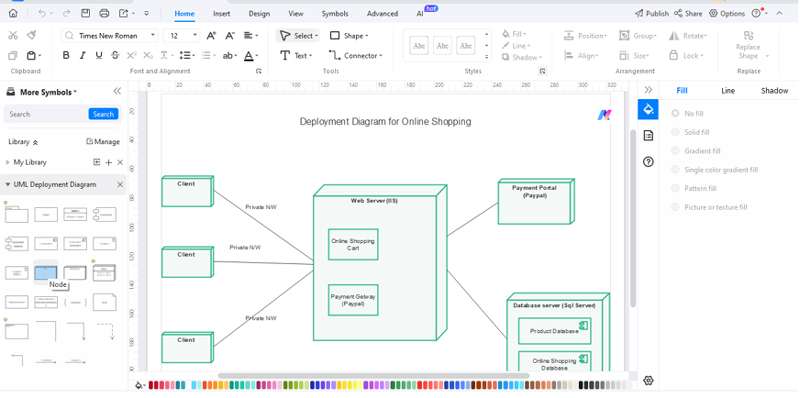
Step 5:
You can also remove un-required shapes by simply selecting the shape and then pressing the delete key present on your keyboard.
Step 6:
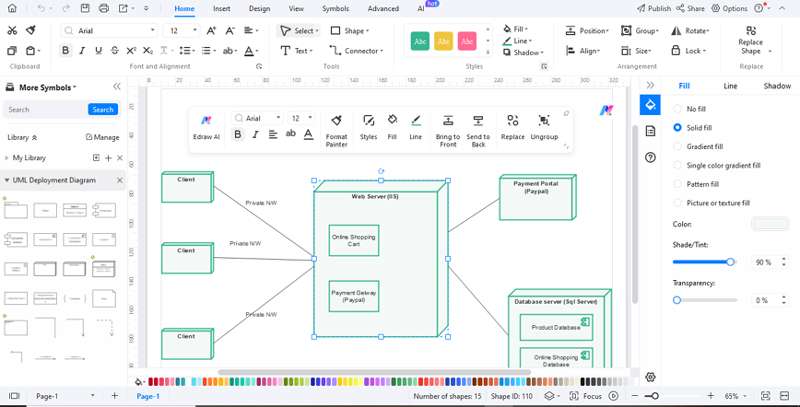
Edit the text. Style the lines, boxes, and text by clicking on the respective elements. You can also save some common elements in your libraries for future use.
Step 7:
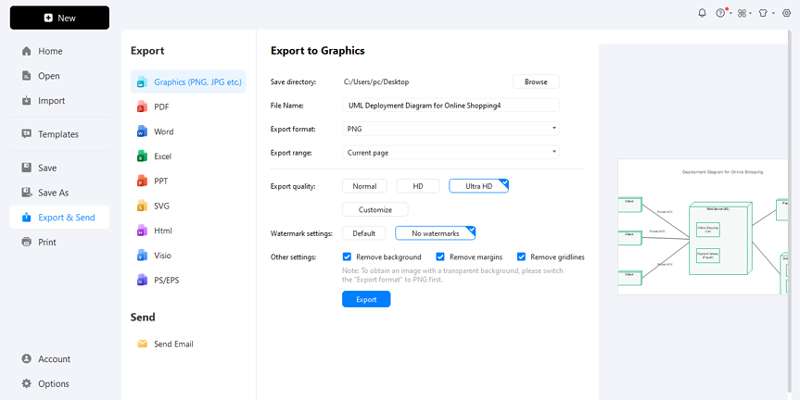
Choose a format to save it for later or share it with others. Click on Options then Export&Send to choose the format of your file (.eddx, .pdf, .png, .jpg) to export the file.
Conclusion
For understanding and modeling the physical distribution of various software components to hardware nodes; it is mandatory to draw a UML deployment diagram. Microsoft Visio and EdrawMax are tools that can be used in the creation of these diagrams, and this article gives step by step guide on how to go about creating them.
EdrawMax is a free-to-use online platform where you can design your system or organization's architecture with easy-to-use design templates. EdrawMax is cross-platform, meaning it is available on Mac OS, Windows, and even on Linux. Also, through the implementation of cloud-based architecture you can access, edit, and manage your designs from anywhere around the world. Plus, it's free to use so why not?


