


DFDs are a fundamental tool in systems analysis and design, aiding in the visualization of data flow within a system. In this comprehensive article, we'll unravel the layers of DFDs, from zero level DFD (Context level diagram) to the finer-grained Level 2 and beyond. Whether you're a budding analyst or a seasoned professional, this guide will equip you with the knowledge needed to decipher complex DFDs effectively.
Gain the skills to streamline data analysis, enhance system comprehension, and optimize your design processes as you dive on this journey through learning various DFD levels.
In this article
Part 1. Different Levels in Data Flow Diagrams (DFD)
A Data Flow Diagram (DFD) is a visual representation used in systems analysis and design to depict how data flows within a system. It consists of processes, data stores, data flow arrows, and external entities. Processes represent tasks or functions, while data stores indicate where data is stored within the system.
Data flows are arrows connecting these components, illustrating the movement of data between them. DFDs provide a clear and concise way to understand and communicate how data is processed, transformed, and stored within a system, making them a valuable tool for system analysis and design.
Here are the different levels in data flow diagrams (DFD):
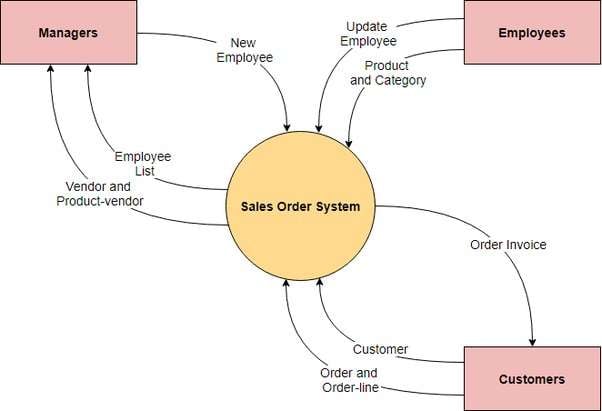
Level 0 DFD: A zero level DFD or context level diagram is the highest abstraction level, depicting the entire system as a single process. A context level data flow diagram highlights the interactions between the system and external entities. provides an overview of the entire system, portraying it as a single process. It showcases how external entities interact with the system, offering a bird's-eye view of data flow. Here is the snapshot of a context diagram level 0:
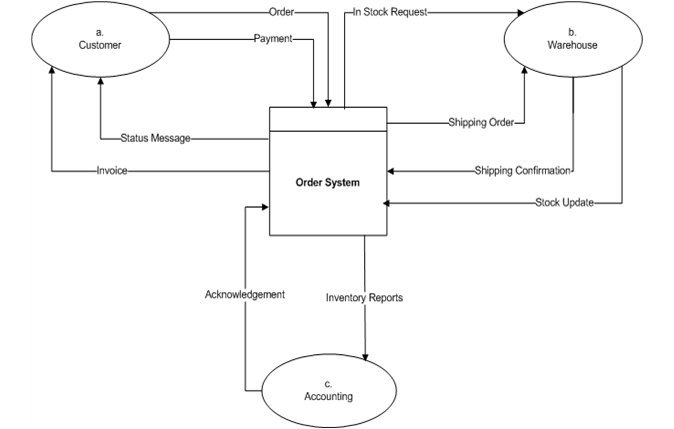
Level 1 DFD: A 1-level DFD provides a detailed breakdown of the processes in the Level 0 DFD. It further decomposes the main processes into sub-processes, showing more granularity. It goes deeper into the processes outlined in Level 0. It breaks down main processes into sub-processes, offering a more detailed view of data flow. Here is a level 1 DFD example:
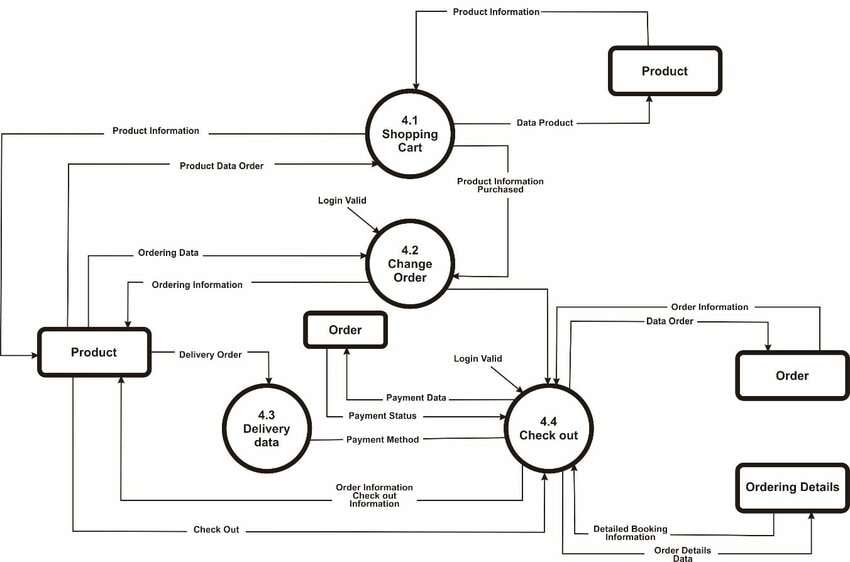
Level 2 DFD: The 2-level DFD further decomposes Level 1 processes into sub-processes, enhancing granularity and revealing intricate data exchanges and transformations within the system. This level provides a deeper understanding of system functionality. Here is a level 2 DFD example:
Part 2. How to create a high-level Data Flow Diagram Using EdrawMax
Whether you want to create a context level diagram or a high-level Data Flow Diagram (DFD), EdrawMax offers a straightforward process.
Follow these steps to efficiently construct a visual representation of data flow within a system:
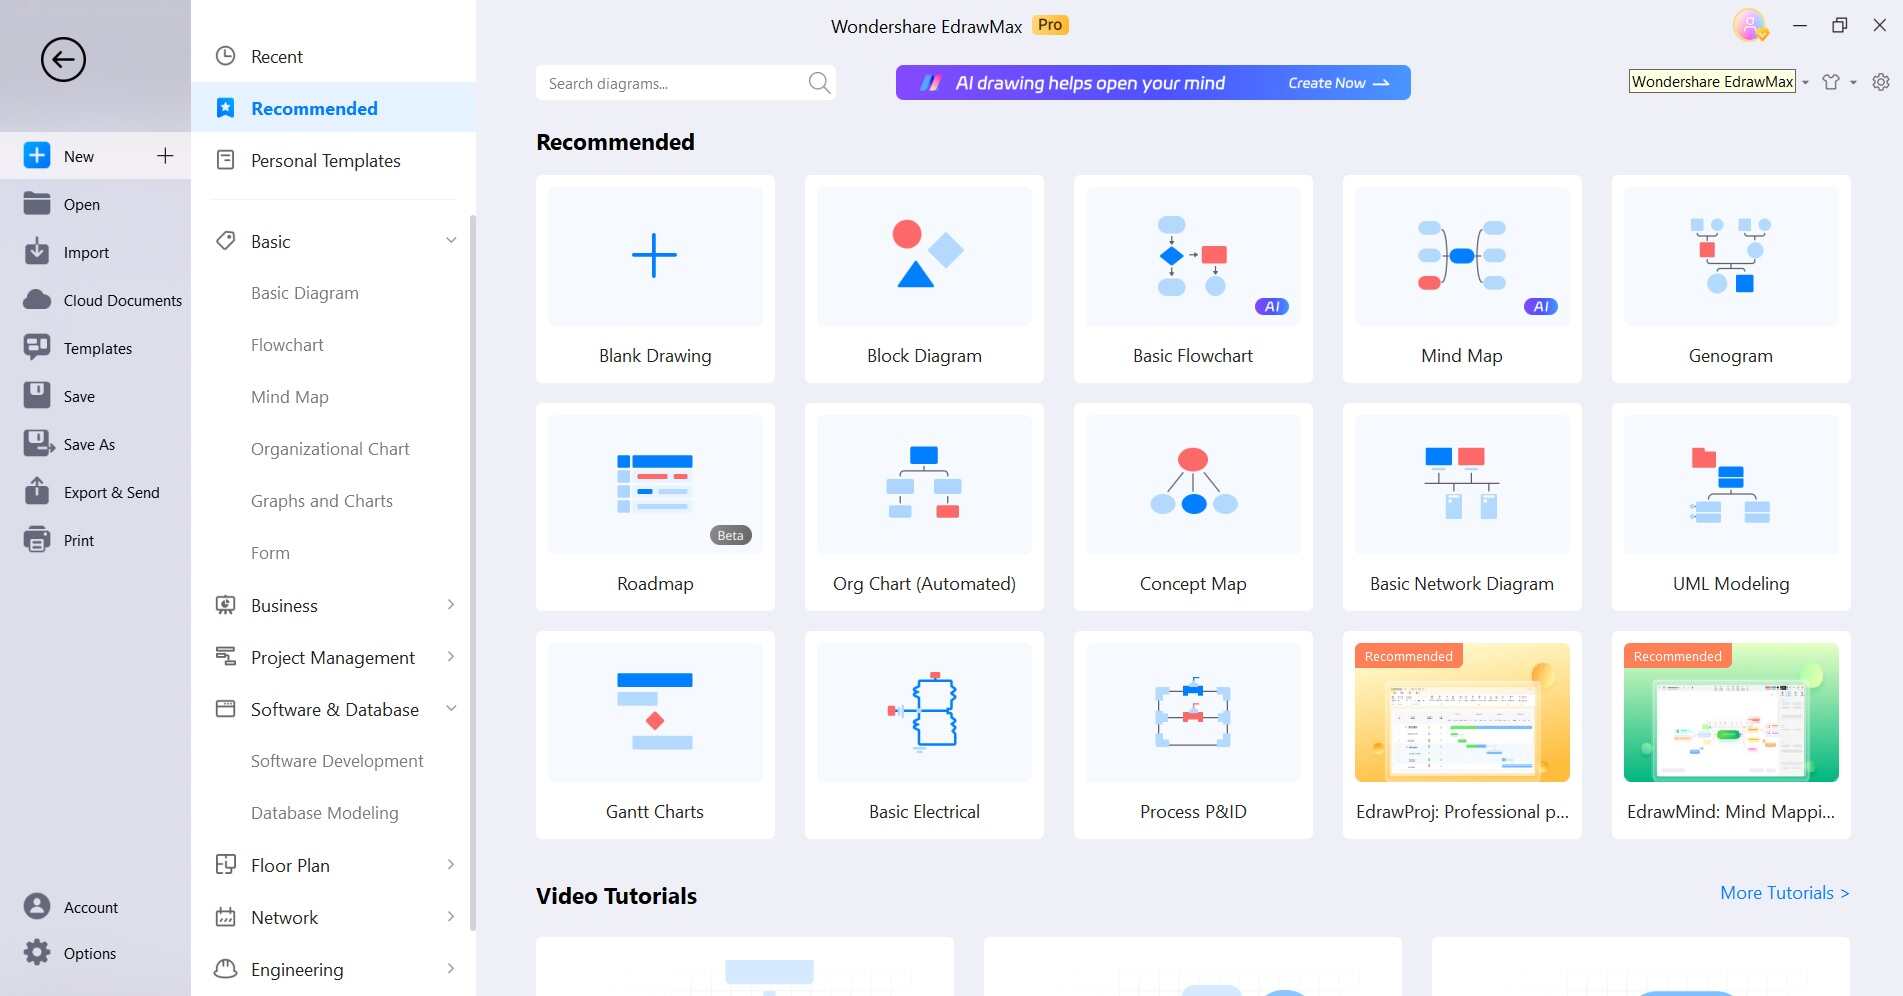
Step 1: Launch EdrawMax, navigate to the "File" menu and select "New." Then, choose the "Flowchart" category and select a suitable DFD template from the template community. For example, you might choose a template for a "Library Management System" to illustrate how books are borrowed, returned, and stored in a library. These templates not only expedite the process but also offer valuable insights into best practices for creating effective DFDs.
Step 2: Identify the external entities that interact with the system. These can be clients, customers, or other systems. Drag and drop the external entity shapes onto the canvas.
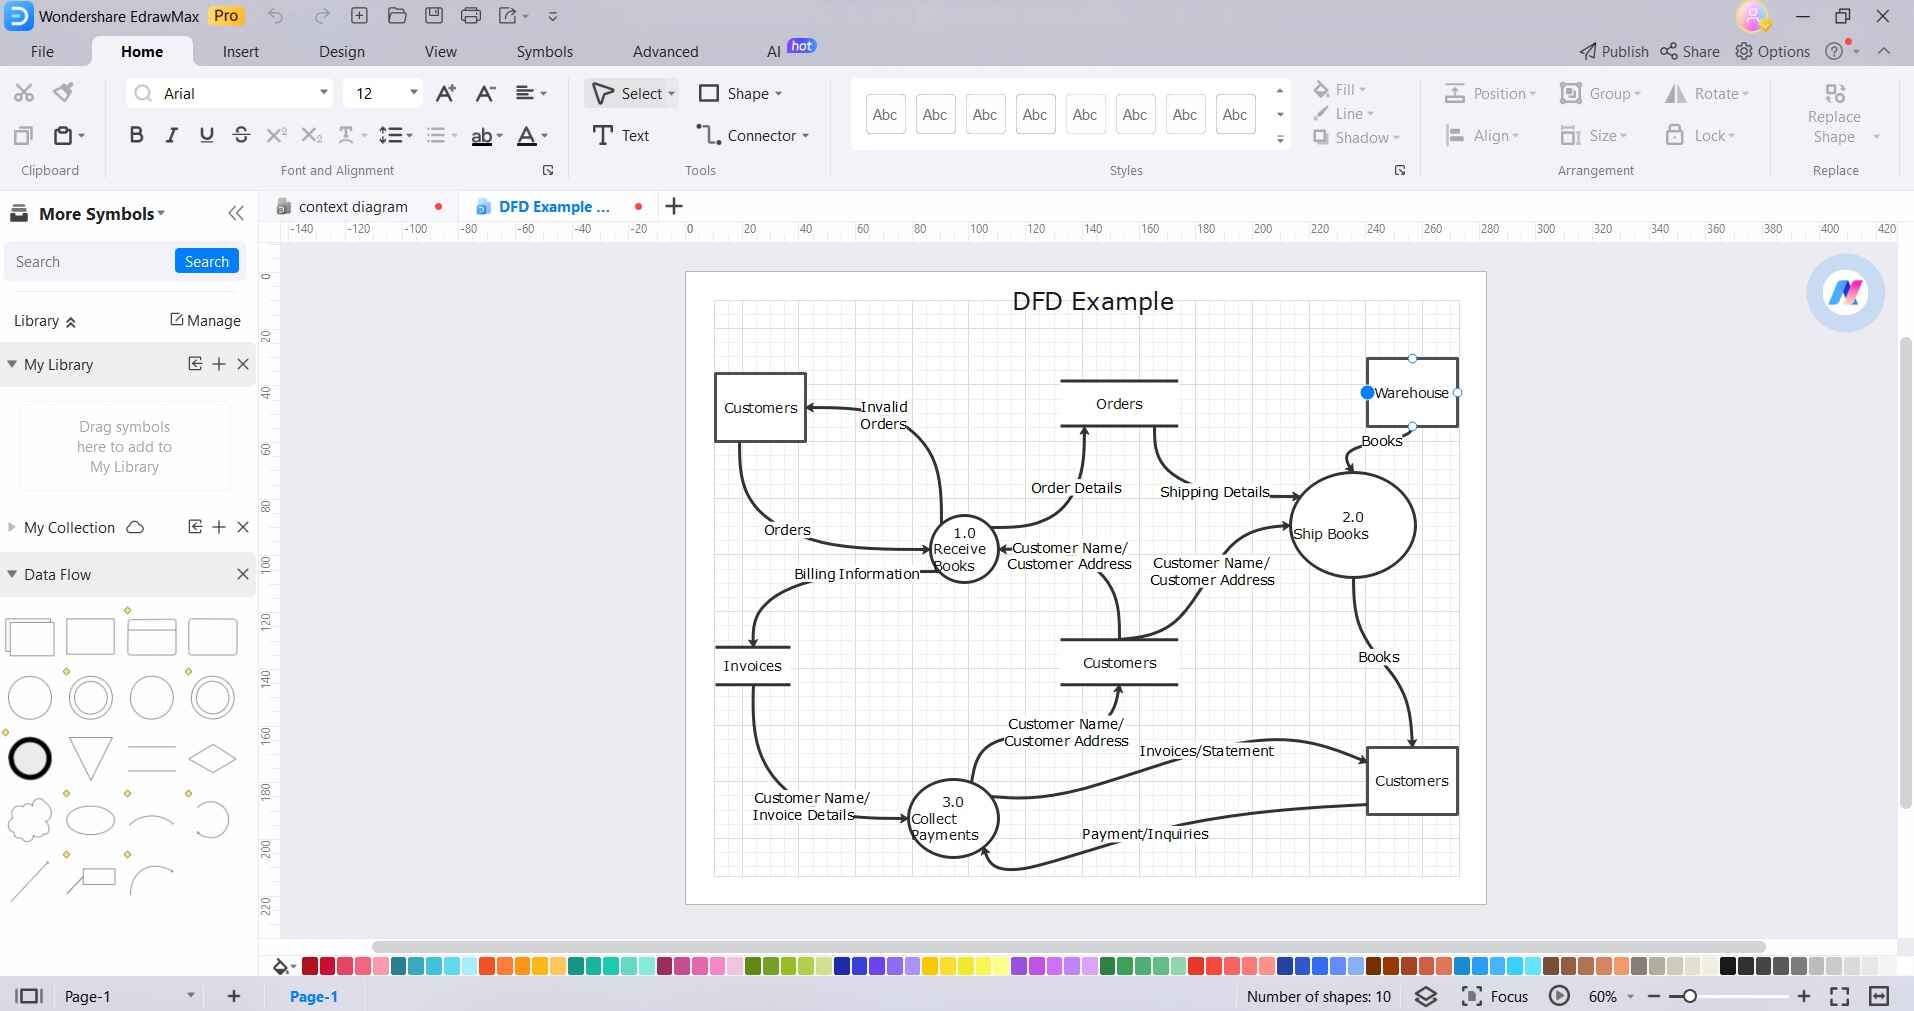
Step 3: Introduce processes to the diagram, representing the functions or activities that occur within the system. Drag process shapes from the symbol library and position them appropriately concerning the external entities.
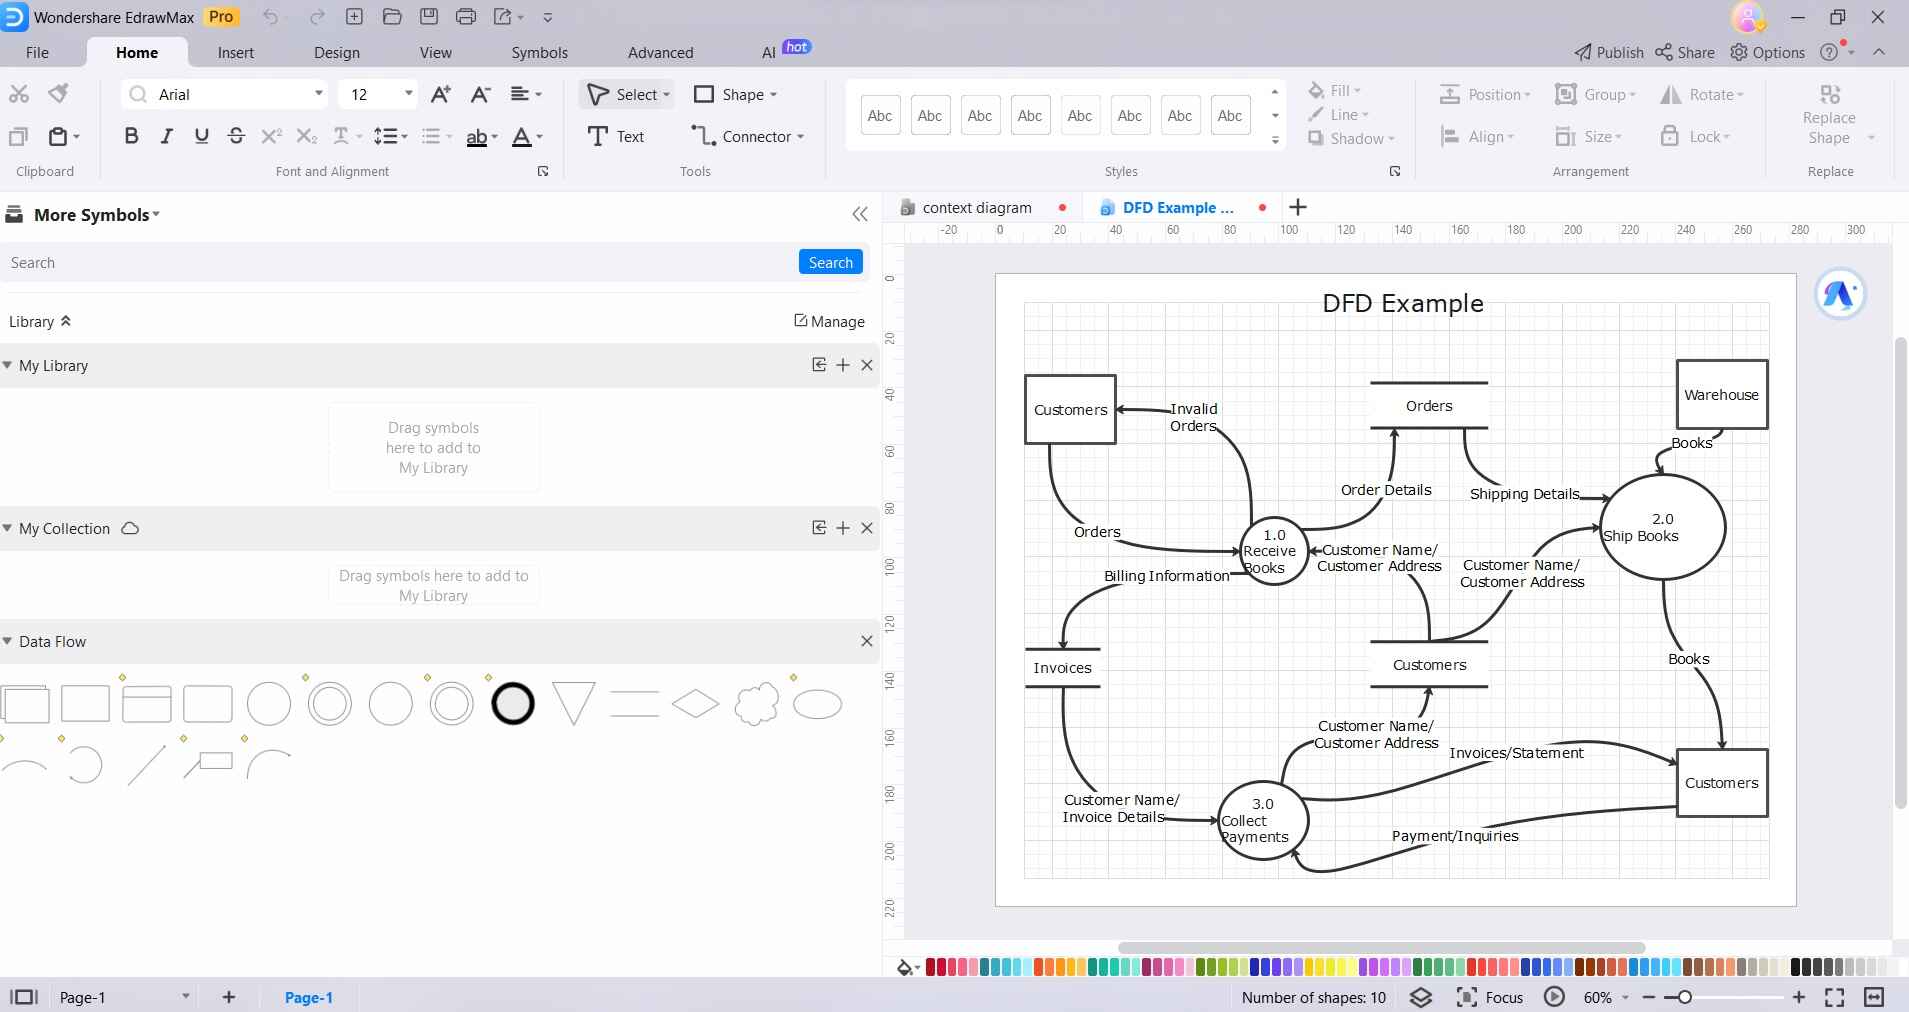
Step 4: Utilize arrows to illustrate the flow of data between external entities, processes, and data stores. Click and drag from one shape to another to create these data flow connections.
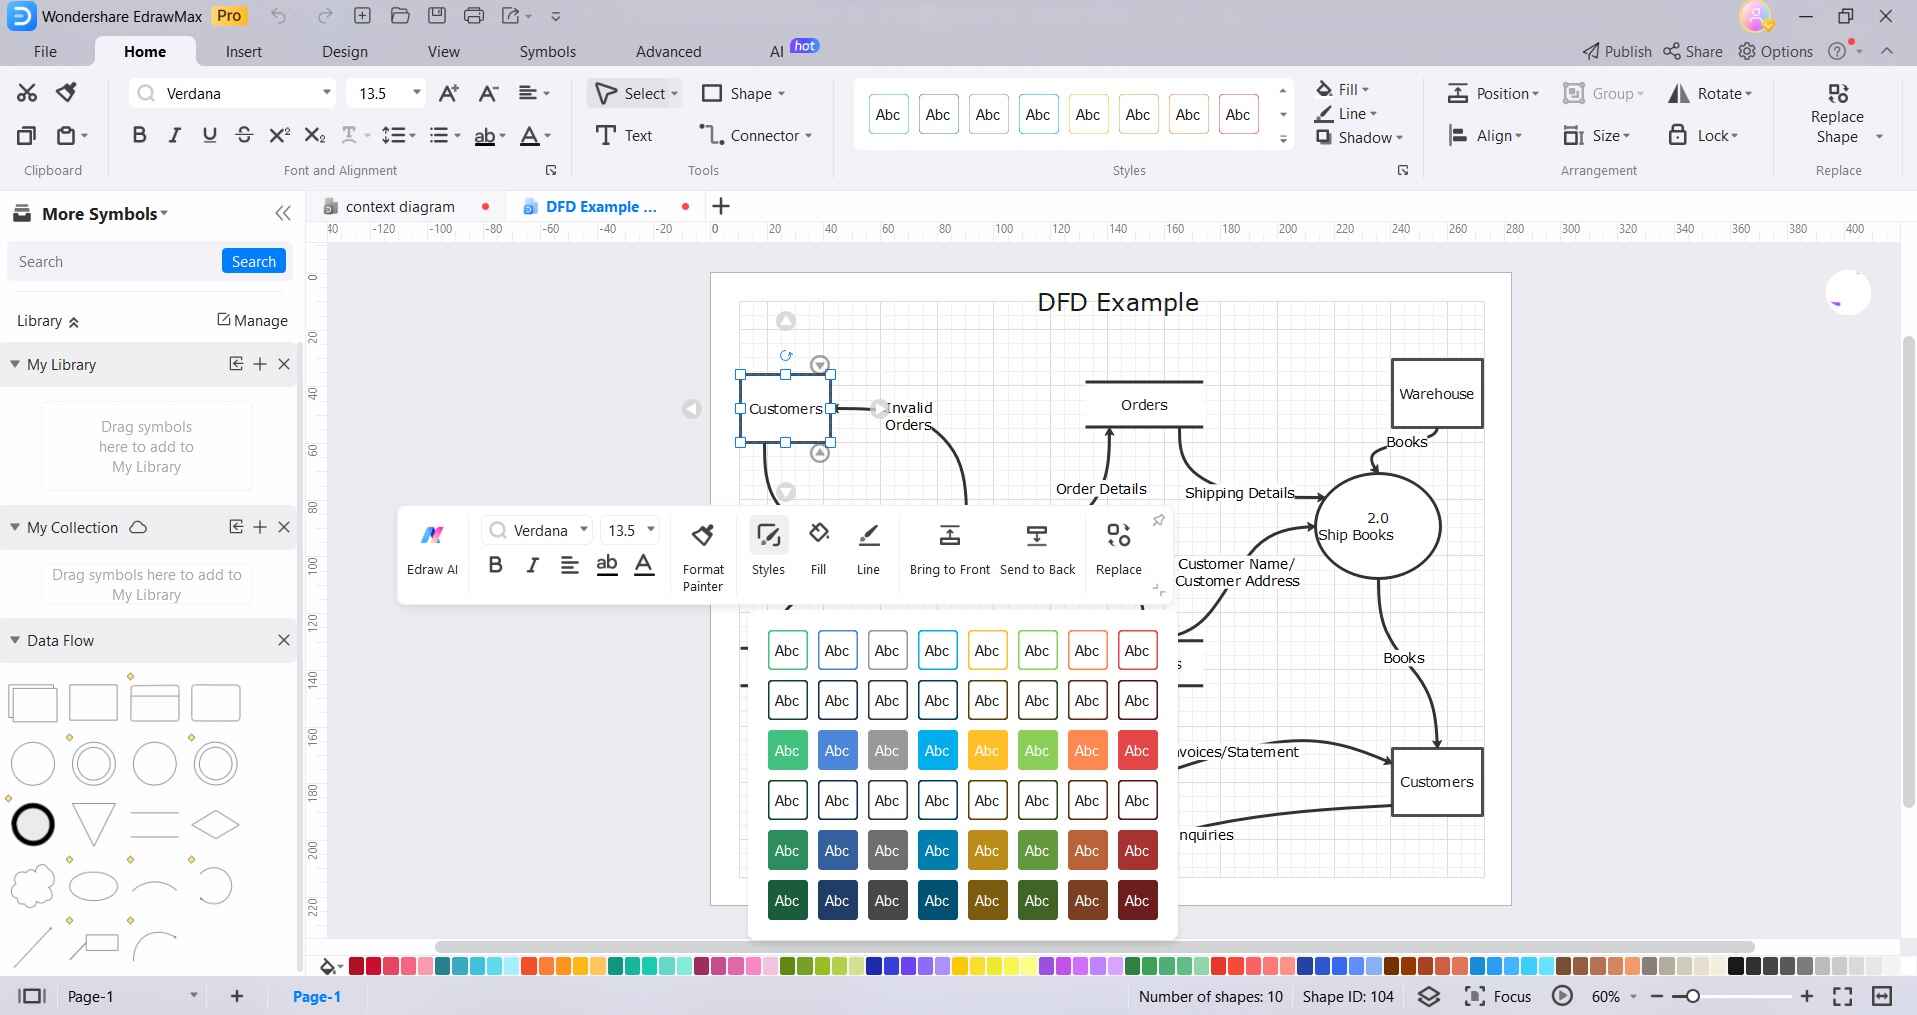
Step 5: Take a moment to review the diagram for accuracy and clarity. To format an entity, click on it and select “Styles”. Ensure that the connections accurately represent the flow of data within the system. Make any necessary adjustments, if required.
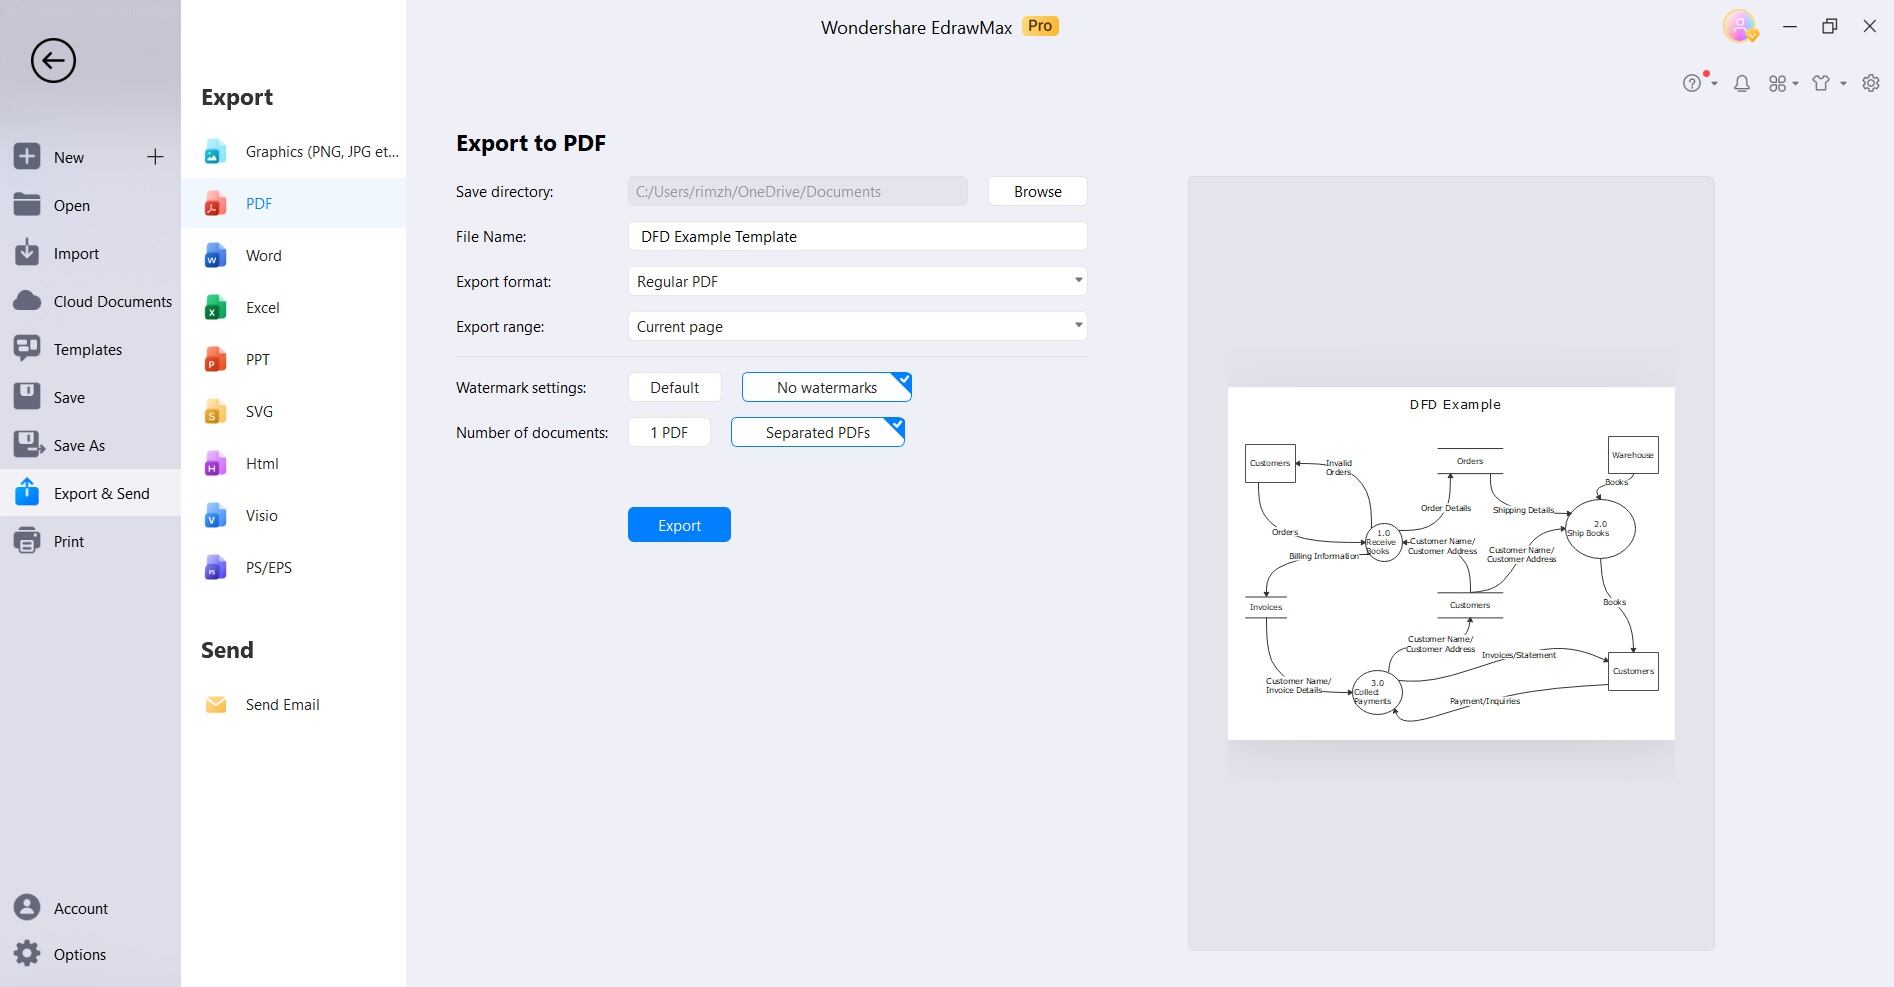
Step 6: Once satisfied with the DFD, save the project in a preferred format. EdrawMax supports various file formats for easy sharing and collaboration.
By following these steps, you can swiftly create a high-level Data Flow Diagram using EdrawMax. Additionally, EdrawMax's template community provides a range of pre-designed templates that can serve as starting points.
Part 3. Best Data Flow Diagram Tools Enhance Productivity
Mastering the art of constructing Data Flow Diagrams equips professionals with a powerful tool for analyzing, designing, and optimizing systems. Each tool brings its unique strengths to the table, ensuring that users have ample options to choose from.
EdrawMax offers an intuitive interface for creating Data Flow Diagrams with extensive symbol libraries. It supports multiple file formats and provides collaboration features, making it a versatile choice for diagramming needs.
With EdrawMax, crafting different levels of Data Flow Diagrams (DFDs) is intuitive. Start with zero-level DFD, adding external entities and core processes effortlessly. Transitioning to 1-level DFD, decompose processes seamlessly. EdrawMax's user-friendly interface ensures a smooth progression from high-level overviews to detailed system breakdowns.
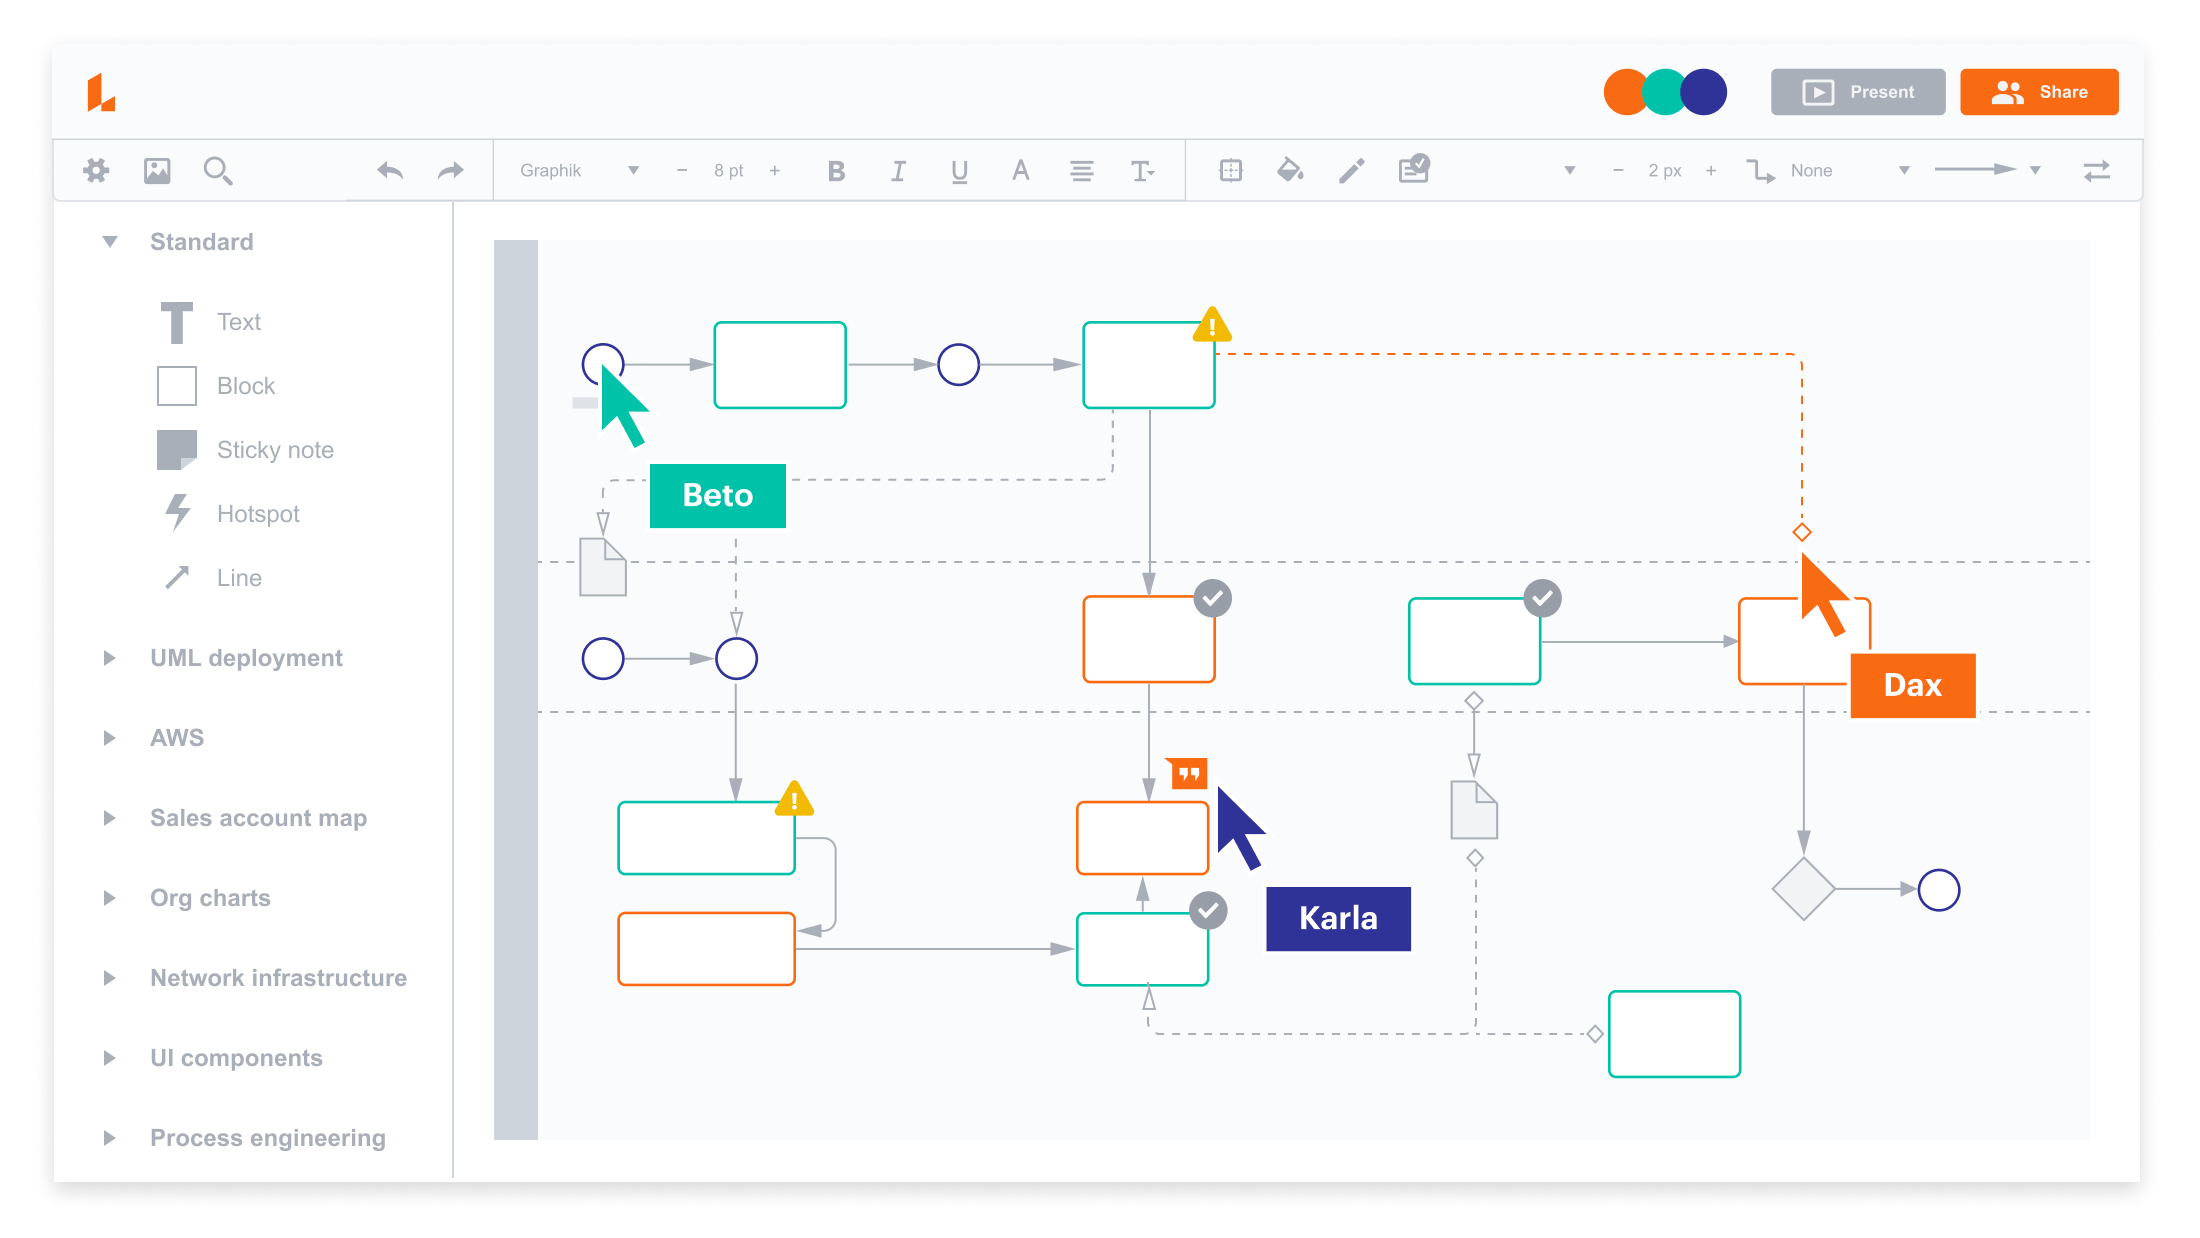
Lucidchart provides a cloud-based platform for creating dynamic Data Flow Diagrams. It offers real-time collaboration, drag-and-drop functionality, and integration with popular tools like Google Workspace and Microsoft Office.
-
Creately is an online diagramming tool that simplifies the process of creating Data Flow Diagrams. It offers a vast library of shapes and templates, along with collaboration features for team projects.

-
Draw.io is a free, web-based tool for creating Data Flow Diagrams. It provides a user-friendly interface, supports various file formats, and allows for easy export to platforms like Google Drive, Dropbox, and more.

Conclusion
Understanding Data Flow Diagrams (DFDs) is pivotal in system analysis and design. From the high-level overview of Level 0, which establishes system boundaries, to the detailed breakdowns of Level 1, 2, and beyond, each level provides a deeper understanding of how data flows within a system. EdrawMax, with its user-friendly interface and extensive template library, emerges as an excellent tool for creating context level diagrams.
By following the outlined steps, one can efficiently construct a high-level DFD, facilitating clearer communication of complex system processes. The inclusion of external entities, processes, and data stores, along with the connections denoting data flow, results in a comprehensive visual representation.
AI Diagram Generator
Enter your prompt. Upload files if needed. Generate diagrams, charts, or slides instantly.


