


Introduction
Explaining intricate software engineering concepts can be tough. Isn’t it? Yet, Data Flow Diagrams (DFDs) present a valuable solution. DFD in software engineering acts like roadmaps, illustrating how information flows within a system. They're vital tools for explaining complex concepts. Imagine them as guides for engineers, making their work much smoother.
This visual roadmap simplifies comprehension, aiding software engineers in tackling complex tasks effectively.
In this article
What is a Data Flow Diagram?
A Data Flow Diagram (DFD) visually depicts how data moves within a system or project. It's a crucial tool in business analysis and software development. DFD diagram in software engineering includes four main components: processes, data flows, data stores, and external entities. They offer a structured view of complex systems, aiding both technical and non-technical individuals in grasping and enhancing projects or systems through insights into data flow.
Benefits of data flow diagrams
Data flow model in software engineering can provide you with many benefits. Here are some of the important benefits of DFD.
- DFDs establish clear project or system boundaries, defining scope.
- They differentiate internal system components from external entities, aiding in project management.
- DFDs simplify communication by visually representing complex processes. This facilitates discussion and understanding among team members, clients, and users.
- They serve as blueprints, showcasing the logical flow of data and operations.
- Analysts can identify potential obstacles, redundancies, or inefficiencies in processes.
- DFDs provide a structured, visual representation of system elements, interactions, and data transformations.
Data Flow Diagram Examples in Software Engineering
Data Flow Diagrams play an important role in software engineering, enabling the clear visualization of complex processes. Data Flow Diagrams are an essential feature in software engineering, and here are some data flow diagram examples in software engineering.
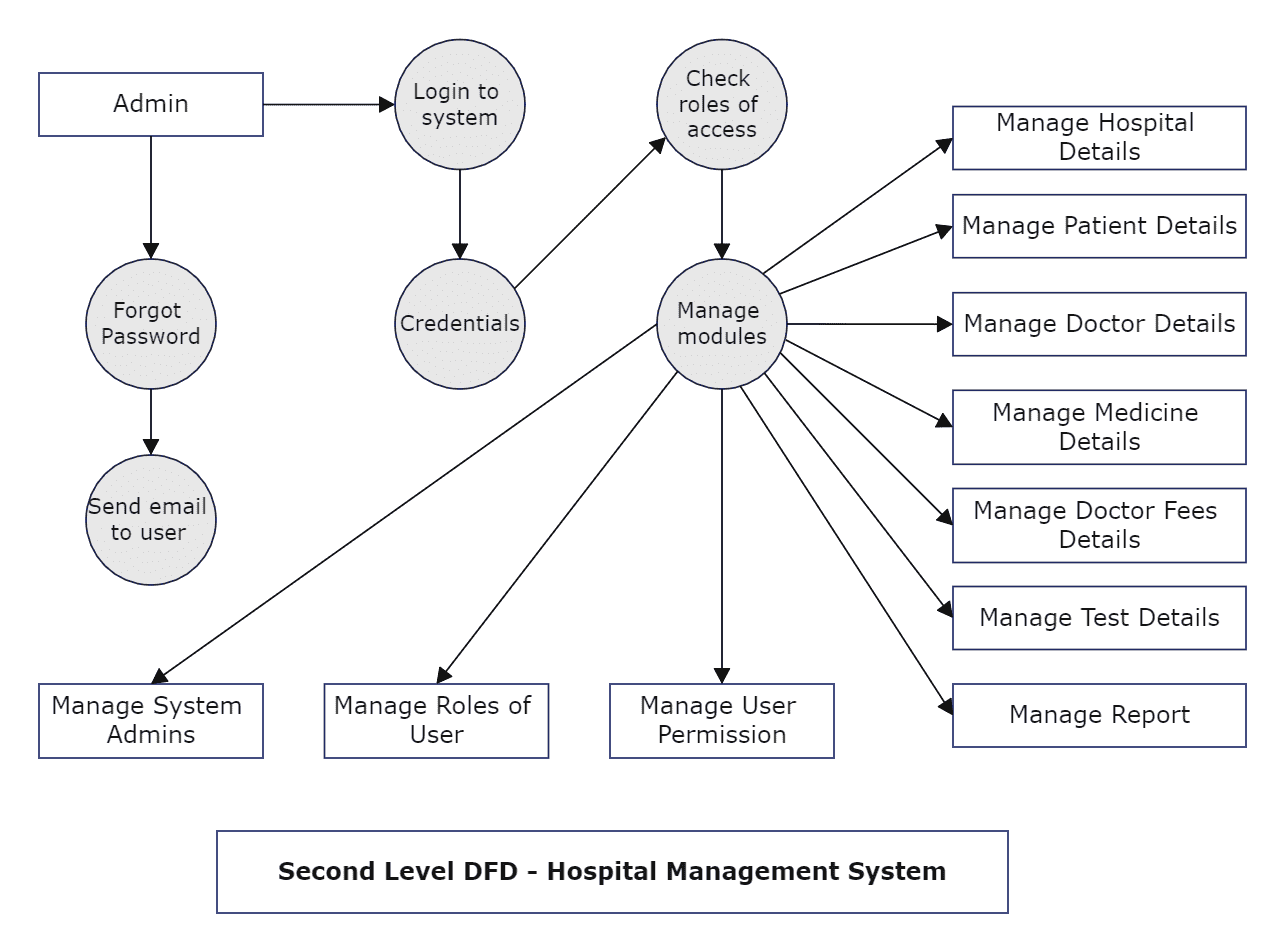
1. Hospital Management System DFD
DFD diagram is a high-level overview of hospital operations and focuses on aspects like medicine, tests, and fees. It makes a complex healthcare system easy for various users. This DFD example in software engineering can help you create DFD diagrams related to any hospital management project.
2. Online Shopping DFD
This diagram is the DFD for the online shopping process, focusing product delivery and order confirmation. It presents the system as a single high-level process and enhances your understanding.

Rules and Levels for Making Data Flow Diagrams
These rules must be followed while creating a DFD model in software engineering to ensure its accuracy and effectiveness.
- Data Flow Direction: The data should always flow from entities to processes or from processes to entities. Multiple data flows can exist between entities and processes.
- No Direct Entity Flow: You must remember that the data must not flow directly from an entity to a data store. A process should be done before entering or leaving a data store.
- Input and Output Flows: Each process should have at least one input data flow and one output data flow to represent data processing.
- Special Names: All elements within the DFD must have special names to avoid confusion and ensure clarity.
Data flow diagrams in software engineering offer a hierarchical description of a system's functioning. These DFD levels serve various functions in the analysis and design processes.
1. Level 0 DFD:
The DFD at Level 0 here the parts collapsed into smaller, more abstract parts, the related data flow might require to be dissected.

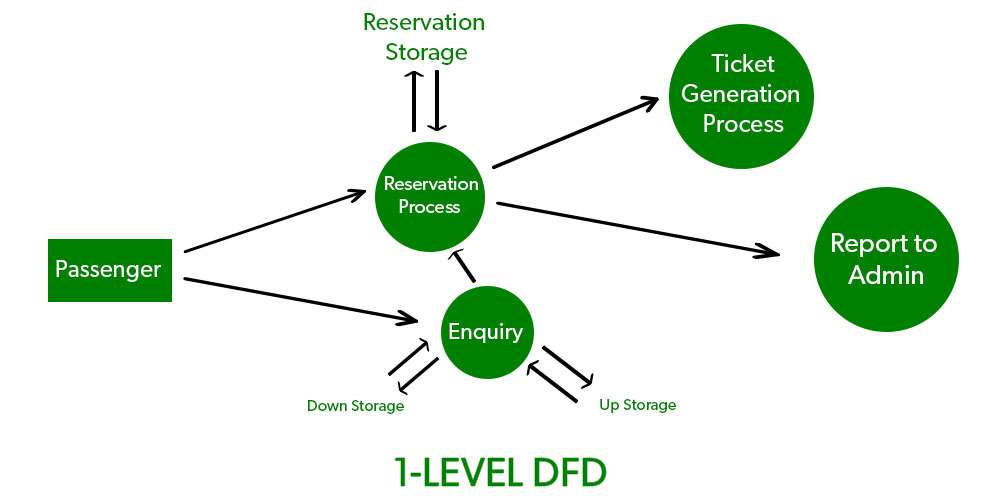
2. Level 1 DFD:
It is divided into many parts in 1-level DFD. At this level, we underline the system's primary objectives and break the overall procedure of 0-level DFD into sub-parts.
3. Level 2 DFD:
These diagrams further reduce the Level-1 DFD into more detailed sub-parts. 2-level DFD goes additionally into parts of 1-level DFD. It can be used to project details about how the system works.

How to Create a Data Flow Diagram in Software Engineering?
The steps of Creating a DFD Diagram in Software Engineering.
- Specify the System Boundaries: Determine what the system includes and what external entities interact.
- Identify Processes: Define the primary processes in the system. These are acts or transitions that occur.
- Identify Data Flows: Determine how data flows between processes, data stores, and external entities.
- Identify Data Stores: Determine where data is stored within the system.
- Draw the DFD: You must begin with a context diagram, then a Level 0 diagram, and continue breaking operations into lower-level diagrams until the system is fully depicted.
Online Data Flow Diagram Maker – Wondershare Edrawmax
Wondershare Edrawmax is a useful online tool for quickly creating data flow diagram in software engineering. This product provides you with diagramming features and Edrawmax is accessible to users of all levels of skills because of its user-friendly interface and wide selection of templates and symbols.
It enables you and your teams to communicate complicated information efficiently and enables clarity and understanding in projects, processes, and systems.
Here are the steps on how to use EdrawMax to create data flow diagram examples in software engineering:
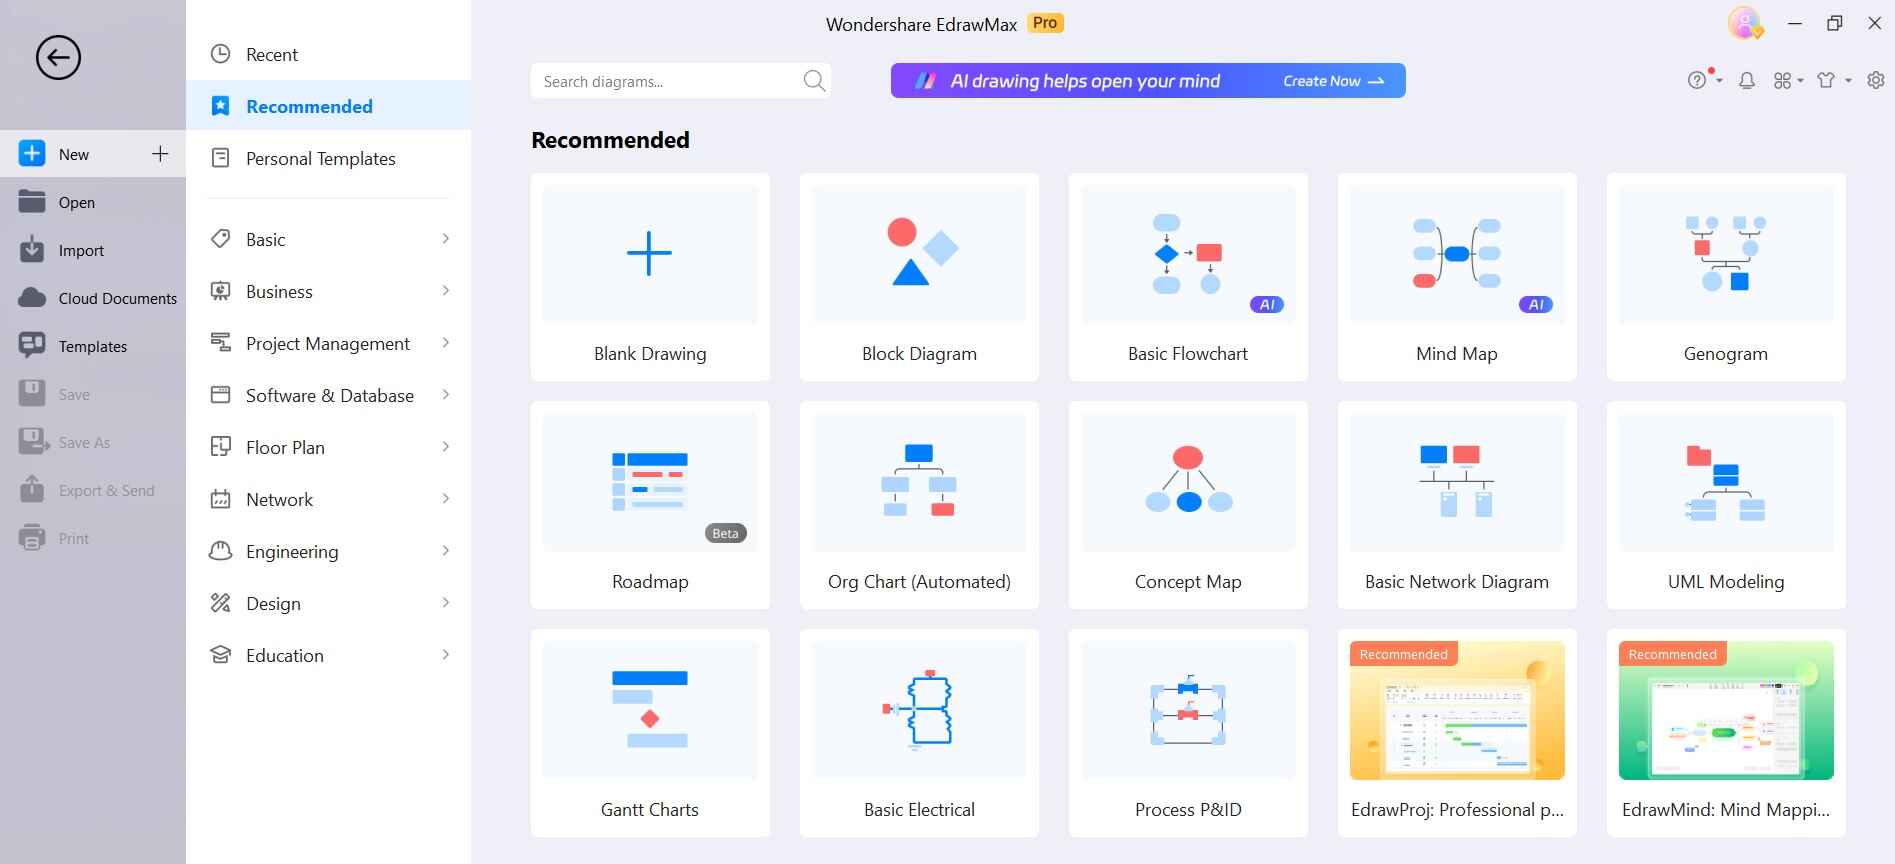
Step 1: Launch the EdrawMax software on your computer.
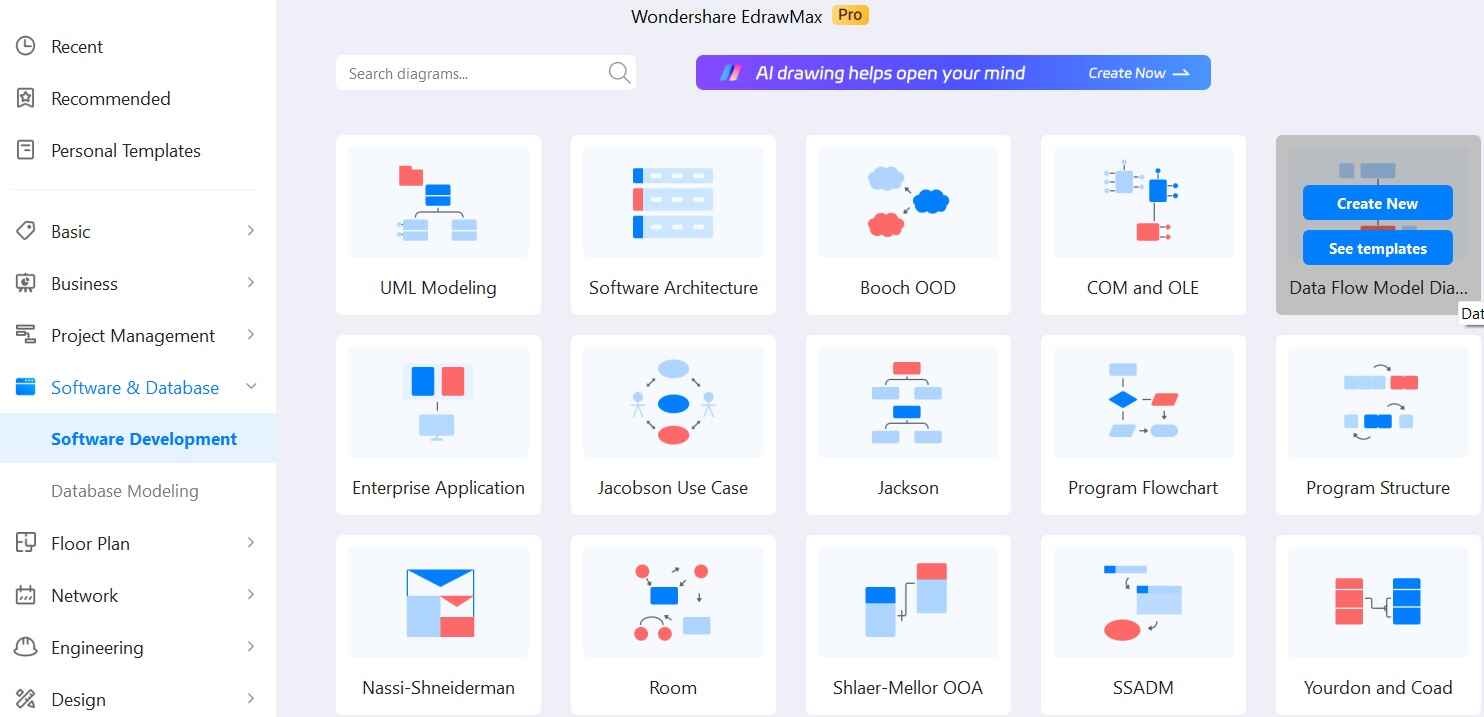
Step 2: Next, choose "Software and Database" followed by "Software Development." Click on the "Data Flow Model Diagram" option located in the upper-right corner. From here, you have the choice to either initiate a new project or browse through existing templates. Select your preferred option to continue.
Step 3: Under the “Data Flow Model Diagram” section, you will see various shapes, entities, and arrows.
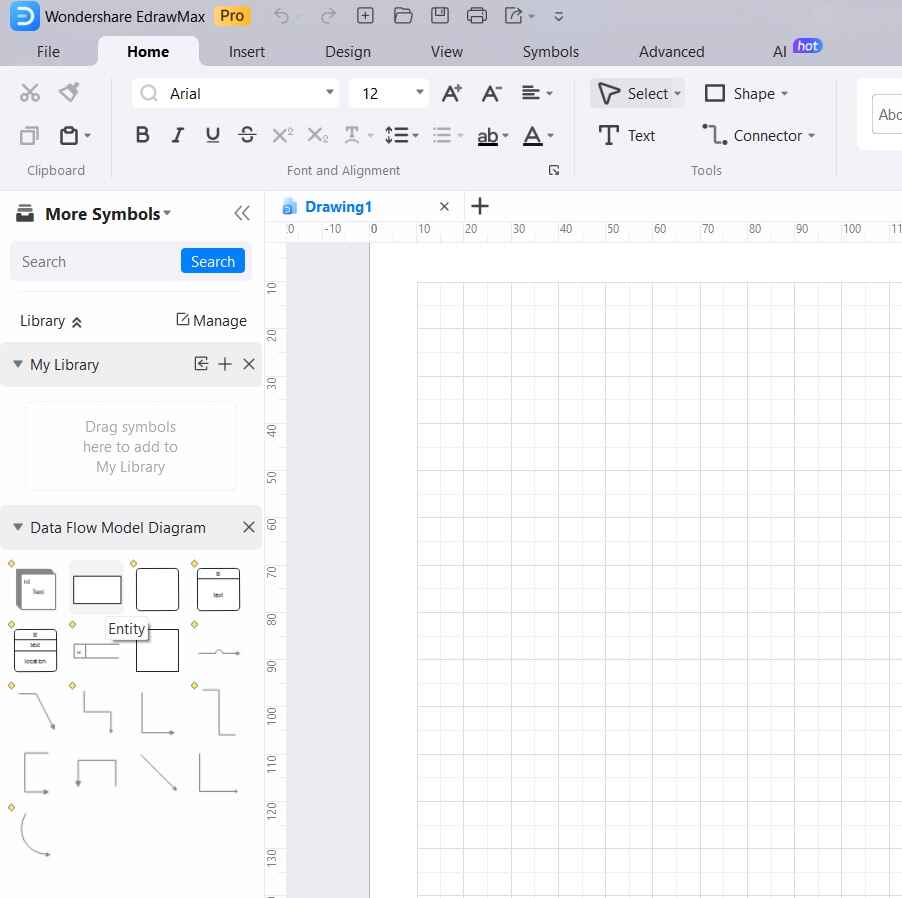
Step 3: To get started, drag and drop the process, data store, data flow, and external entity symbols onto the canvas from the left sidebar. Use the connector tool to draw arrows between shapes, representing the flow of data.
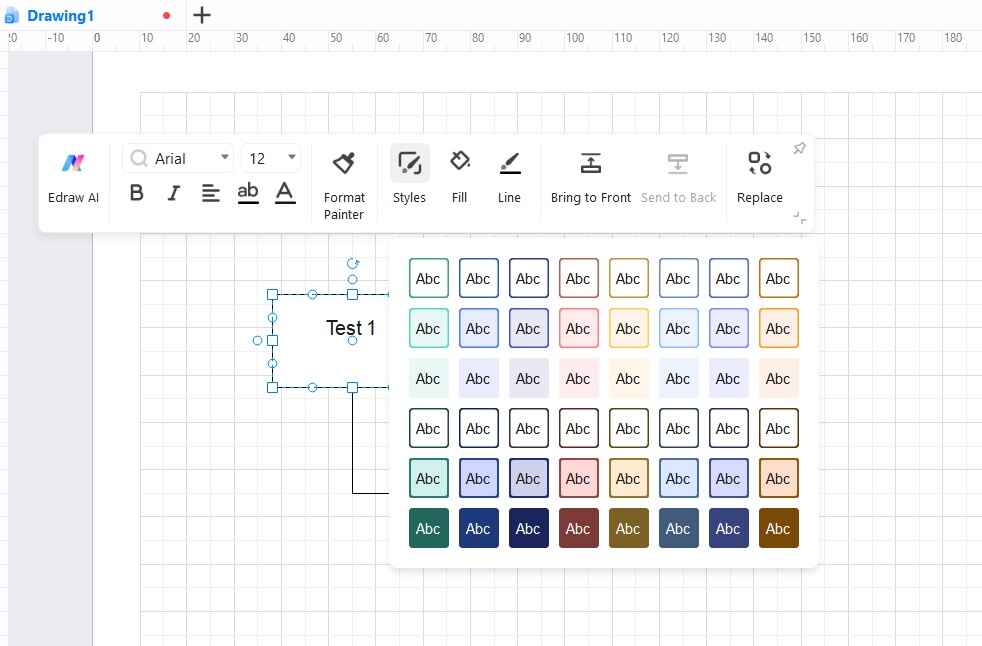
Step 4: Double-click on elements to add labels and customize text, colors, and styles using the formatting options.
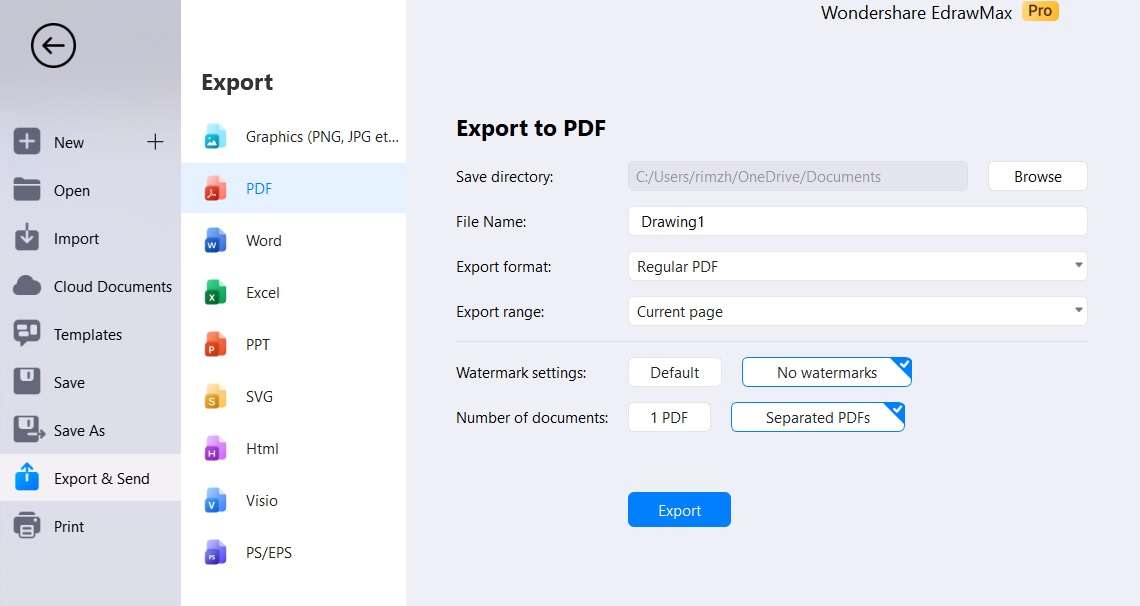
Step 5: Click on "File" and select "Save" to save the project. You can also export the DFD as an image, PDF, or other compatible format.
• Key Takeaways
DFDs are handy visuals for software engineers, offering a clear view of data flow in a system. For creating these diagrams, EdrawMax excels. It's user-friendly and efficient, making it the top pick. With its intuitive interface and robust features, engineers can easily design, modify, and collaborate on DFDs.
FAQs:
- What is the purpose of the DFD?
A DFD's purpose is to provide a clear perspective of data flow inside your project. It assists you in understanding, designing, and documenting the system's operation.
- What is the basic rule of DFD?
The basic rule of Data Flow Diagrams (DFD) is that it should have a clear input, process, and output defined for each process depicted in the diagram. This ensures a comprehensive understanding of how data flows within a system or process. Missing or unclear definitions of inputs and outputs can lead to confusion in system understanding.
AI Diagram Generator
Enter your prompt. Upload files if needed. Generate diagrams, charts, or slides instantly.


