


In today's dynamic business environment, visual communication is crucial. Creating an organizational chart in PowerPoint offers a potent means to present your team's structure and roles effectively. This step-by-step guide empowers you with the skills to design a compelling org chart. From incorporating shapes to connecting positions, we'll cover all the essentials.
Regardless of your level of experience, this guide will help you craft a compelling depiction of your organization's structure, ensuring your presentations leave a lasting impression.
Contents of this article
Part 1. What is an Organizational Chart?
An organizational chart is like a map for a company. It shows who is in charge and how different parts of the company connect. Think of it as a family tree but for a business. At the top, you have the big boss, and below, you see the managers and teams. It helps everyone understand their roles and who they report to. This chart is a powerful tool for clear communication within a company, making sure everyone knows where they fit in.
Organizational charts come in different shapes and styles, but they all serve the same purpose: to make the company's structure easy to grasp. They can be hierarchical, showing levels of authority, or flat, emphasizing collaboration. Some charts use boxes and lines, while others use circles and arrows. Regardless of the format, they provide a visual guide for employees, helping them navigate the company's hierarchy and work together effectively towards common goals.
Part 2. Types of Org Charts:
There are three main types of organizational charts: hierarchical, flat, and matrix.
1. Hierarchical Chart: The most widespread type is the hierarchical chart, resembling a pyramid with the leader at the pinnacle, followed by tiers of managers and staff underneath. It effectively illustrates reporting relationships and the chain of command.
2. Flat Chart: In this type, there are fewer levels of management, and team members have more independence. It's excellent for small companies or those with a more collaborative culture.
3. Matrix Chart: This is a bit more complex. It combines elements of both hierarchical and flat structures, allowing employees to report to multiple managers based on different projects or tasks. This type fosters versatility and adaptability within the organization.
Part 3. Creating an Organizational Chart in PowerPoint
Here are the steps for creating an organizational chart in PowerPoint:
Step 1: Launch the PowerPoint application on your computer.
Step 2: Click on the "Insert" tab in the ribbon at the top of the screen. Select "SmartArt" from the dropdown menu.
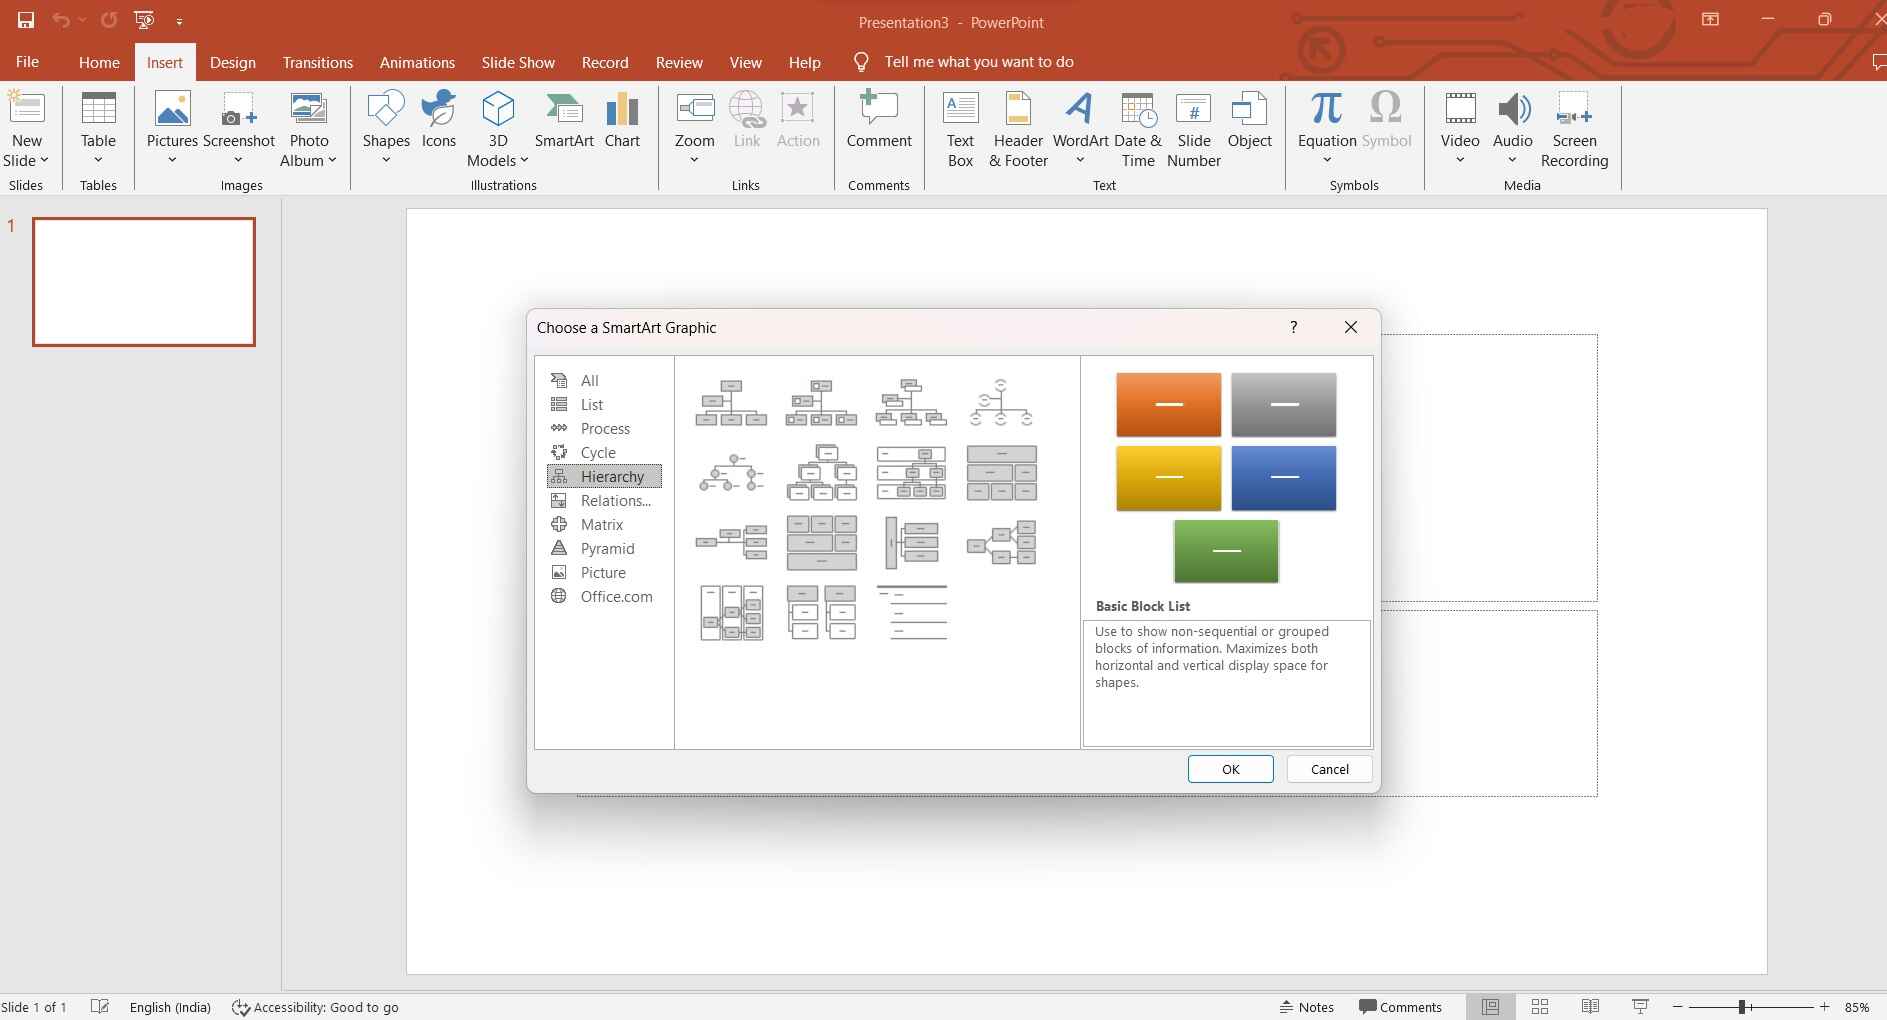
Step 3: In the SmartArt gallery, select a layout that suits your organizational structure. Common choices include "Hierarchy" or "Organizational Chart."
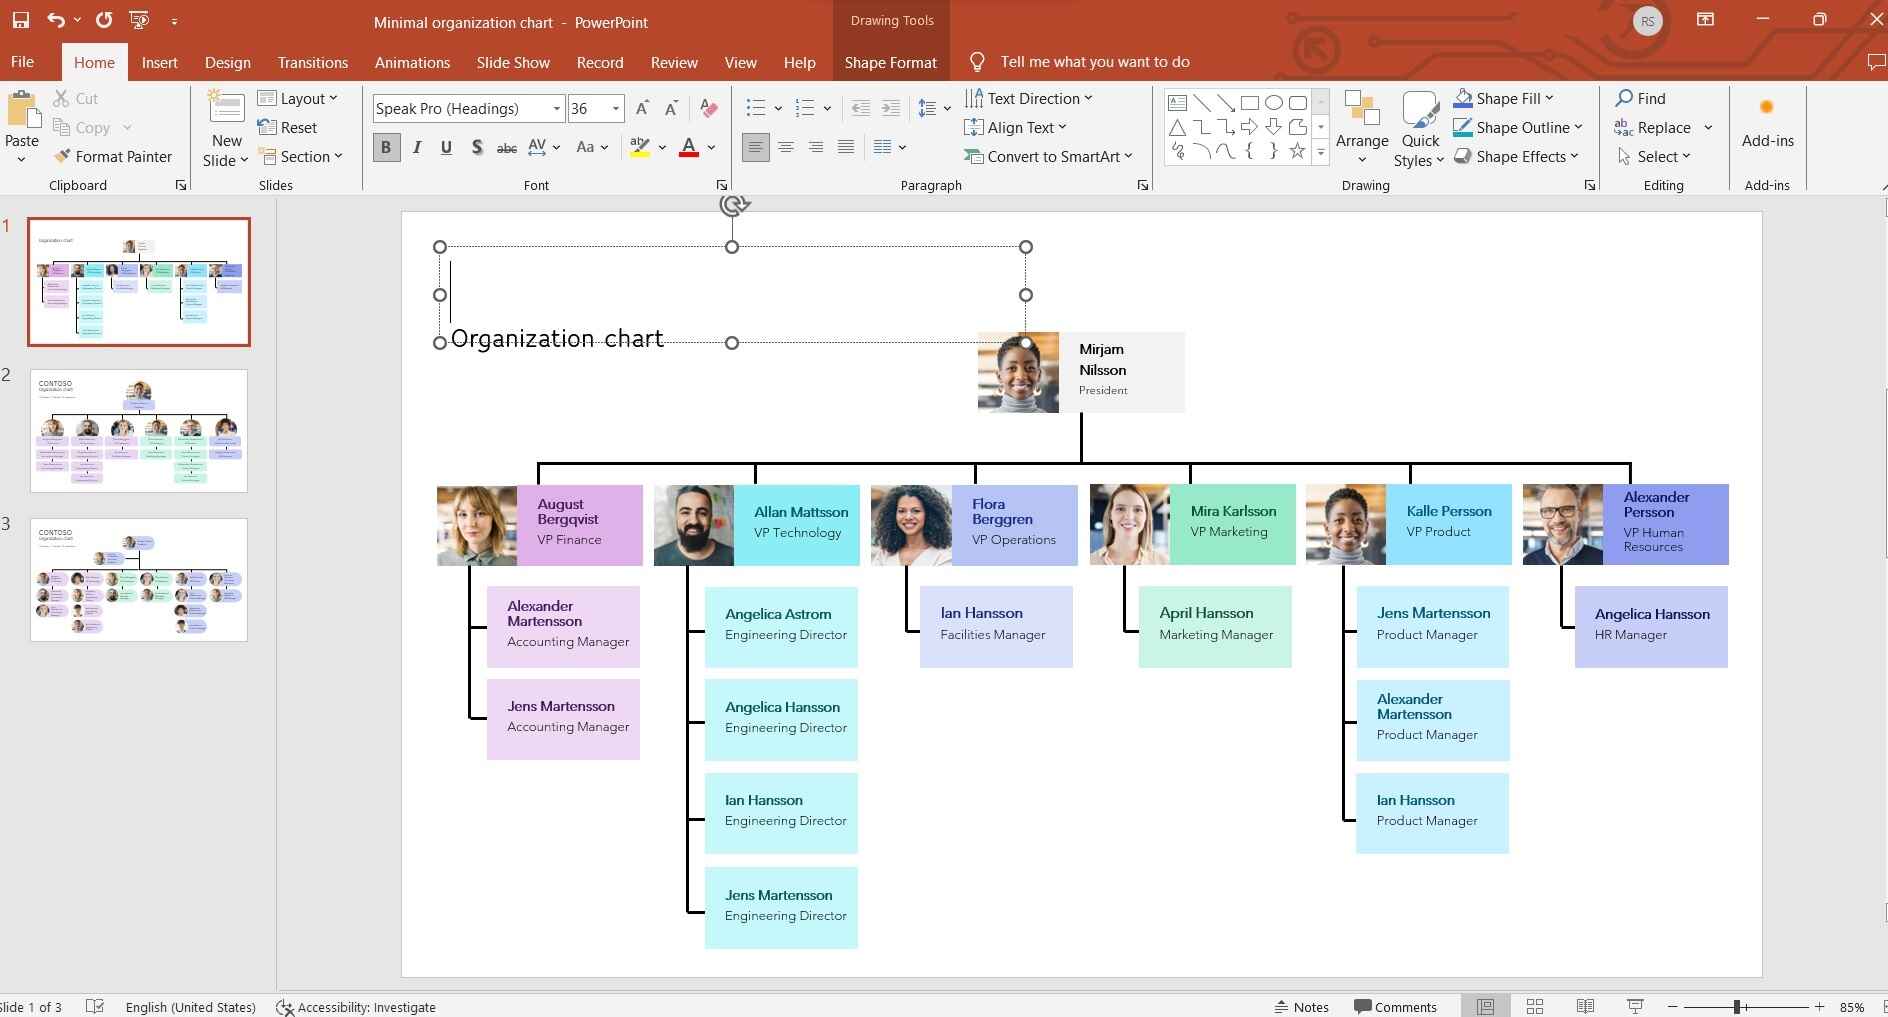
Step 4: In the Smartart organizational chart, click on the shapes in the SmartArt graphic to add text for each position. You can include titles, names, and any additional information you want to display.
Step 5: To add more positions, click on a shape, and then go to the "Design" tab in the SmartArt Tools section. Click "Add Shape" to include more boxes or positions. If needed, use connectors to link positions. Click and drag from one shape to another to create lines indicating relationships.
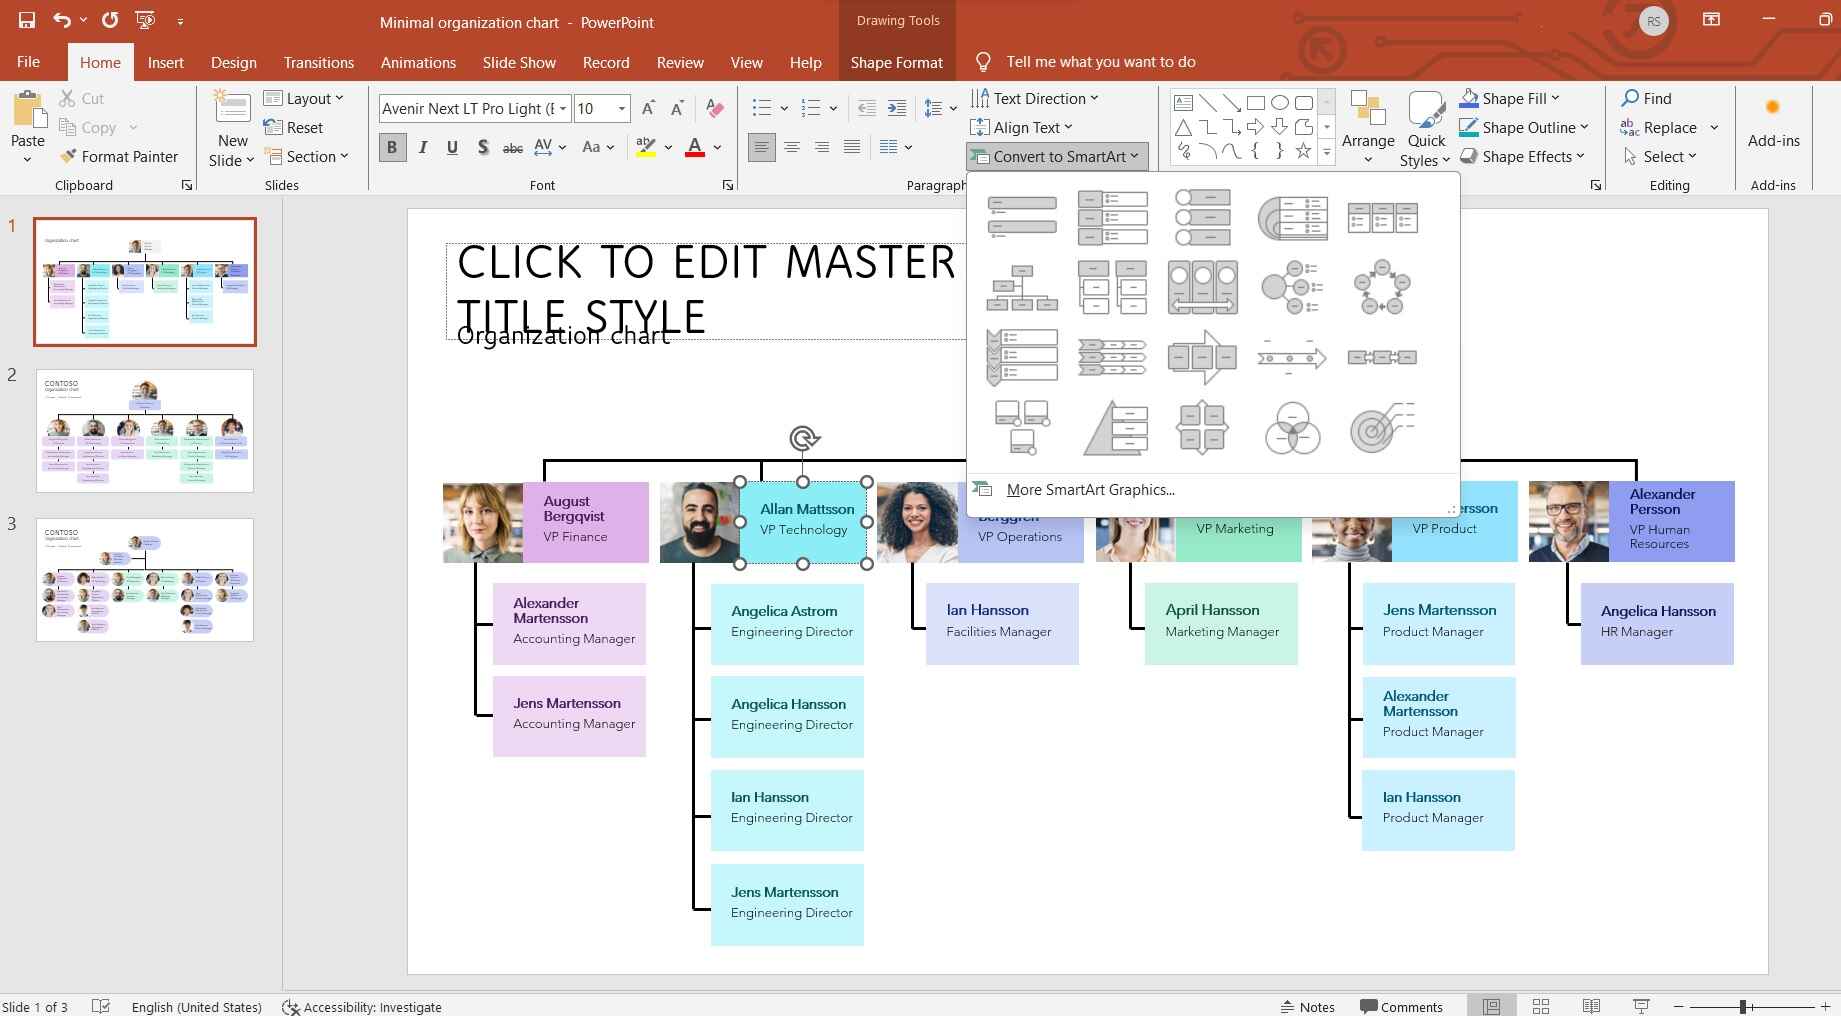
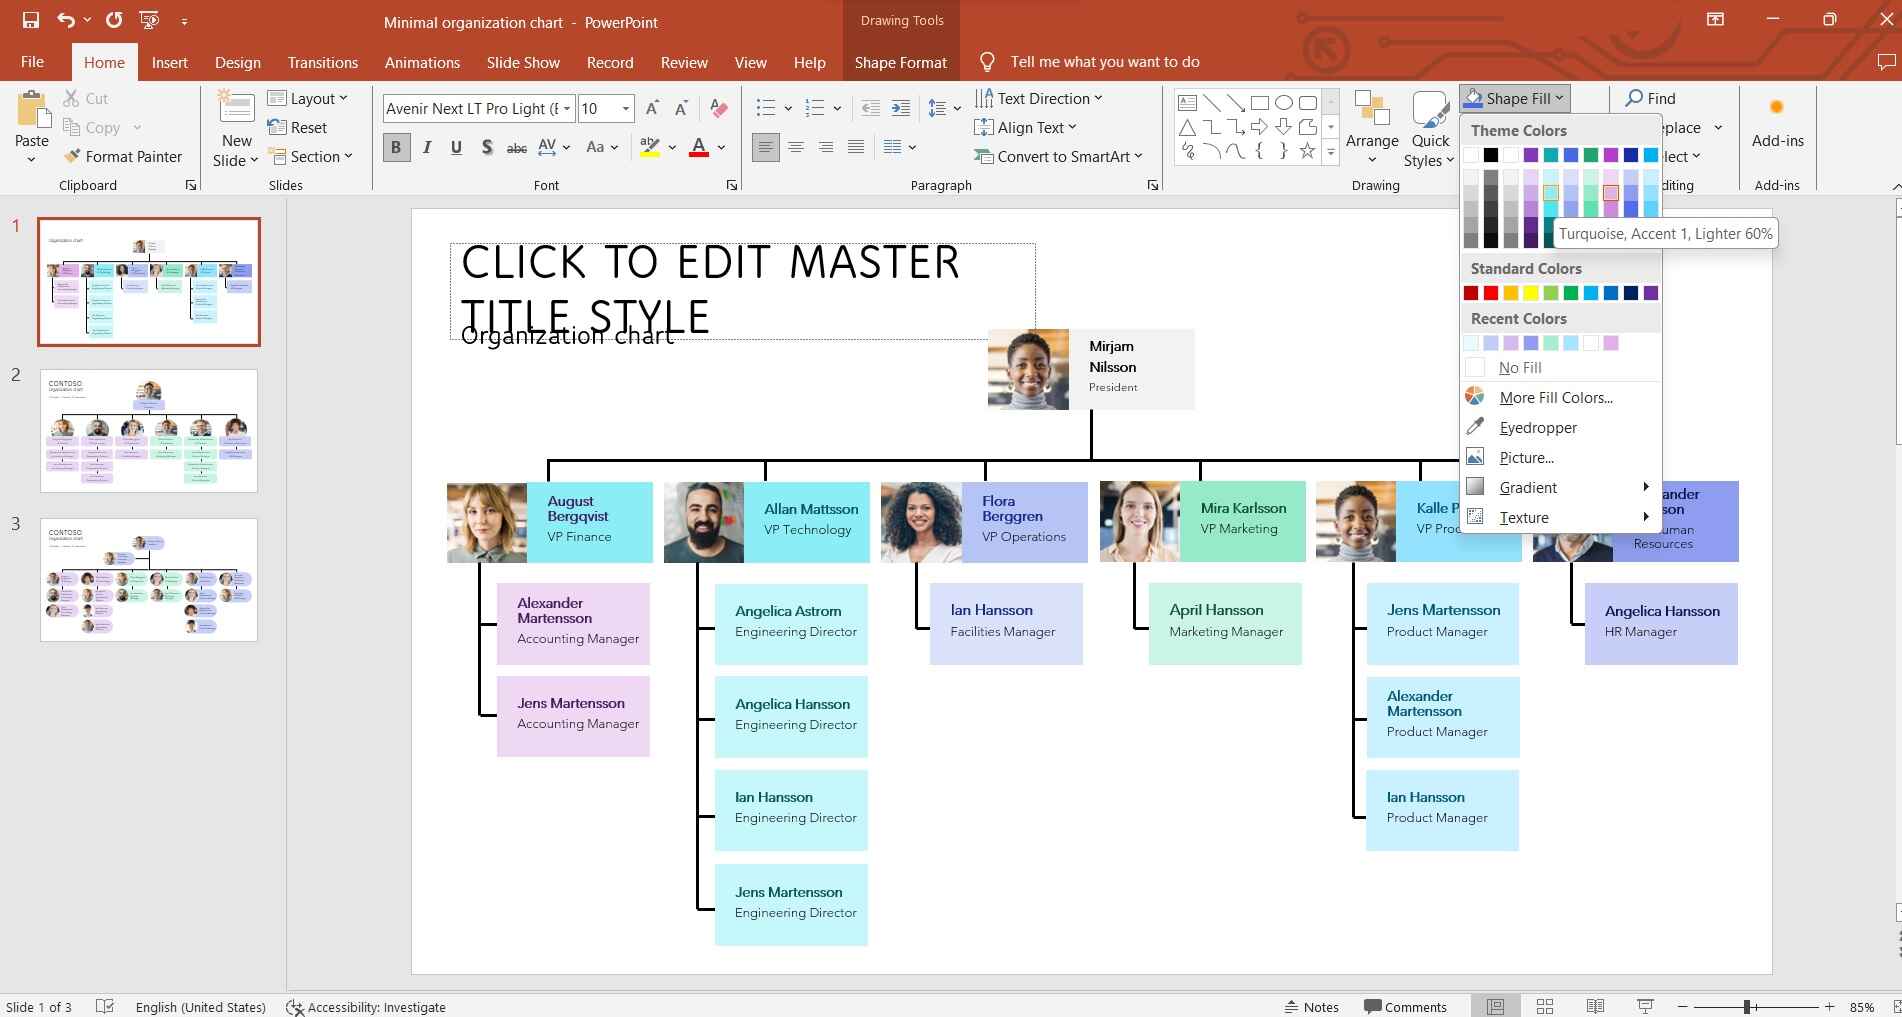
Step 6: You can change the color scheme, style, and format of the SmartArt graphic by using the options in the "SmartArt Tools" tabs.
Step 7: Take a moment to review the chart for accuracy and completeness. Once you're satisfied with your organizational chart, make sure to save your PowerPoint presentation.
By following these steps, you'll be able to create a clear and visually appealing org chart in PowerPoint.
Part 4. Create an Org Chart Easily using EdrawMax
Wondershare EdrawMax offers a comprehensive and user-friendly platform for creating organizational charts, surpassing the capabilities of PowerPoint in several key ways. Firstly, EdrawMax provides a specialized toolkit tailored specifically for creating various types of diagrams, including organizational charts.
Furthermore, EdrawMax stands out with its intuitive interface and advanced features, making it a more robust choice compared to PowerPoint. It allows for greater flexibility in terms of layout, design, and data management within the chart. EdrawMax also supports real-time collaboration, enabling multiple team members to work on the same chart simultaneously, a feature that is not as seamless in PowerPoint.
Here are the steps for creating an organizational chart in EdrawMax:
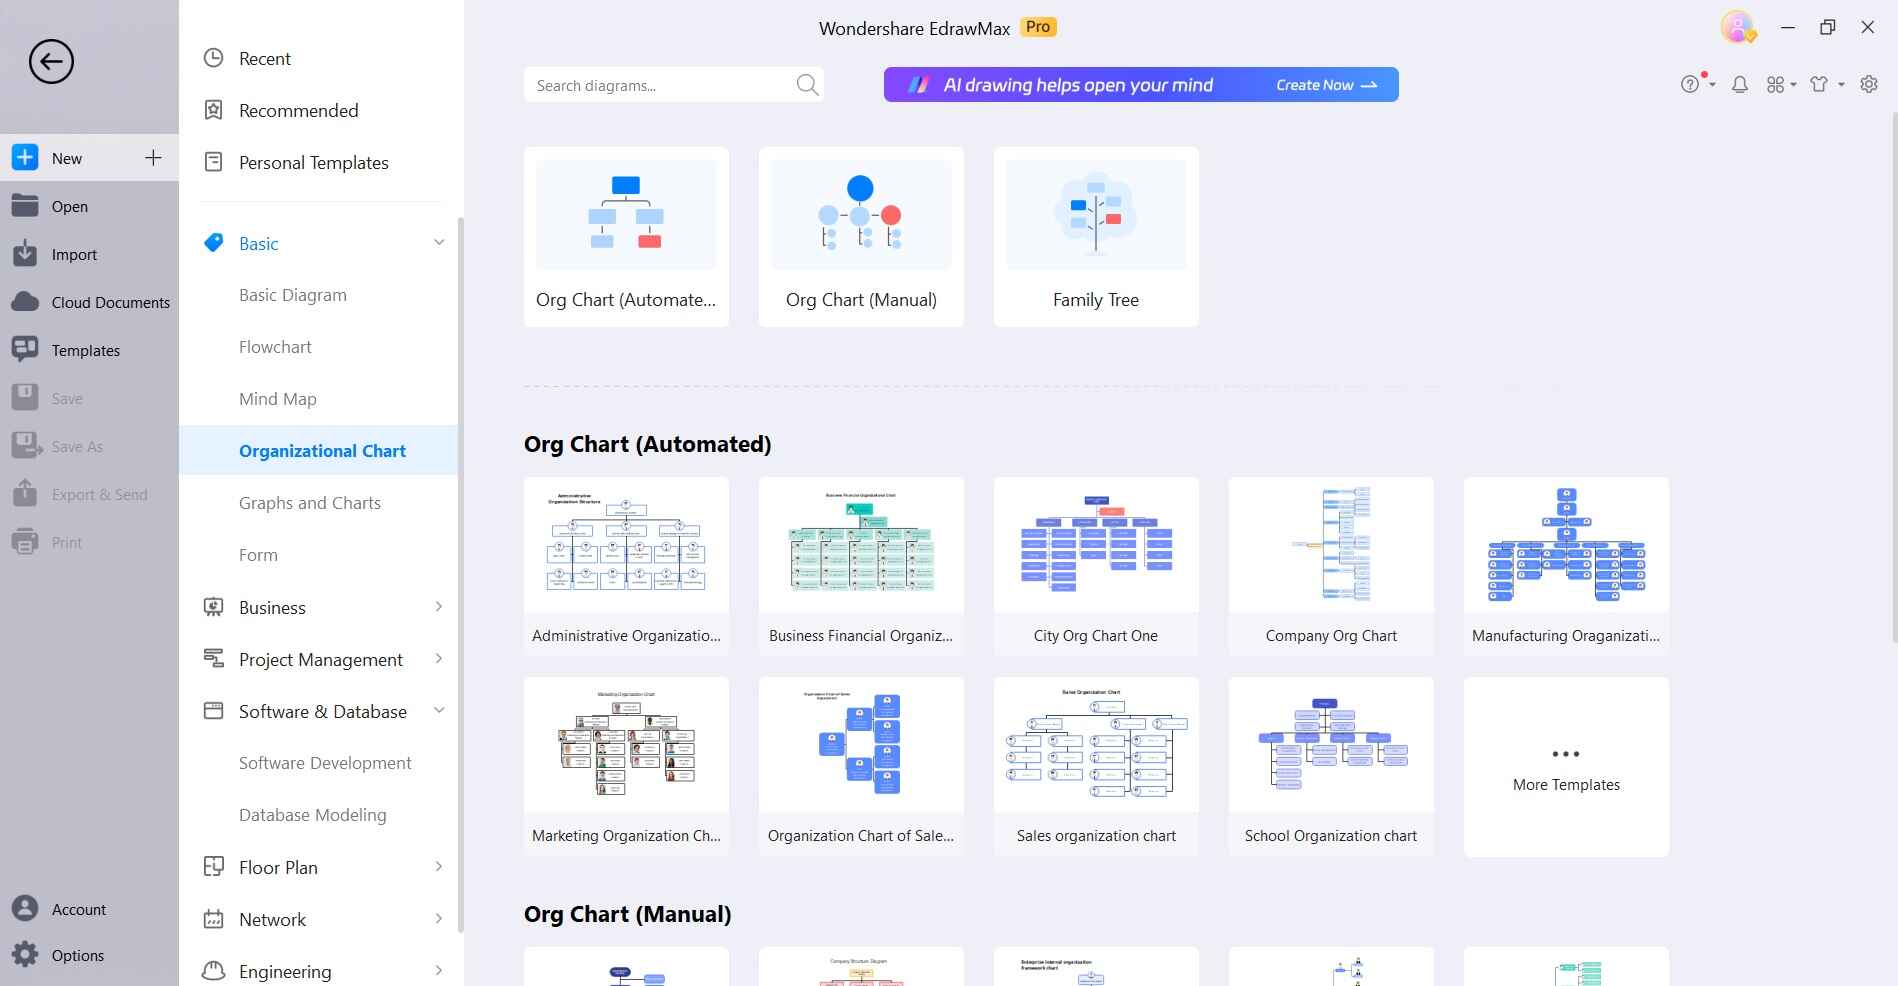
Step 1: Open the EdrawMax application on your computer. Click on the "New" button or go to "File" > "New" to create a new document. In the template categories, choose "Organizational Chart."
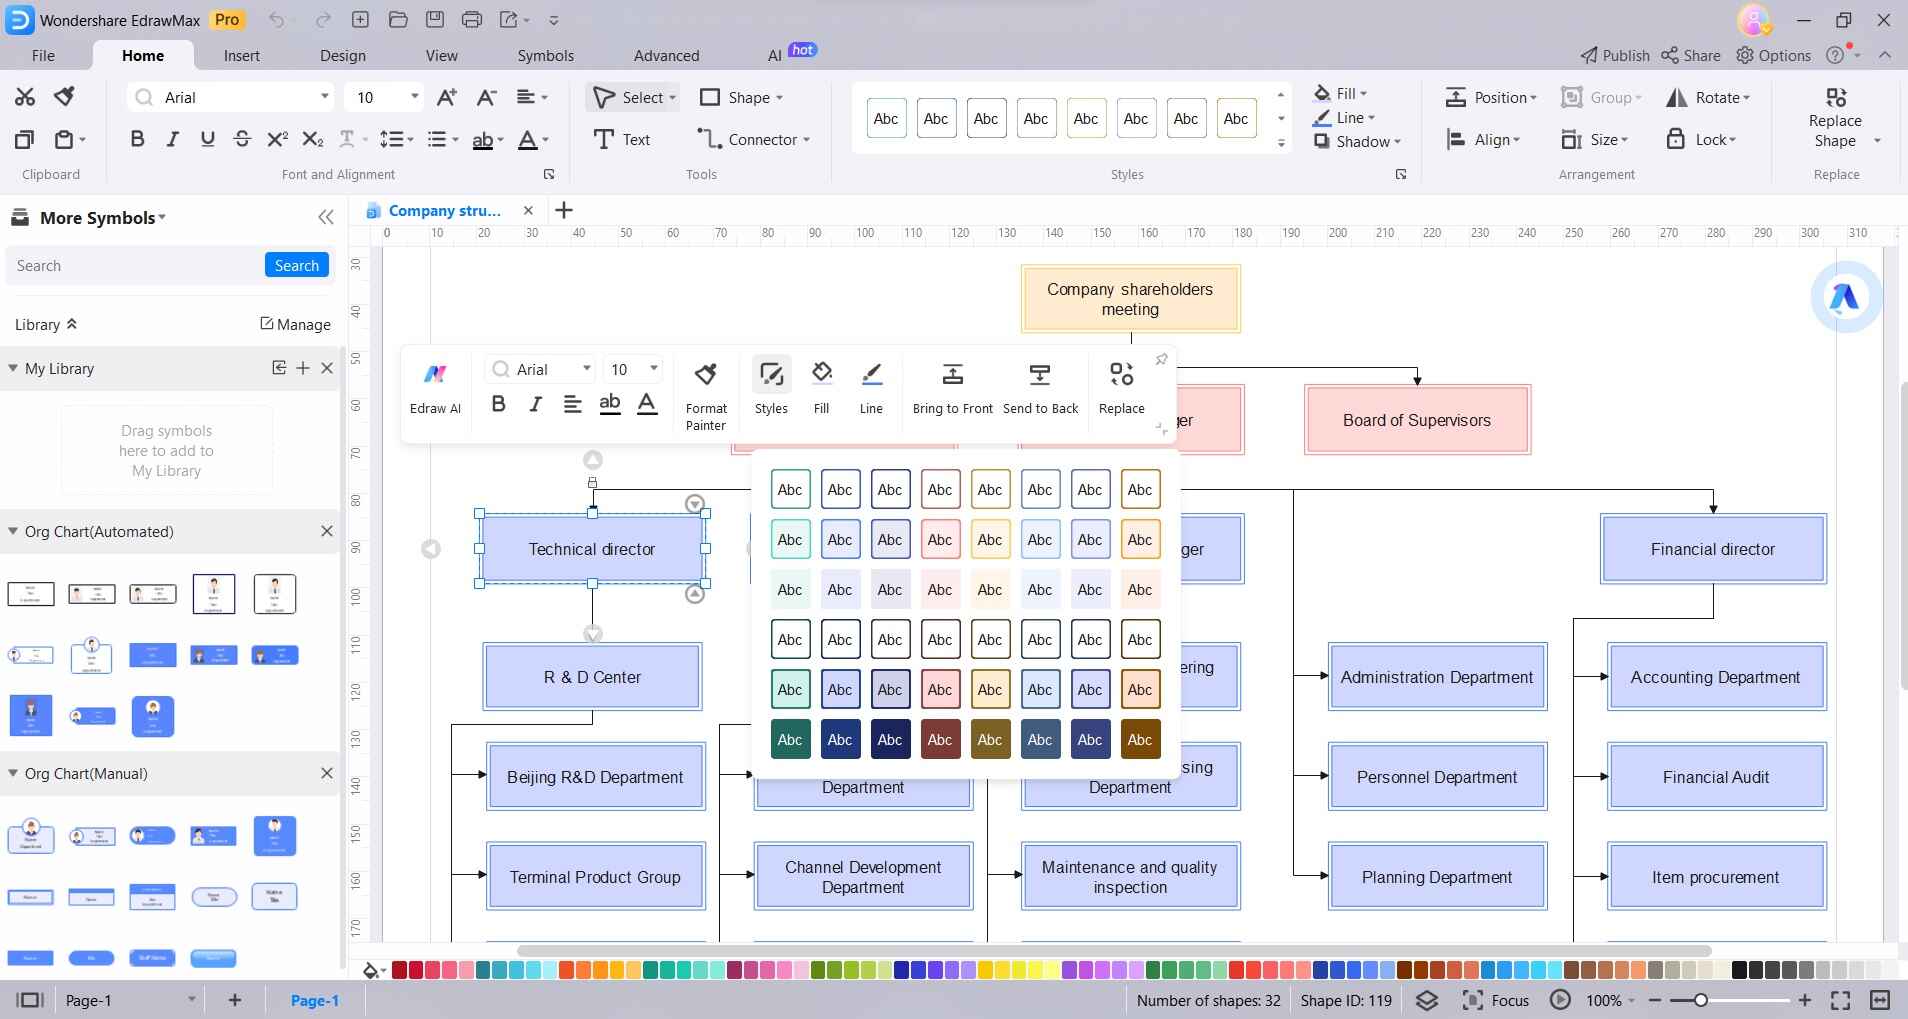
Step 2: Drag and drop the shapes representing positions onto the canvas. Customize the text within each shape to include titles, names, and additional information.
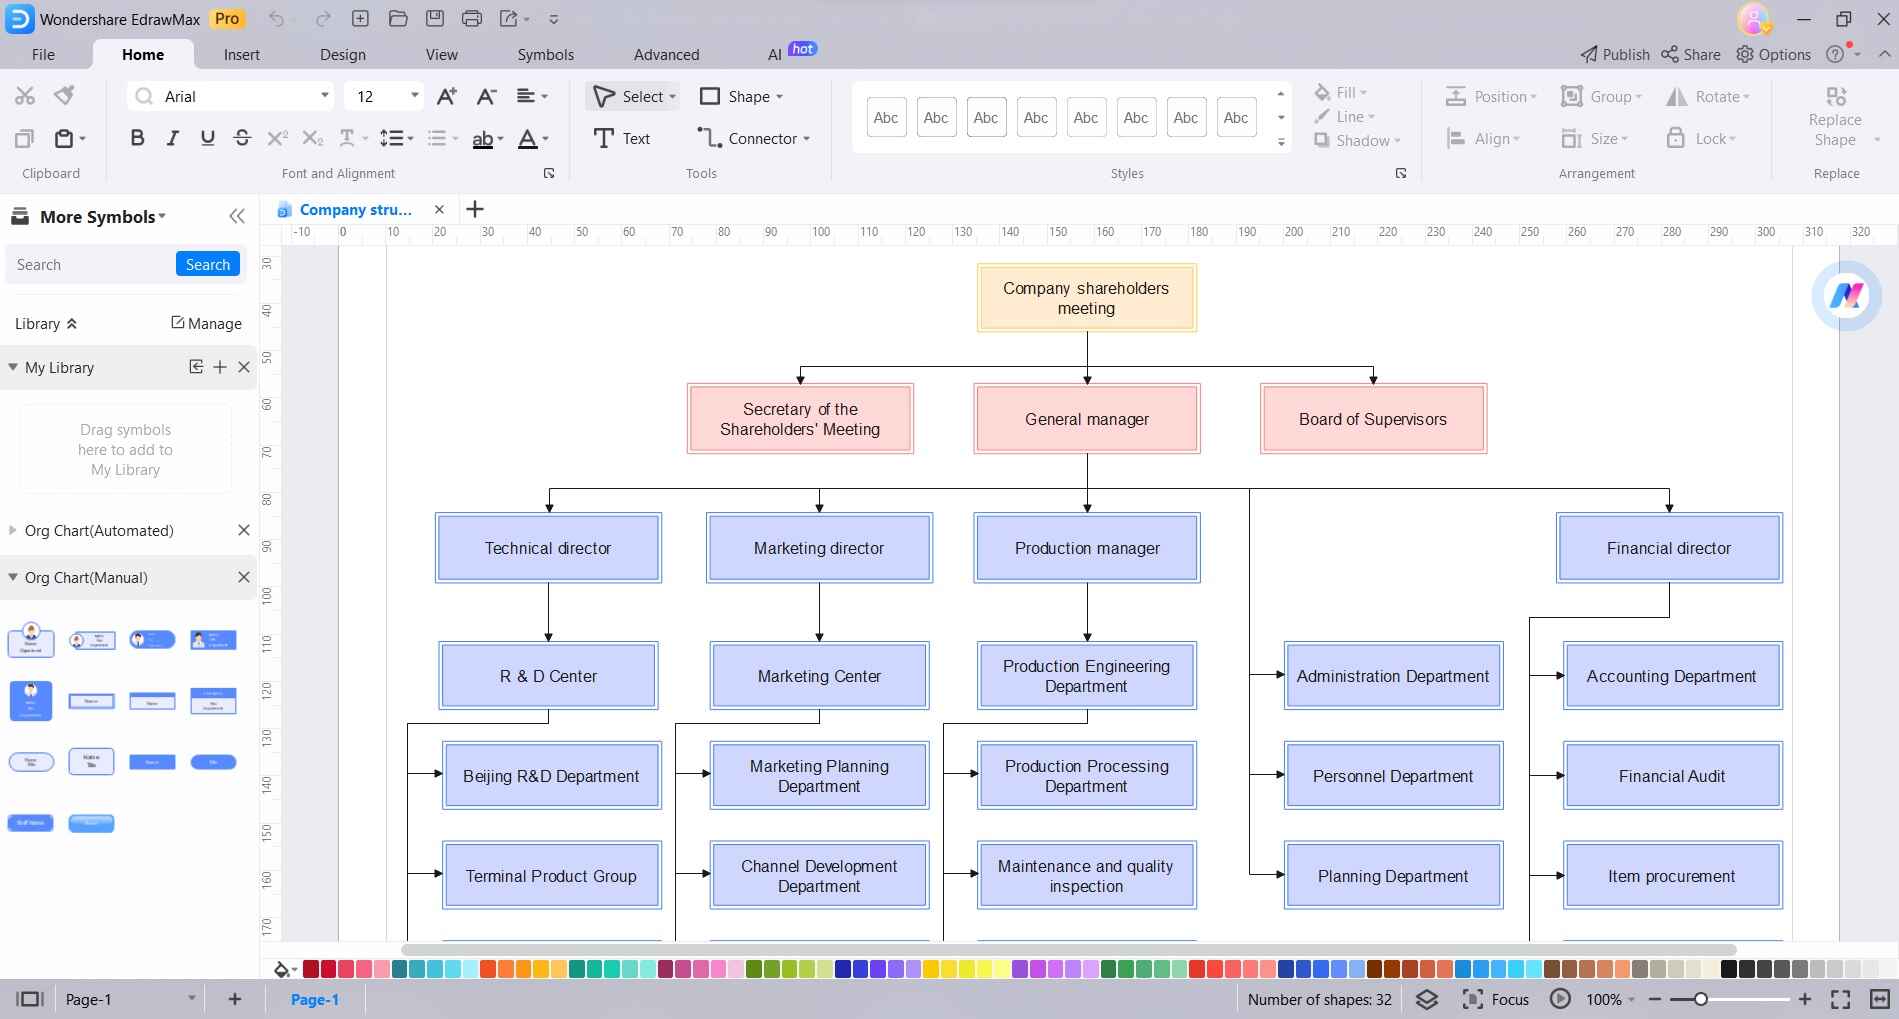
Step 3: Use the connector tool to link positions. Click and drag from one shape to another to create lines indicating relationships. EdrawMax provides various types of connectors for different organizational structures.
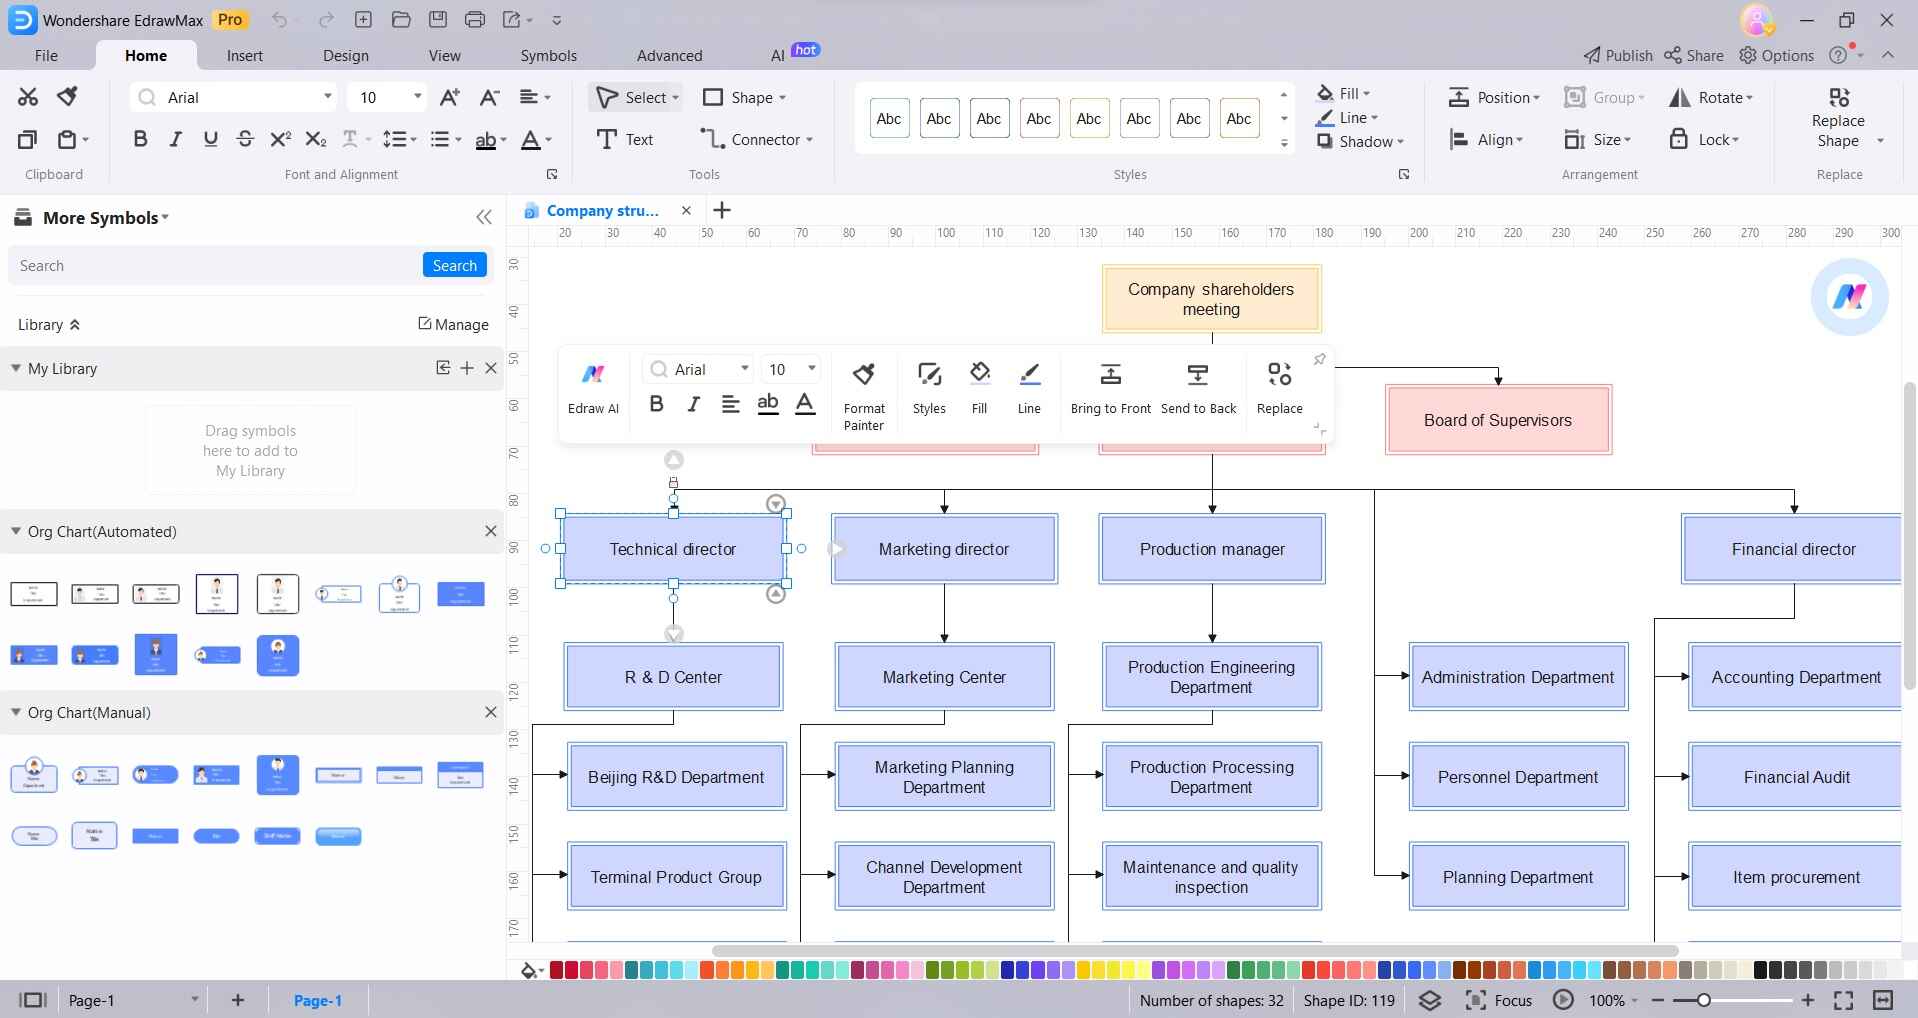
Step 4: Customize the chart's appearance by selecting shapes and using the formatting options in the toolbar. You can change colors, styles, fonts, and more to match your organization's branding or preferences.
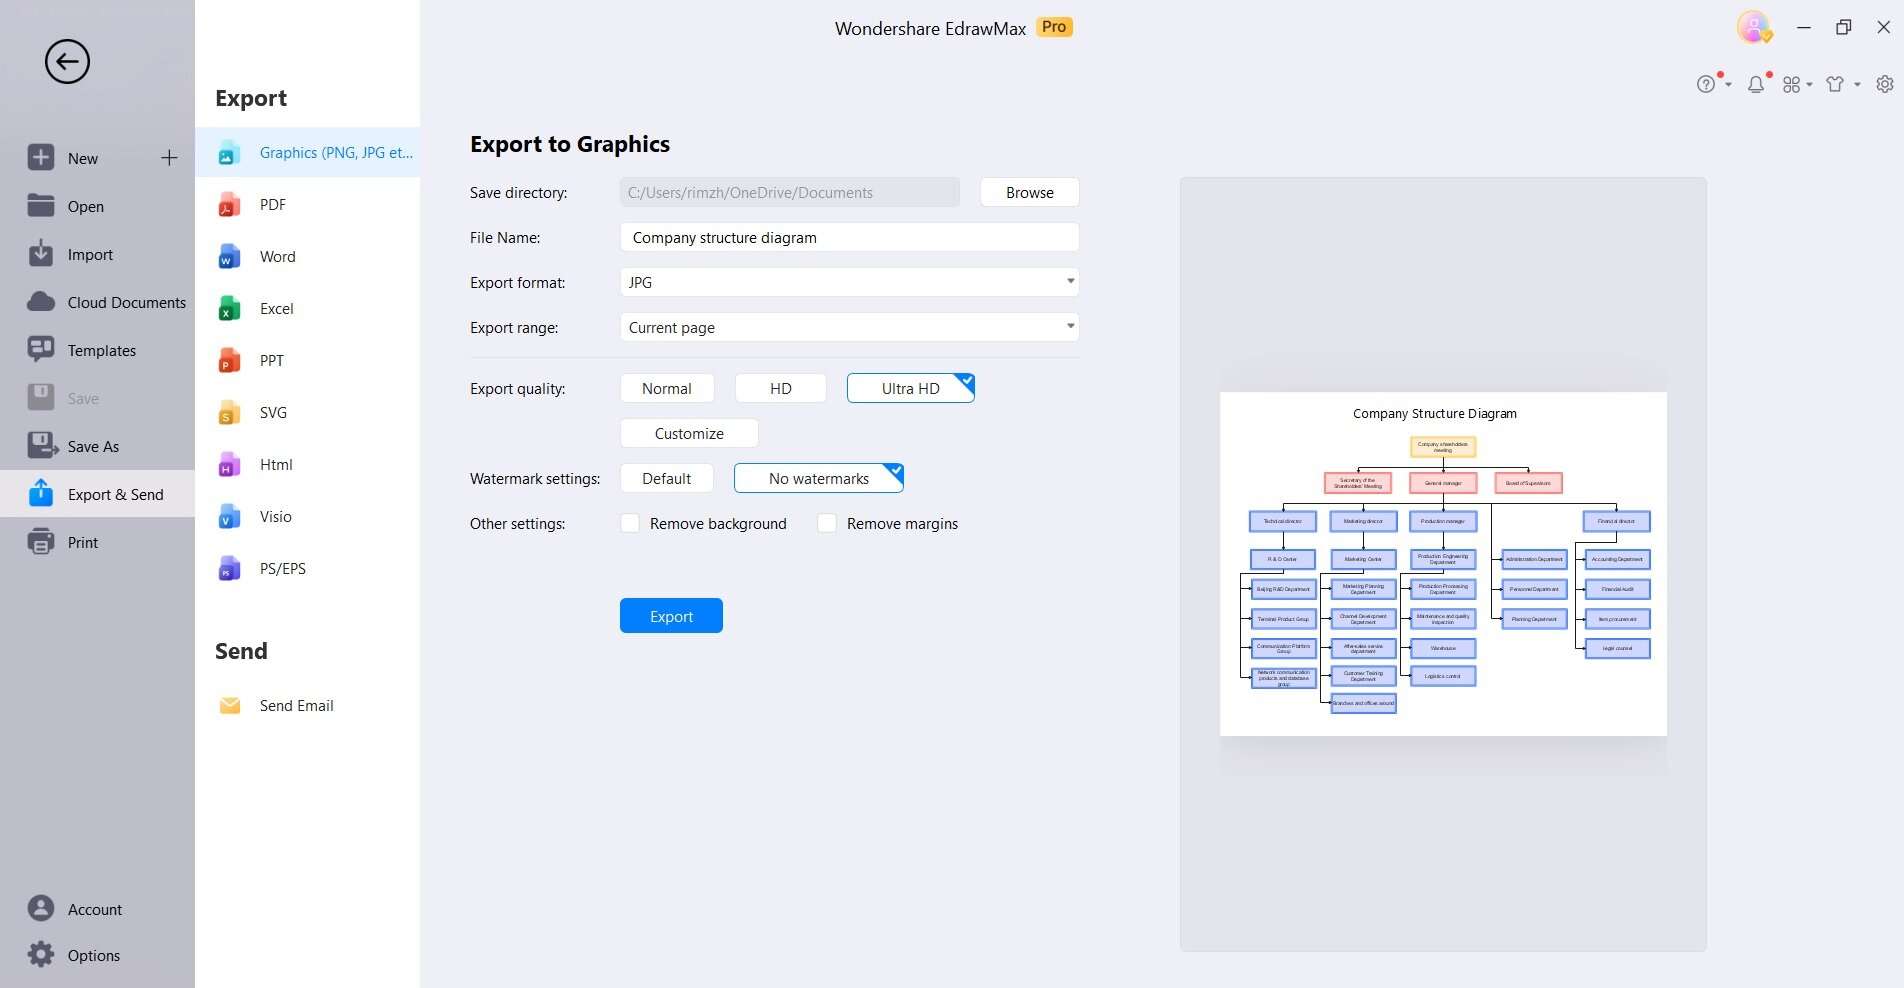
Step 5: Once you're satisfied with the organizational chart, make sure to save your work in a preferred format. EdrawMax allows you to export your organizational chart in various formats like PNG, and PDF, or even directly share it through cloud services like Google Drive or Dropbox.
By following these steps, you'll be able to create a clear and professional organizational chart using EdrawMax. The specialized tools and features in EdrawMax make the process efficient and result in a visually appealing representation of your organization's structure.
Conclusion
Mastering the art of creating an organizational chart in PowerPoint or EdrawMax, equips professionals with a vital skill for effective communication in today's fast-paced business world. These visual representations serve as invaluable tools for presenting team structures and hierarchies.
While PowerPoint offers a familiar platform, EdrawMax shines with its specialized toolkit and advanced features, enabling seamless collaboration and customization. Whether choosing PowerPoint for simplicity or EdrawMax for specialized functionality, a well-crafted organizational chart ensures teams operate cohesively, enhancing productivity and clarity in every professional endeavor.
AI Diagram Generator
Enter your prompt. Upload files if needed. Generate diagrams, charts, or slides instantly.


