Embarking on a project without a clear visual roadmap can be a recipe for confusion and inefficiency. That's where Gantt charts come into play – powerful project management tools that provide a visual representation of tasks, timelines, and dependencies. Excel, with its versatile spreadsheet capabilities, offers a user-friendly platform for creating Gantt charts that can streamline project planning and execution.
In this comprehensive guide, we will walk you through the step-by-step process of creating a Gantt chart in Excel, regardless of your proficiency level. Whether you're a seasoned project manager or a beginner looking to enhance your organizational skills, Excel's features can be harnessed to design a dynamic and interactive Gantt chart tailored to your project's unique needs.
How to Make a Gantt Chart in Excel
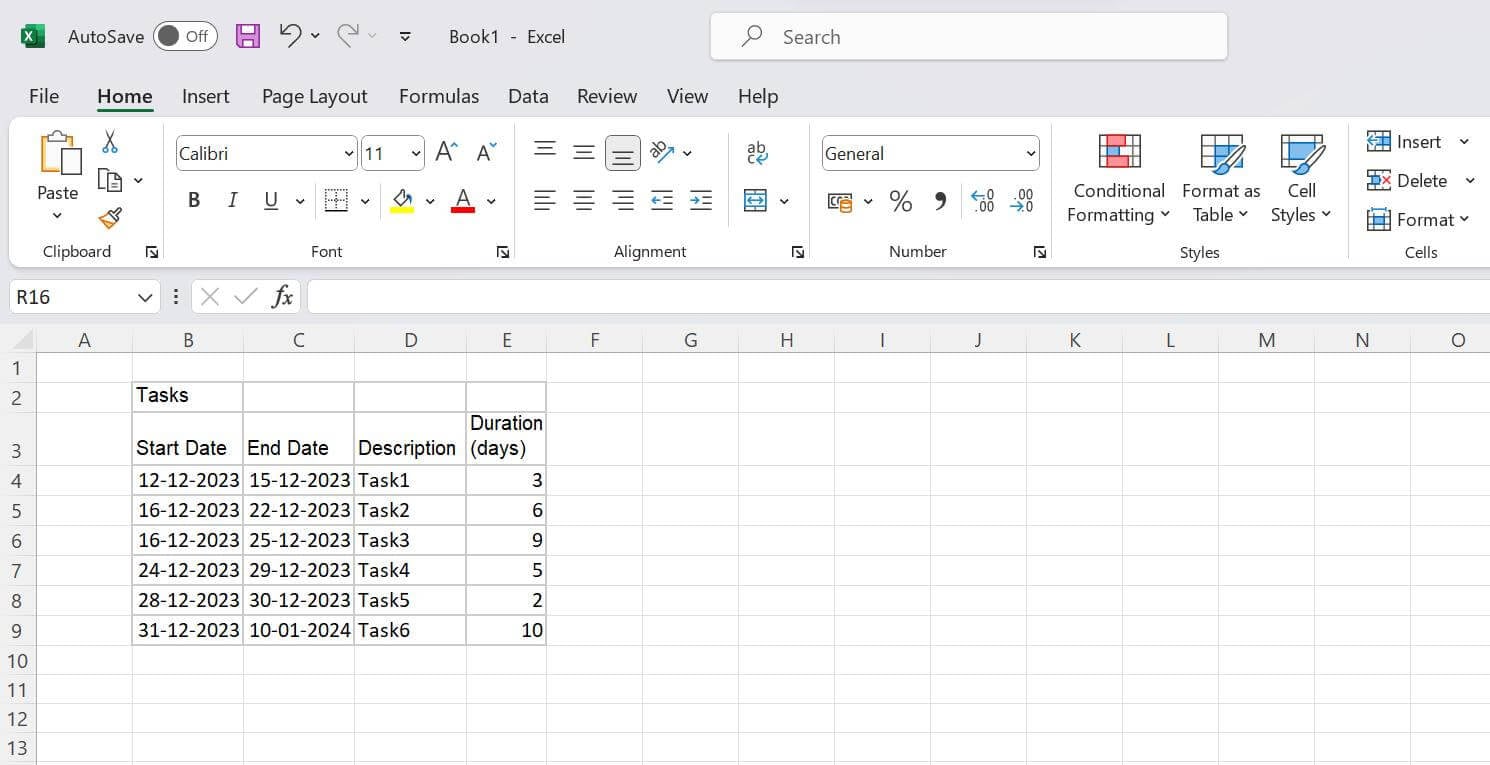
Step 1: Open Excel and Create a Table
Create columns with names: Start Date, End Date, Description, and Duration(days).
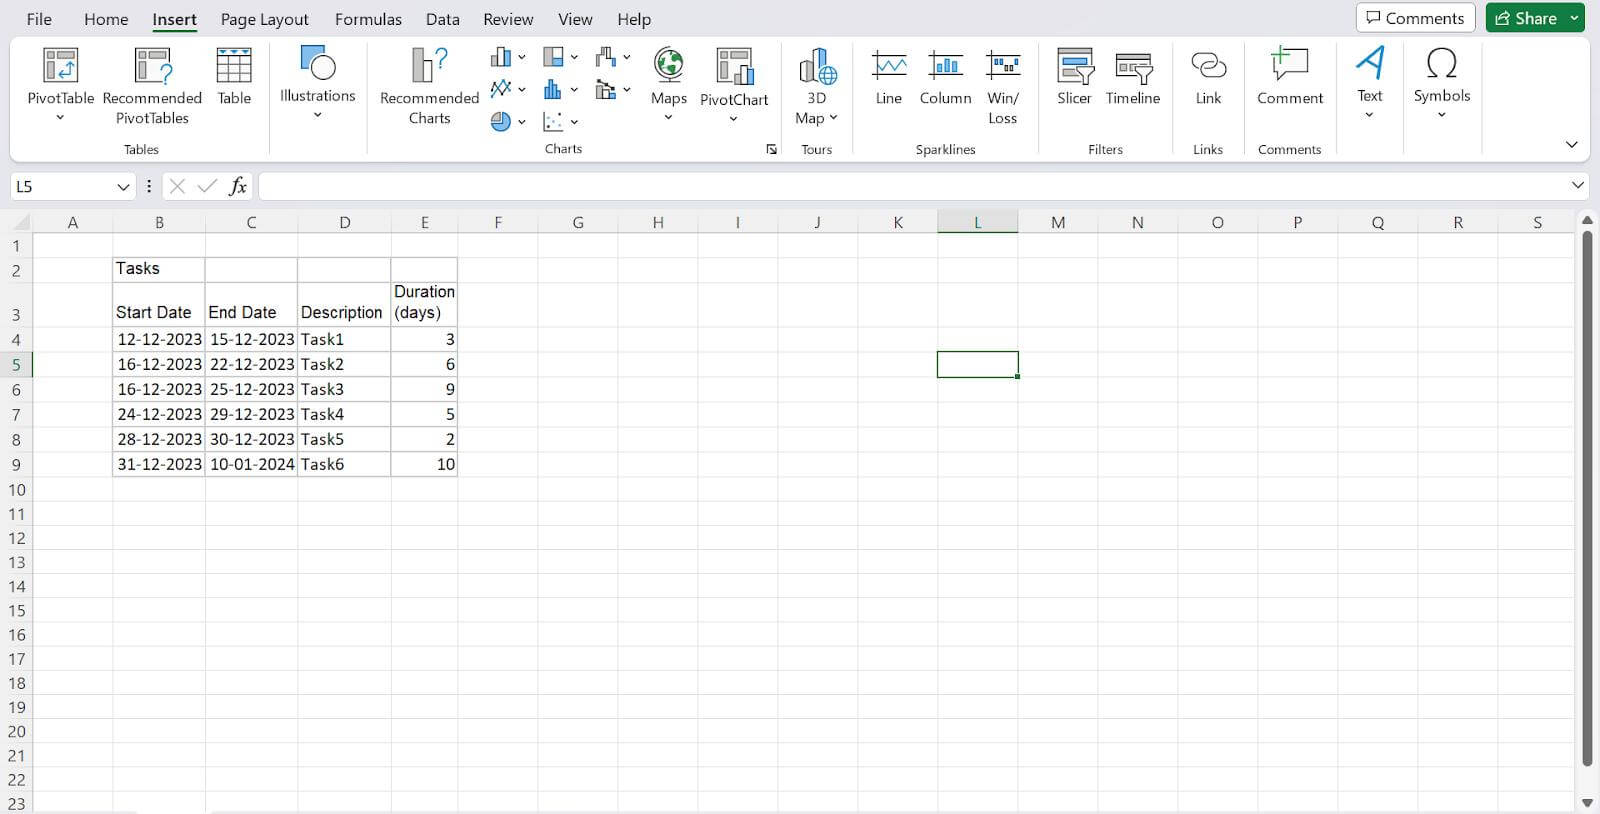
Step 2: Start Creating Your Excel Gantt Chart
Go to the worksheet where your table is located and click on any empty cell.
Look at the top menu and click on the "INSERT" tab.
In the charts options, find and click on "Bar Chart".
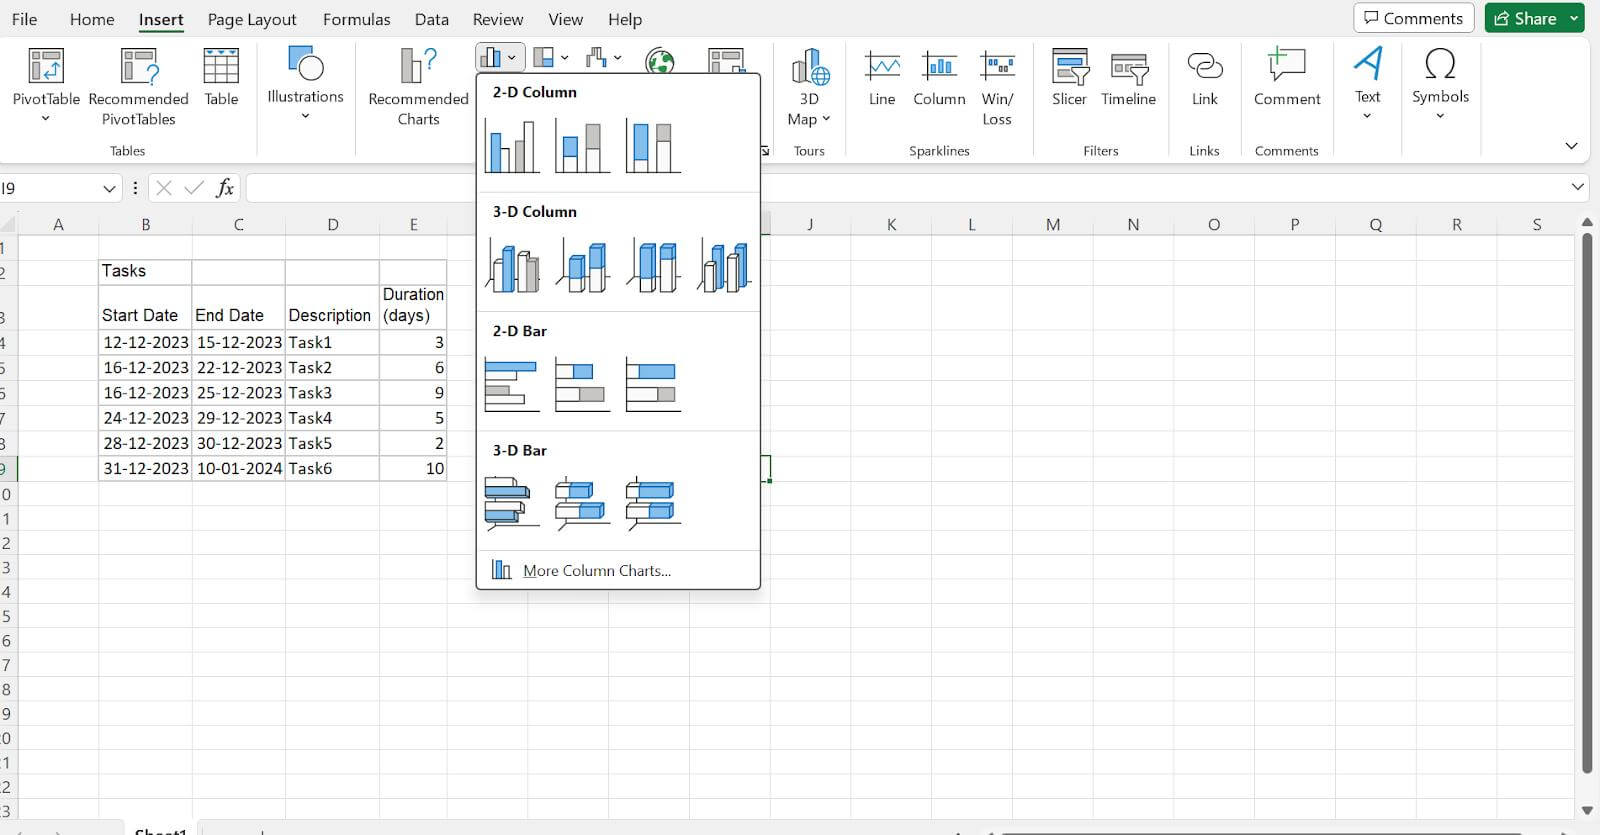
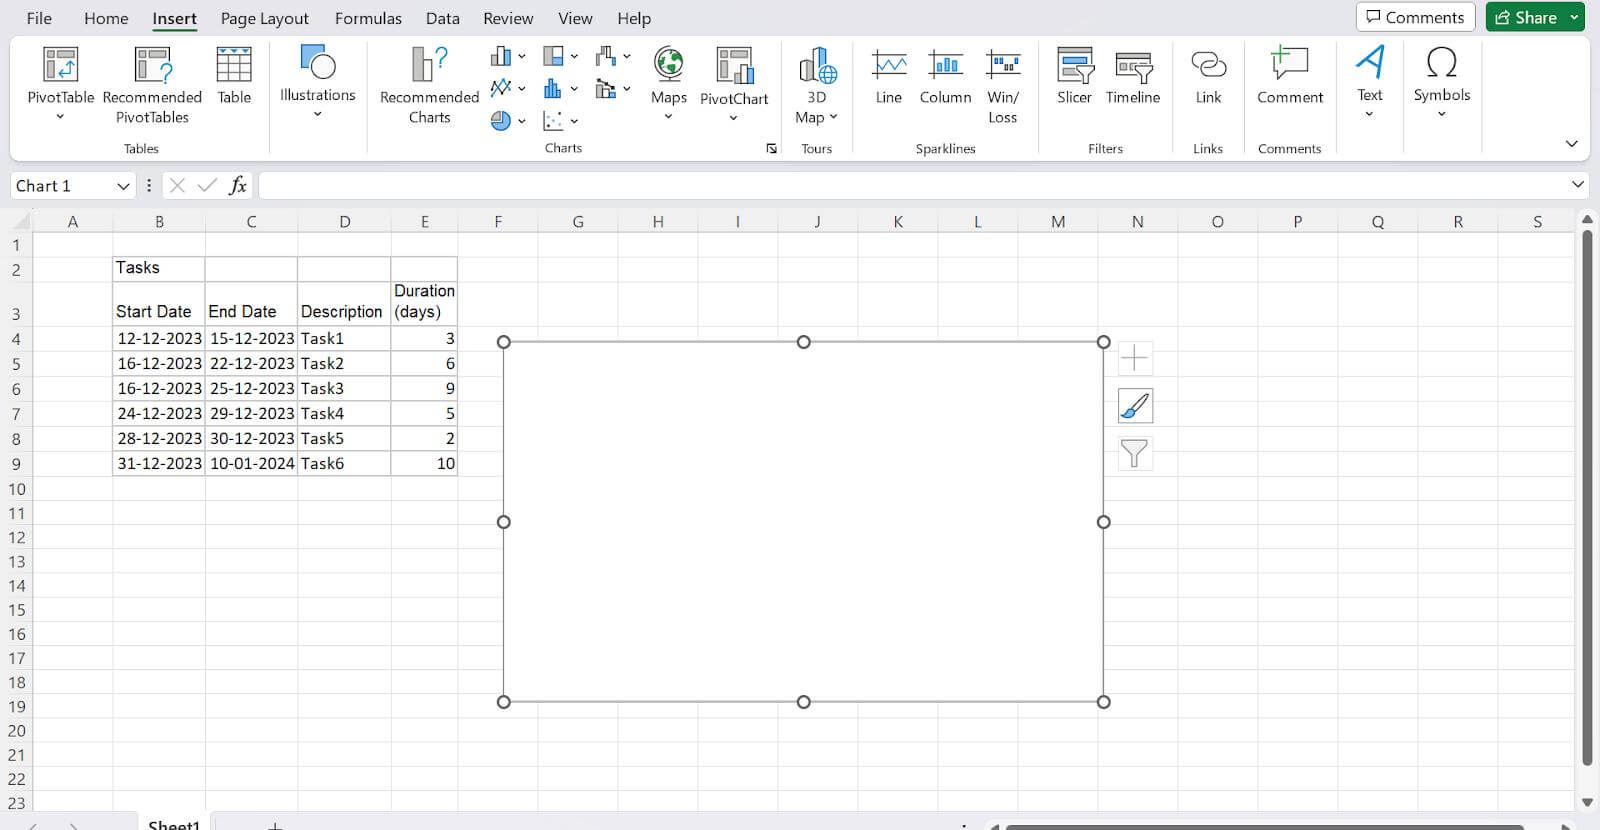
Choose "Stacked Bar" from the menu. This action will add a large empty chart space to your Excel worksheet. Make sure not to select "100% Stacked Bar".
Step 3: Add Start Dates to Your Gantt Chart
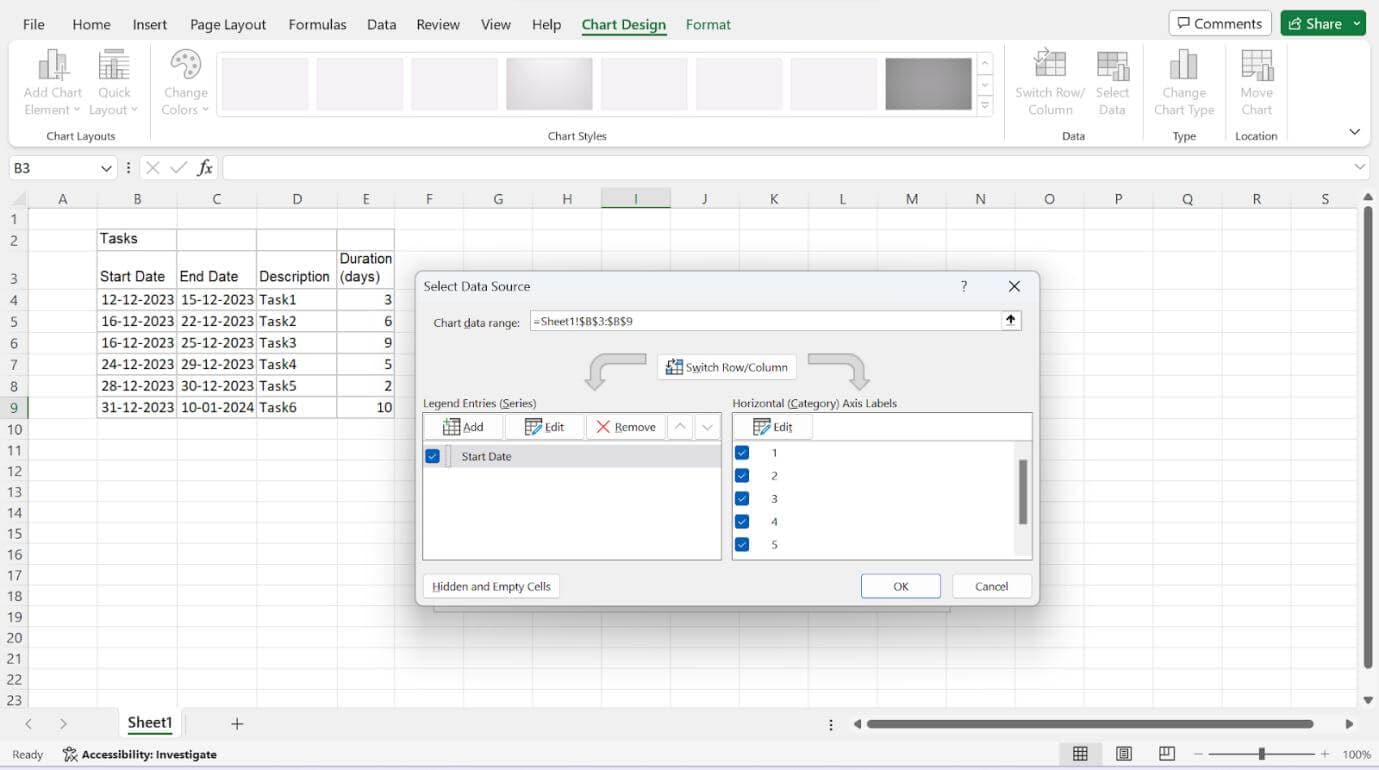
Right-click on the empty chart space and select "Select Data". This will open a window.
In the window, find the table named "Series" on the left side and click "Add".
Now to name the data (Series), click on the empty field under "Series name," and then click on the column header labelled "Start Date" in your table.
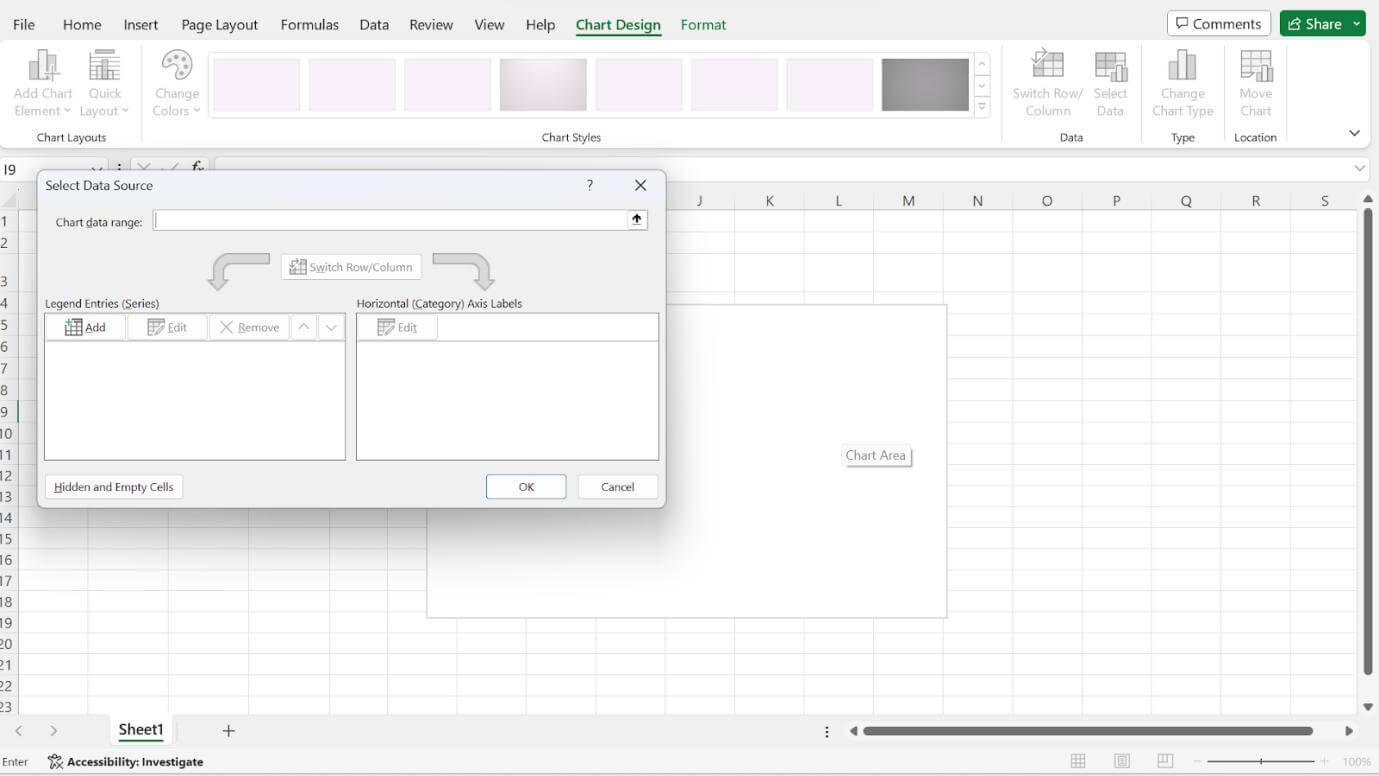
Still in the window, move down to "Series value." Click the icon with an arrow pointing up, and a smaller window will appear.
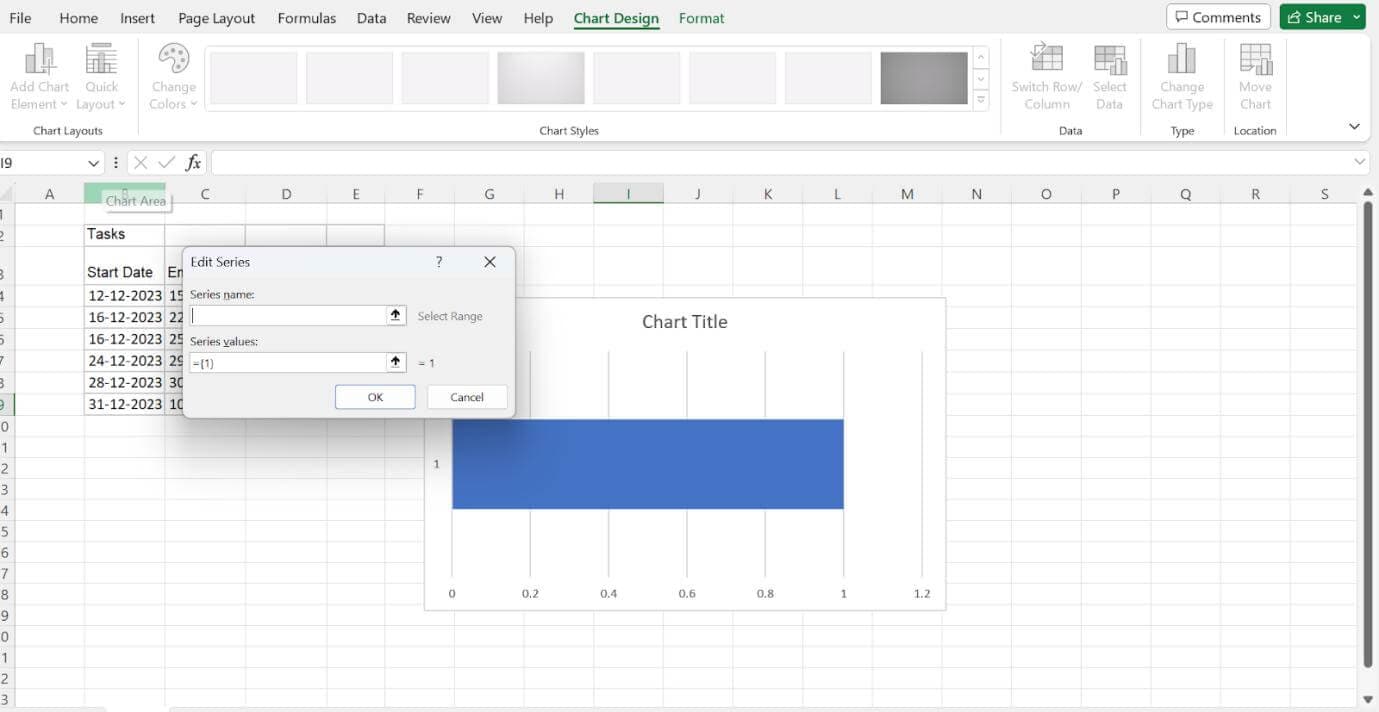
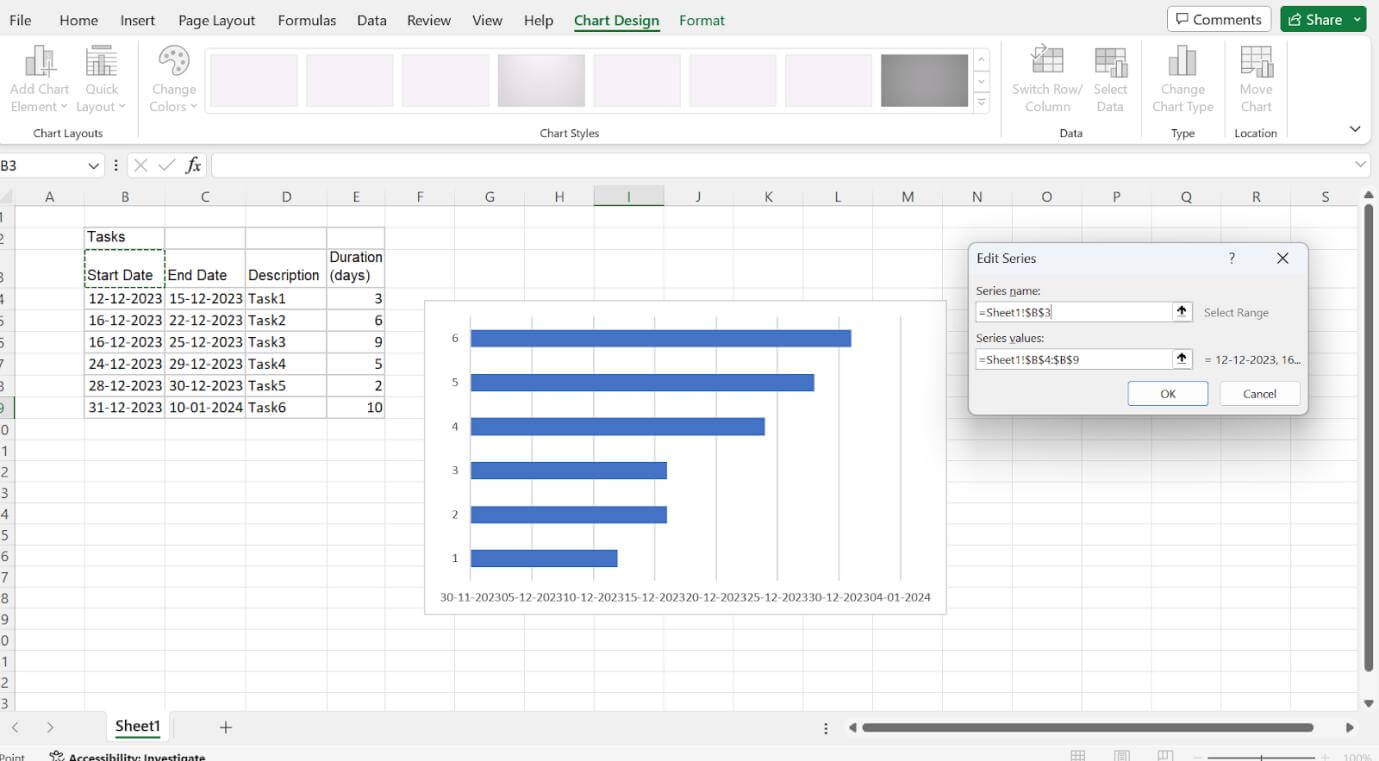
Click the first start date in your task table, drag your mouse down to the last start date, and release. This will highlight and input all the start dates into your Gantt chart. Make sure not to include the header or any extra cells.
After highlighting, click the arrow icon again, return to the previous window called "Edit Series," and click OK. Your Gantt chart should now display the start dates.
Step 4: Add Durations to Your Gantt Chart
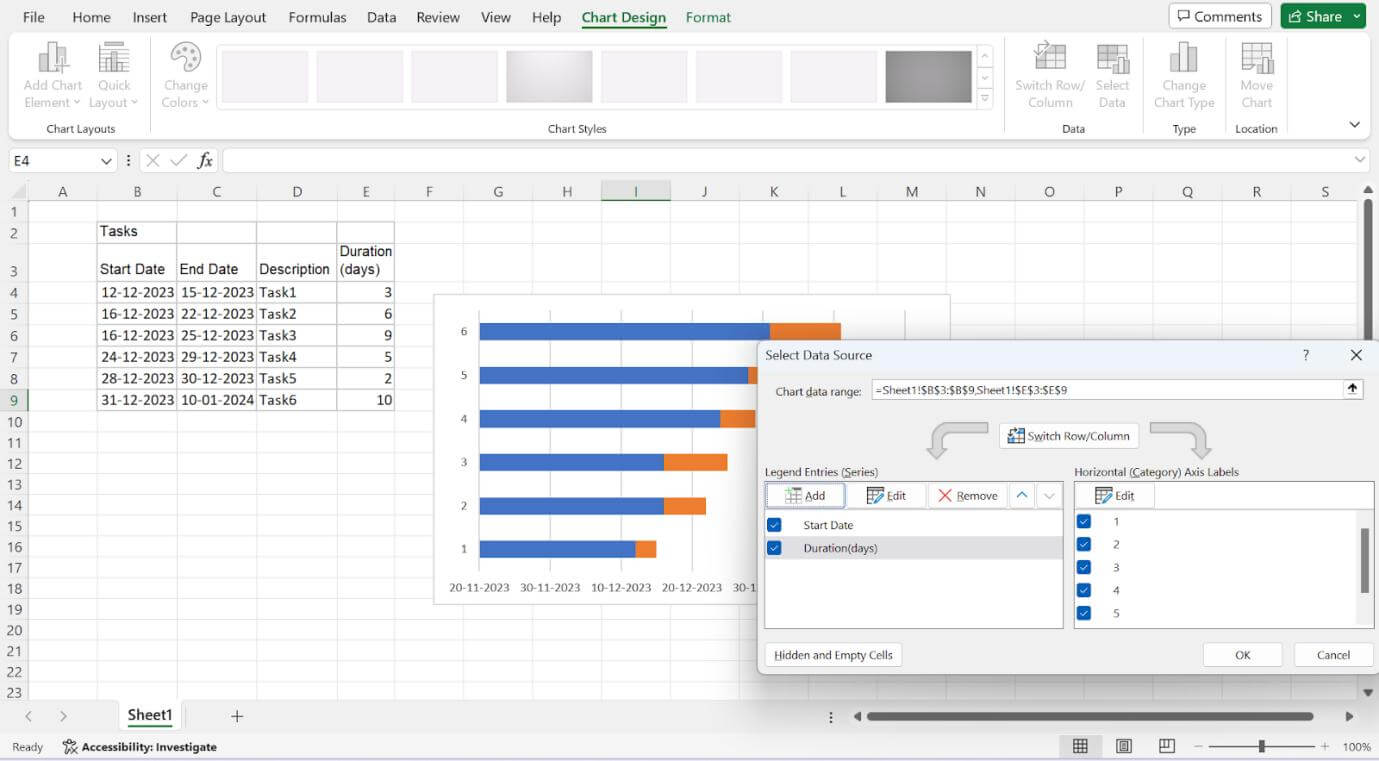
While still in the "Select Data Source" window, click "Add" again to open the "Edit Series" window for durations.
In the "Edit Series" window, click in the empty field under "Series Name," then click on the column header labelled "Duration" in your table.
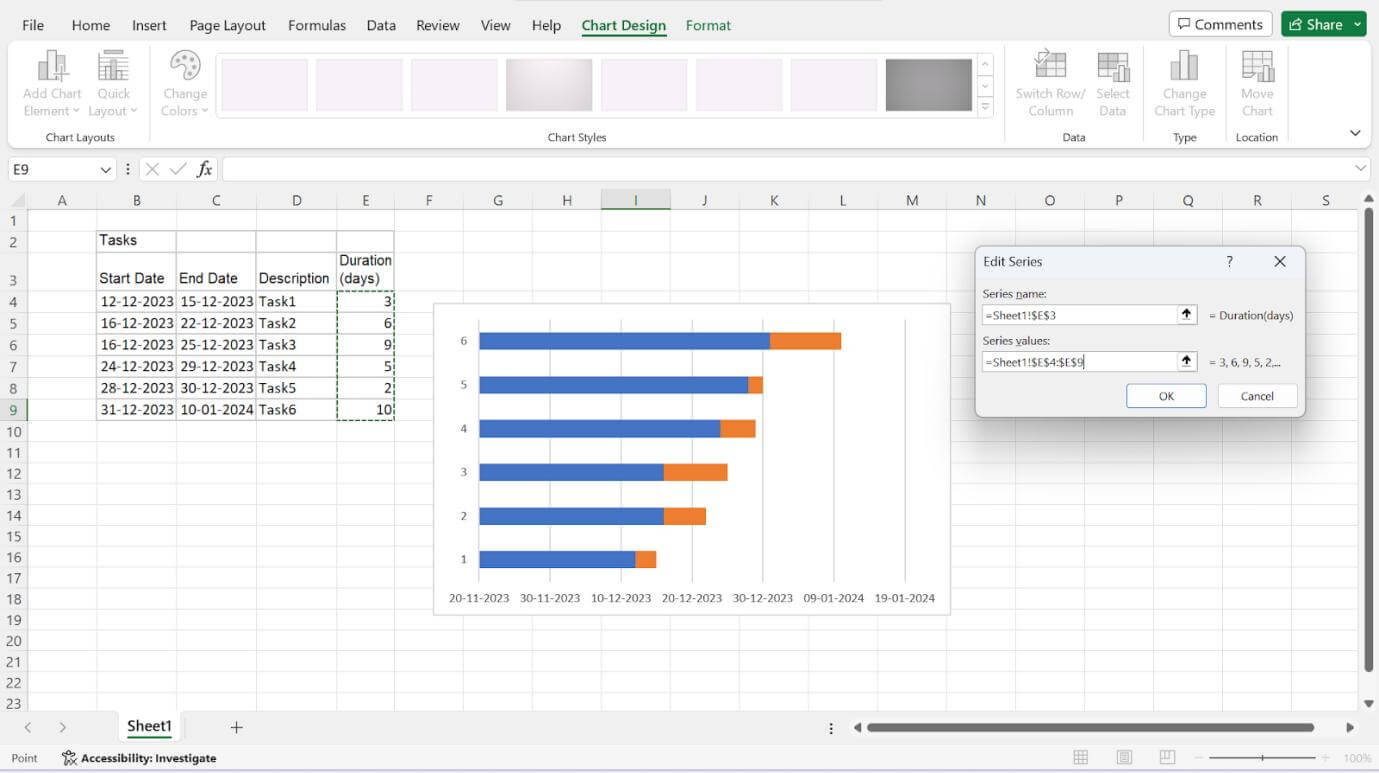
Now, go to the "Series Value" field, click the icon with a black arrow (Edit Series Button), and a new window will appear.
Click on the first Duration in your project table, drag your mouse down to the last duration, and release. This will highlight and input all the durations into your Gantt chart.
Click the black arrow icon again to go back to the previous window, then click OK. Now the "Select Data Source" window is seen again.
Click OK again to update your Gantt chart. It should now show both start dates and durations for your tasks.
Step 5: Add Task Descriptions to Your Gantt Chart
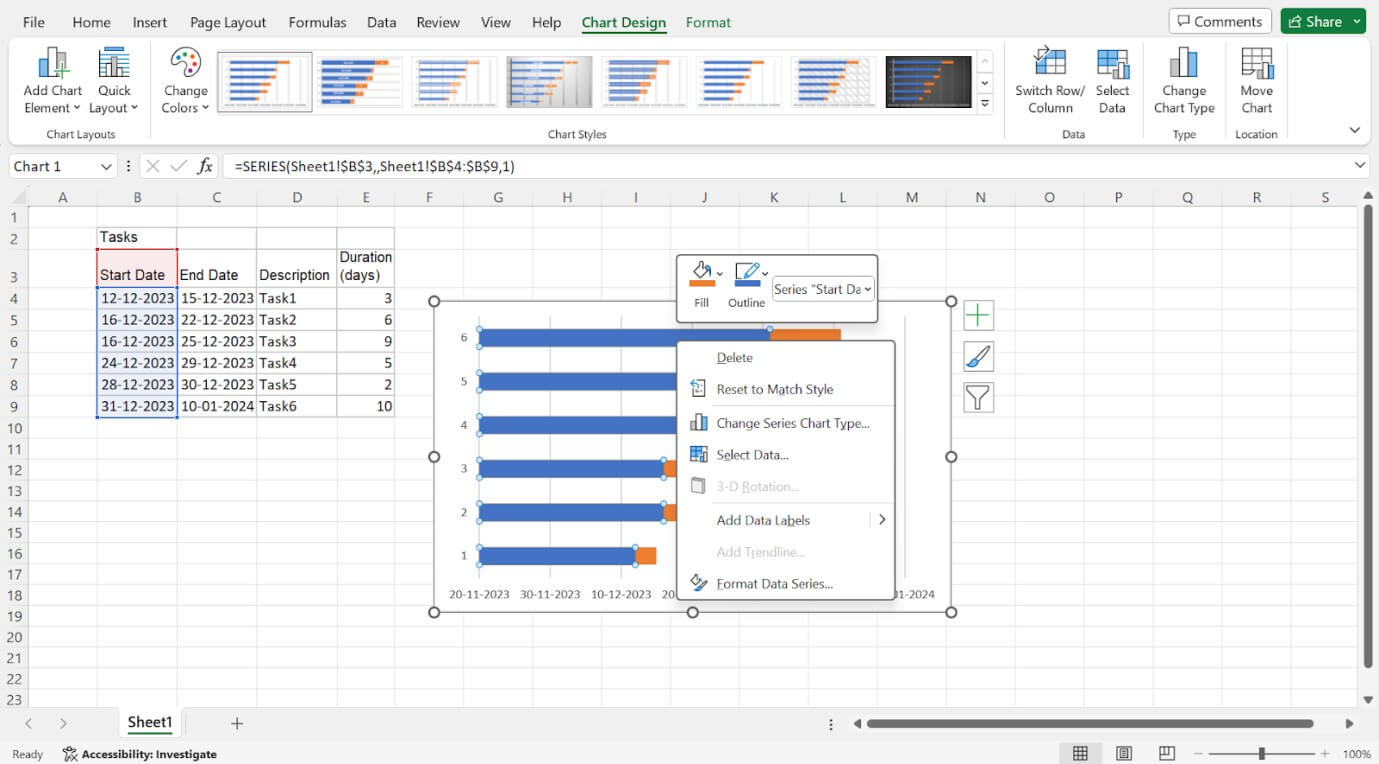
In this step now, right-click on one of the blue bars in the Gantt chart. Then choose "Select Data" to open the Select Data Source window.
Next, on the right side of the window, you’ll see a table named "Horizontal (Category) Axis Labels". There click "Edit" to open a smaller Axis Label window.
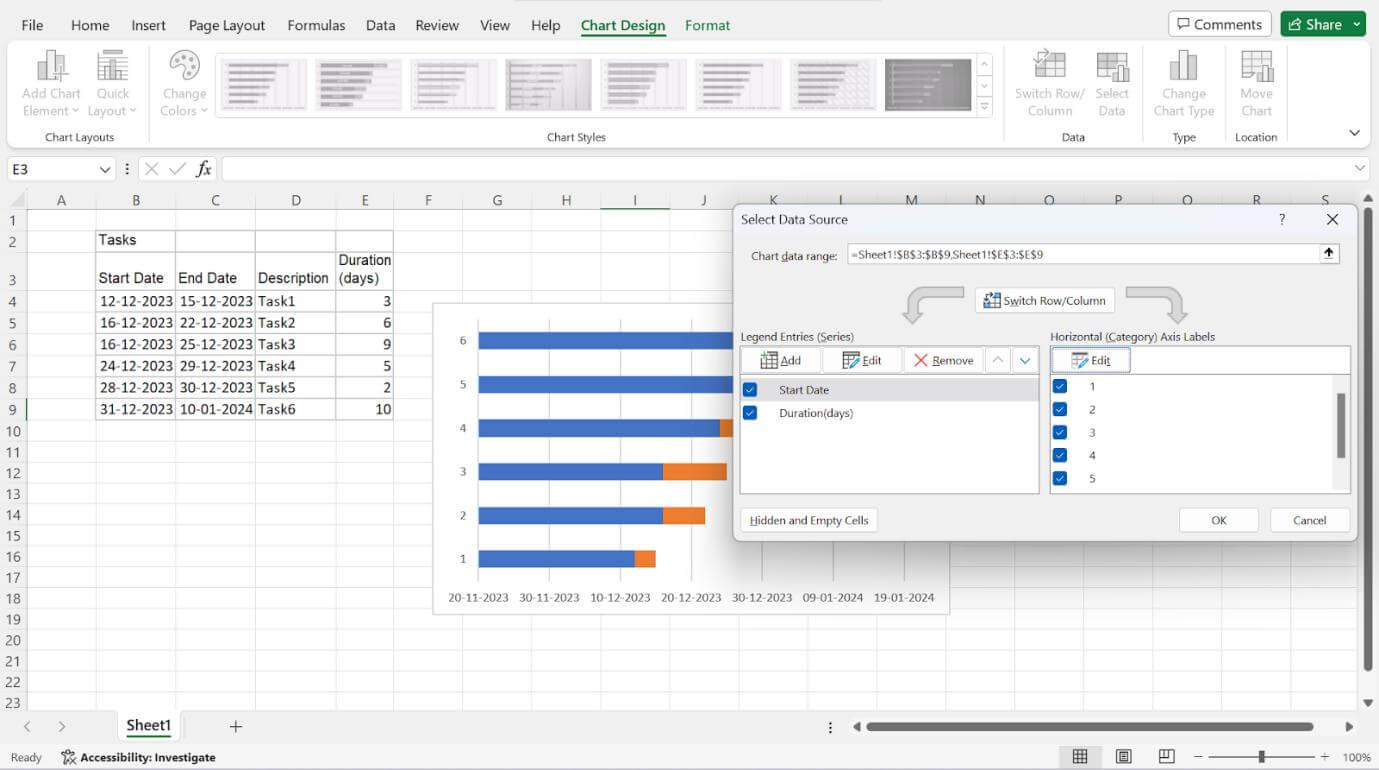
Click on the small spreadsheet icon, then click on the first task description (e.g., "Task1") and select all descriptions. Avoid selecting the column name itself.
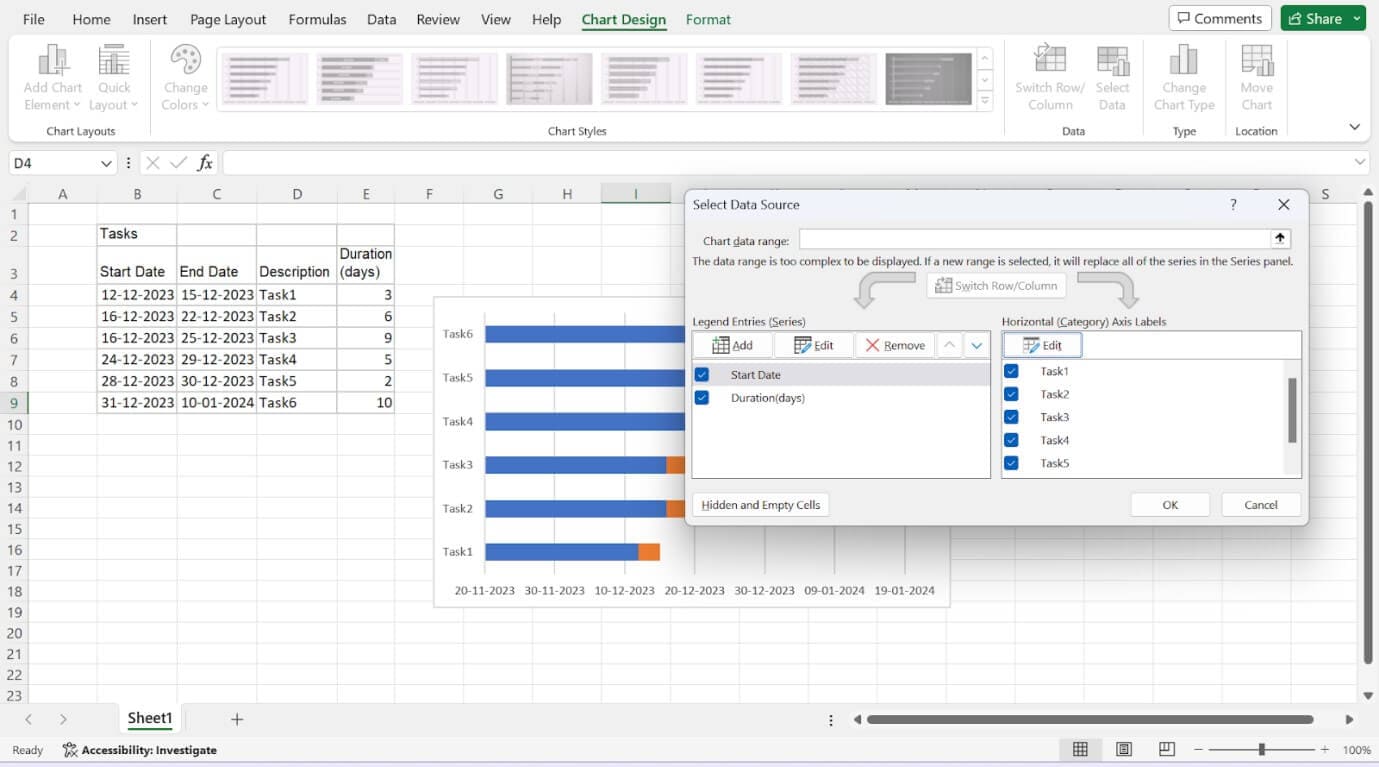
Once done, exit this window by clicking the small black arrow icon.
Click OK twice and close the Select Data Source window.
Now the Gantt chart should display the correct task descriptions next to the respective bars.
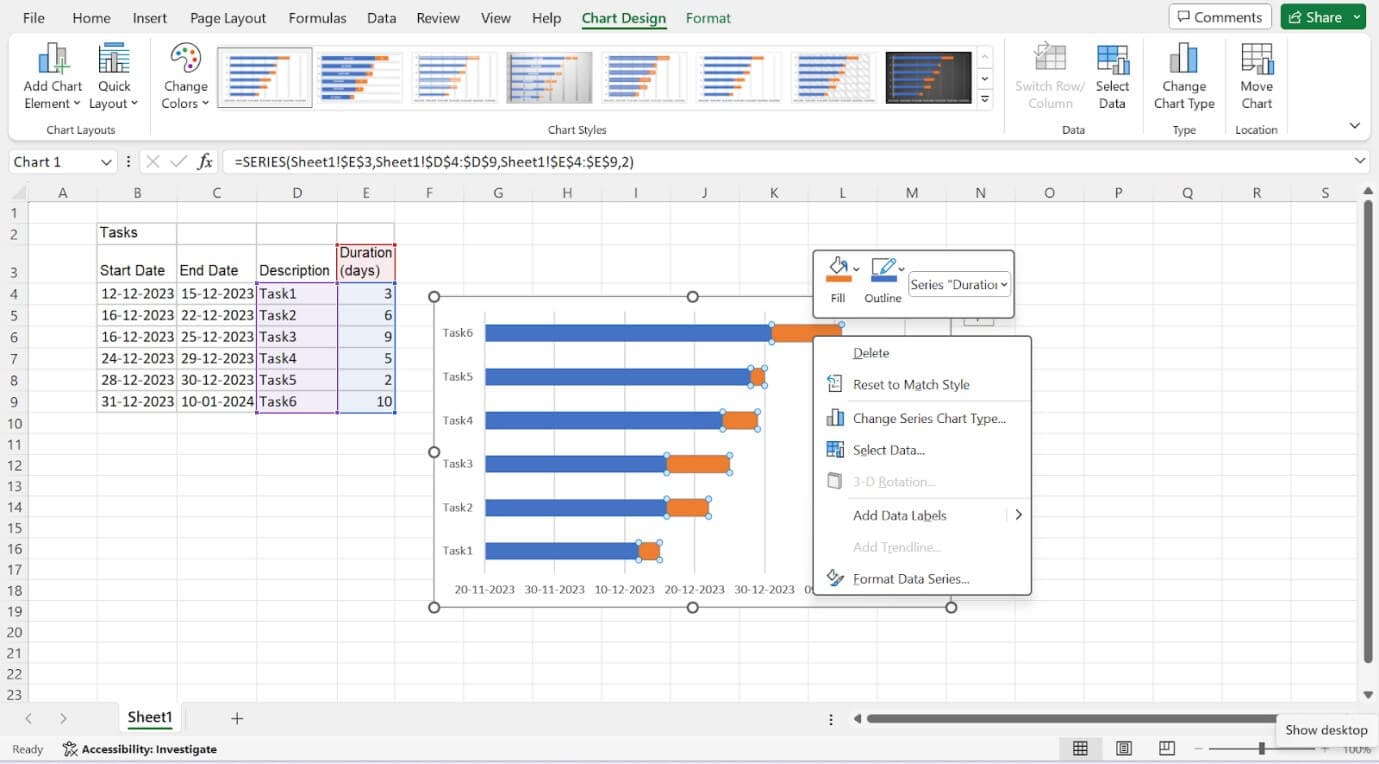
Step 6: Format Your Chart to Resemble a Gantt Chart
You have made a Stacked Bar chart thus far. Let's now make it look like a Gantt chart. We'll do this by making the blue portions of each taskbar transparent so that only the orange portions are visible.
Click on the blue part of any bar in your Gantt chart to select all taskbars. Now right-click and choose the "Format Data Series" option to open the Format Data Series window in Excel.
Now click the Format Data Series task pane. Then click on the Fill & Line icon (paint can symbol) for Fill & Line options. Under Fill, choose the "No Fill" option, and under Border, select "No Line."
Keep the Format Data Series task pane open for the next step.
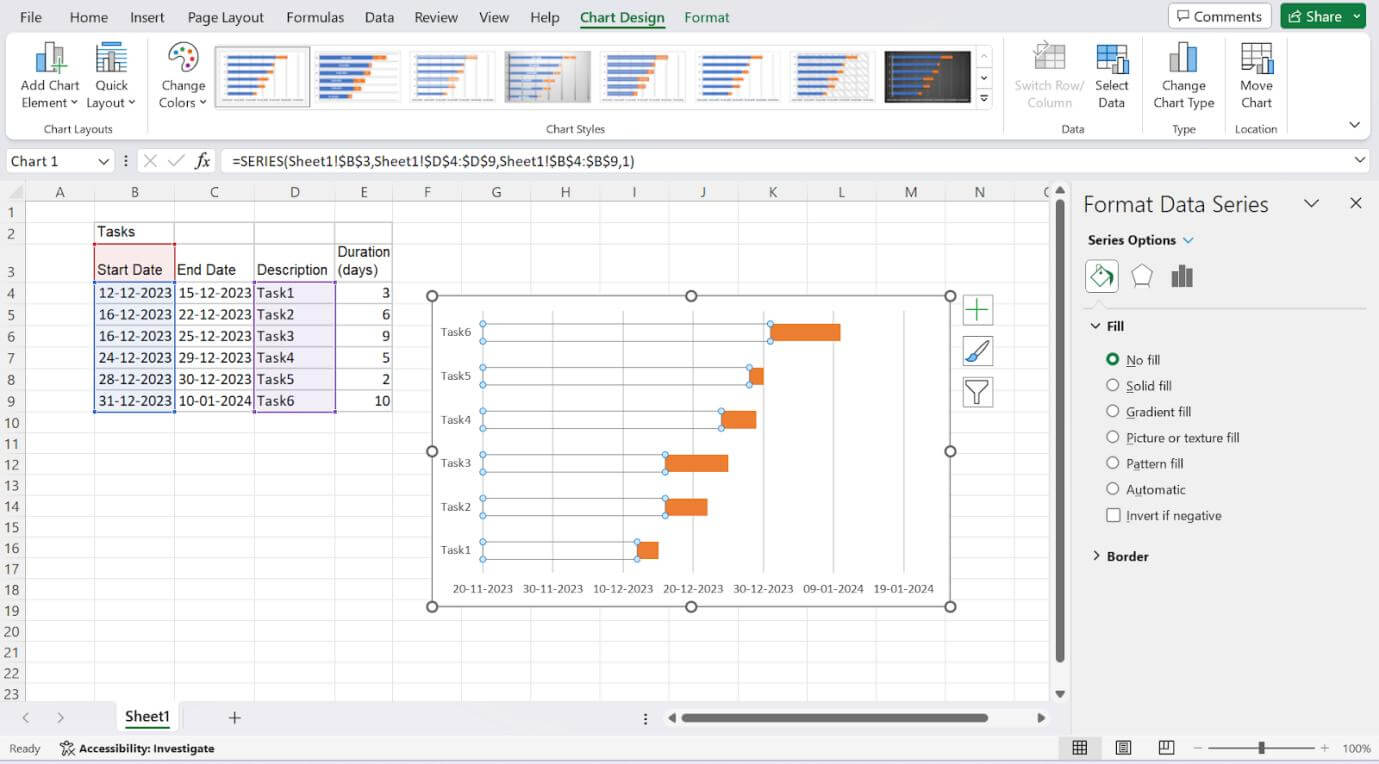
Your Gantt chart should now show only the orange parts of the bars. However, you might notice that the tasks are listed in reverse order, with the last task on top. To fix this:
Click on the list of tasks along the vertical axis to select them all, opening the Format Axis task pane.
In the Format Axis task pane, click on the Bar Chart icon to expand Axis Options.
Under Axis Options, in the Axis Position section, check the "Categories in reverse order" checkbox.
This rearrangement not only organises your tasks correctly but also moves the date markers to the top, making your Gantt chart resemble a typical Gantt chart.
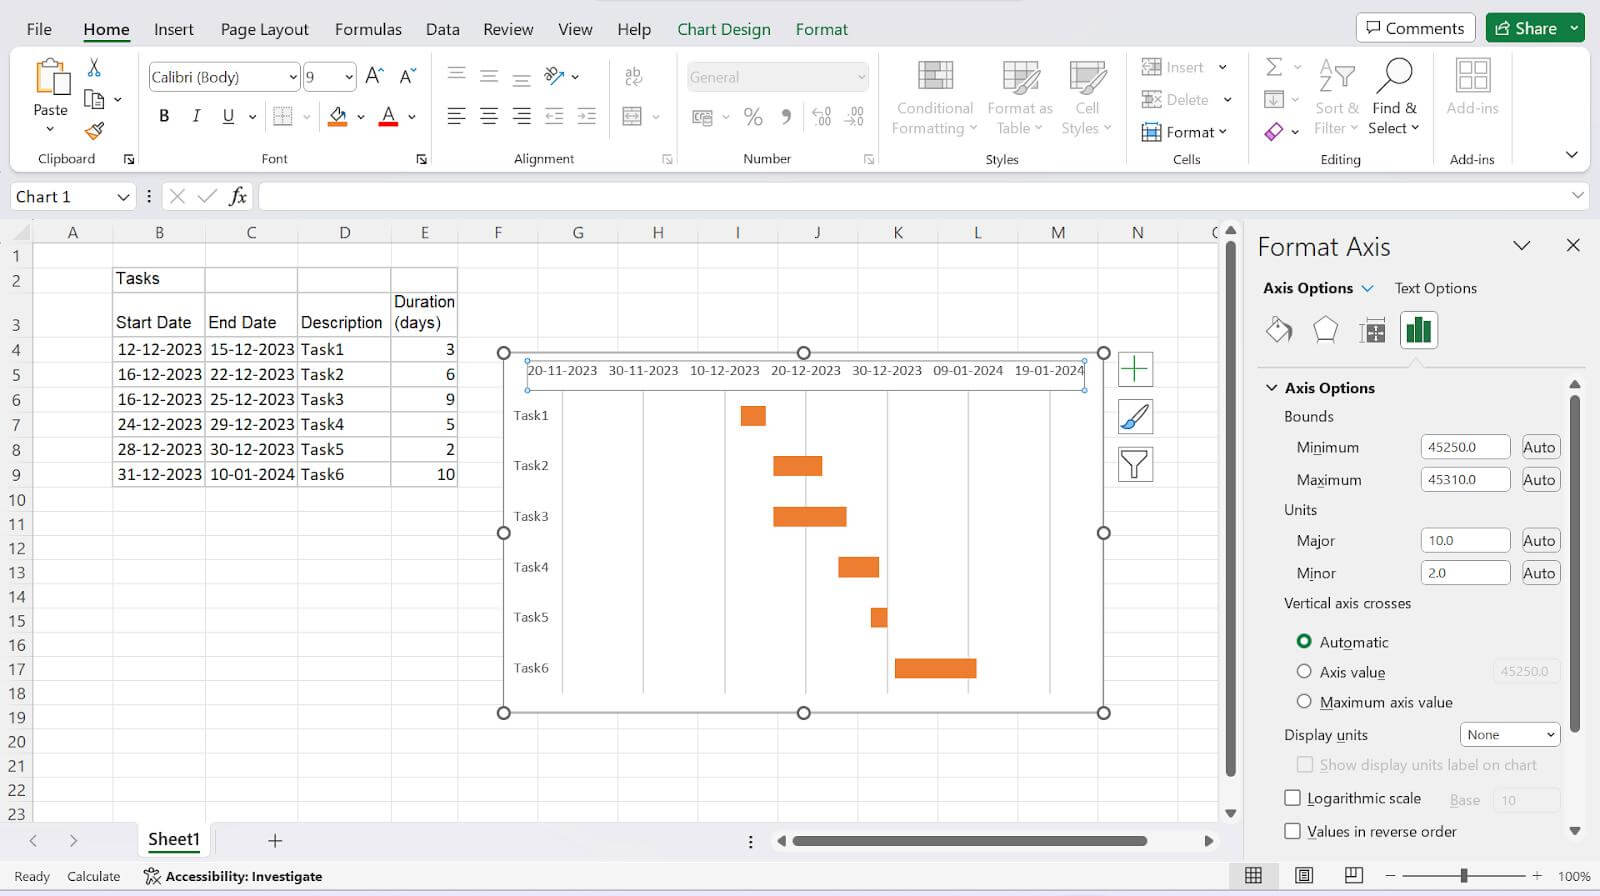
Step 7: Finalize Your Gantt Chart with Styling Tips
Reduce White Space
- Click on any date above the task bars to select them all.
- Right-click and choose "Format Axis" to open Axis Options.
- Note the current Minimum Bounds number under Bounds, and adjust it to bring tasks closer to the vertical axis.
Adjust Date Density
- In the same Axis Options window under Units, modify the Major unit number.
- Increasing it will enlarge the space between dates, reducing the number shown. Decreasing it will create extra room for more dates.
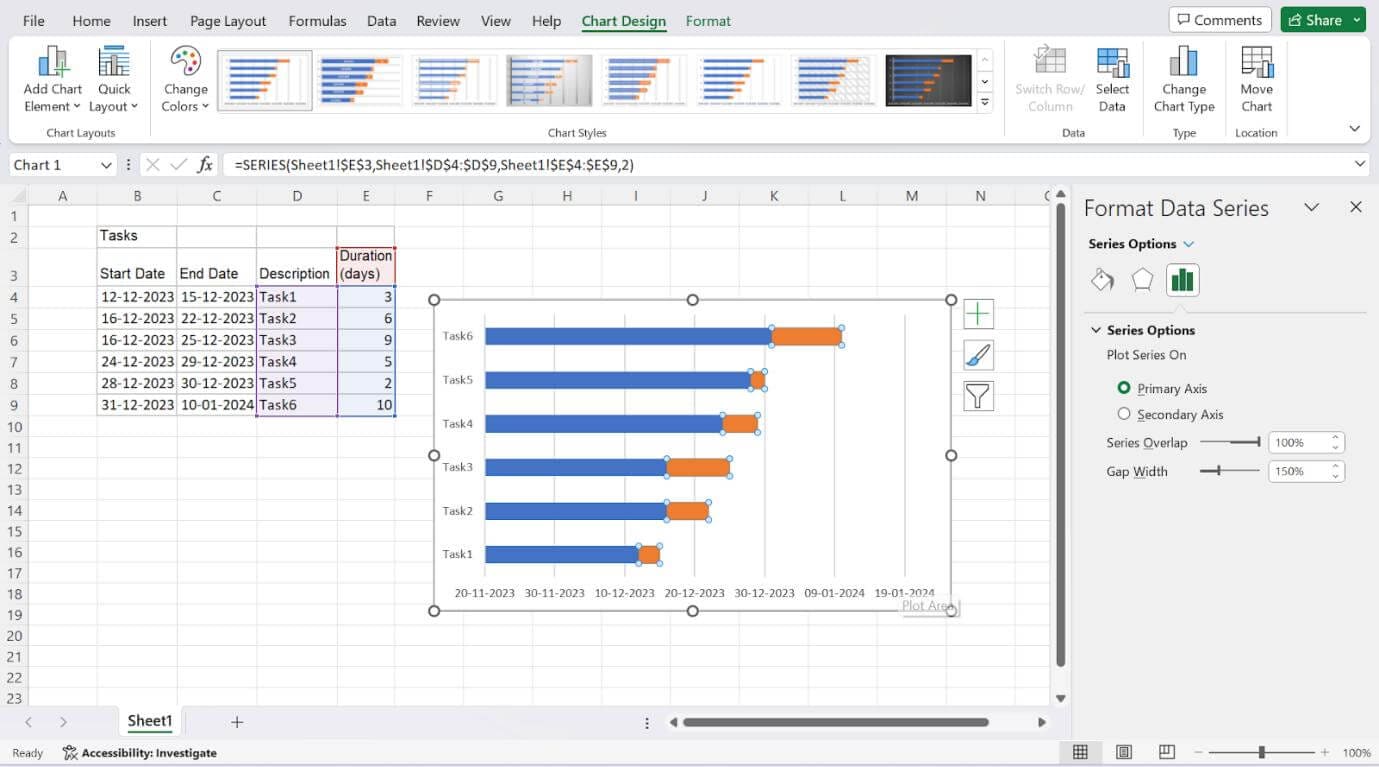
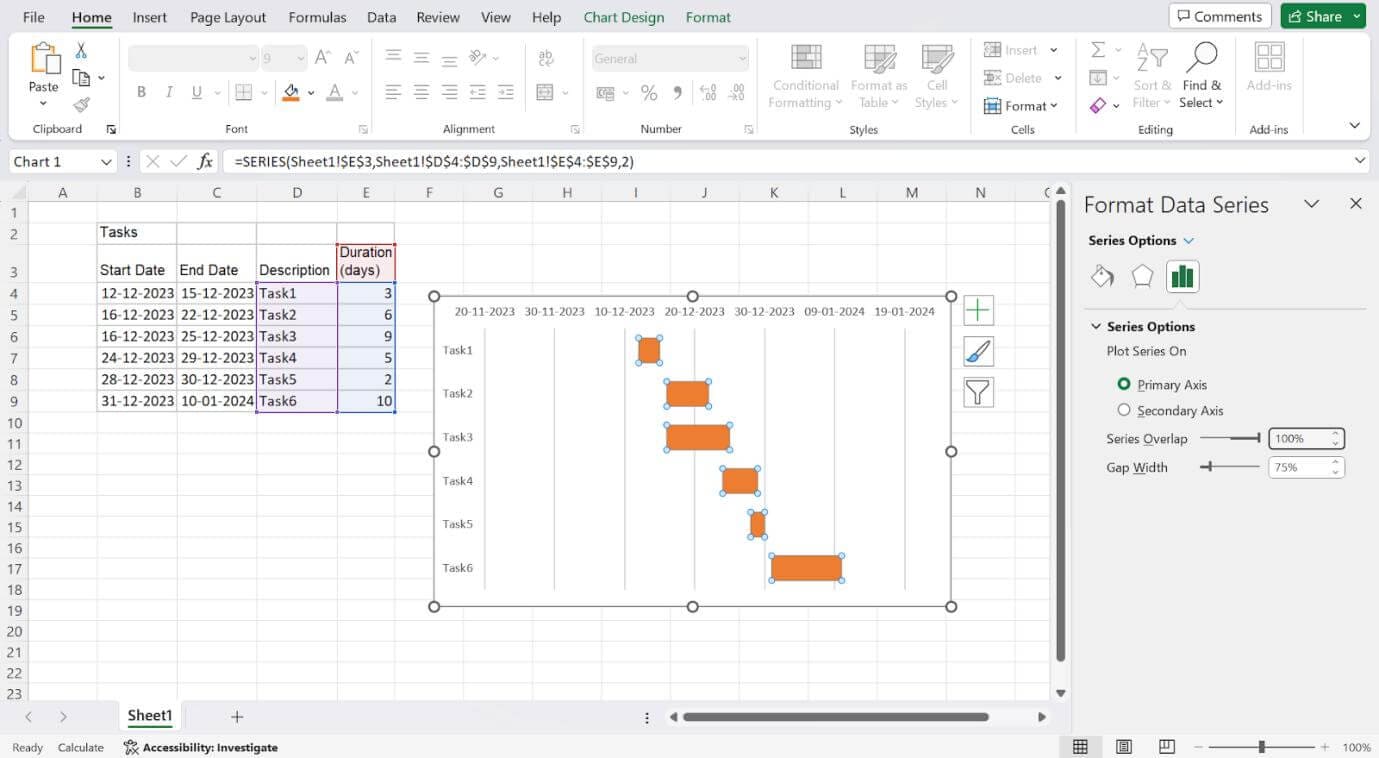
Task Bars
- Right-click on the first taskbar and choose "Format Data Series" to open the control.
- Under Series Options, adjust the Gap Width control to increase or reduce the size of task bars.
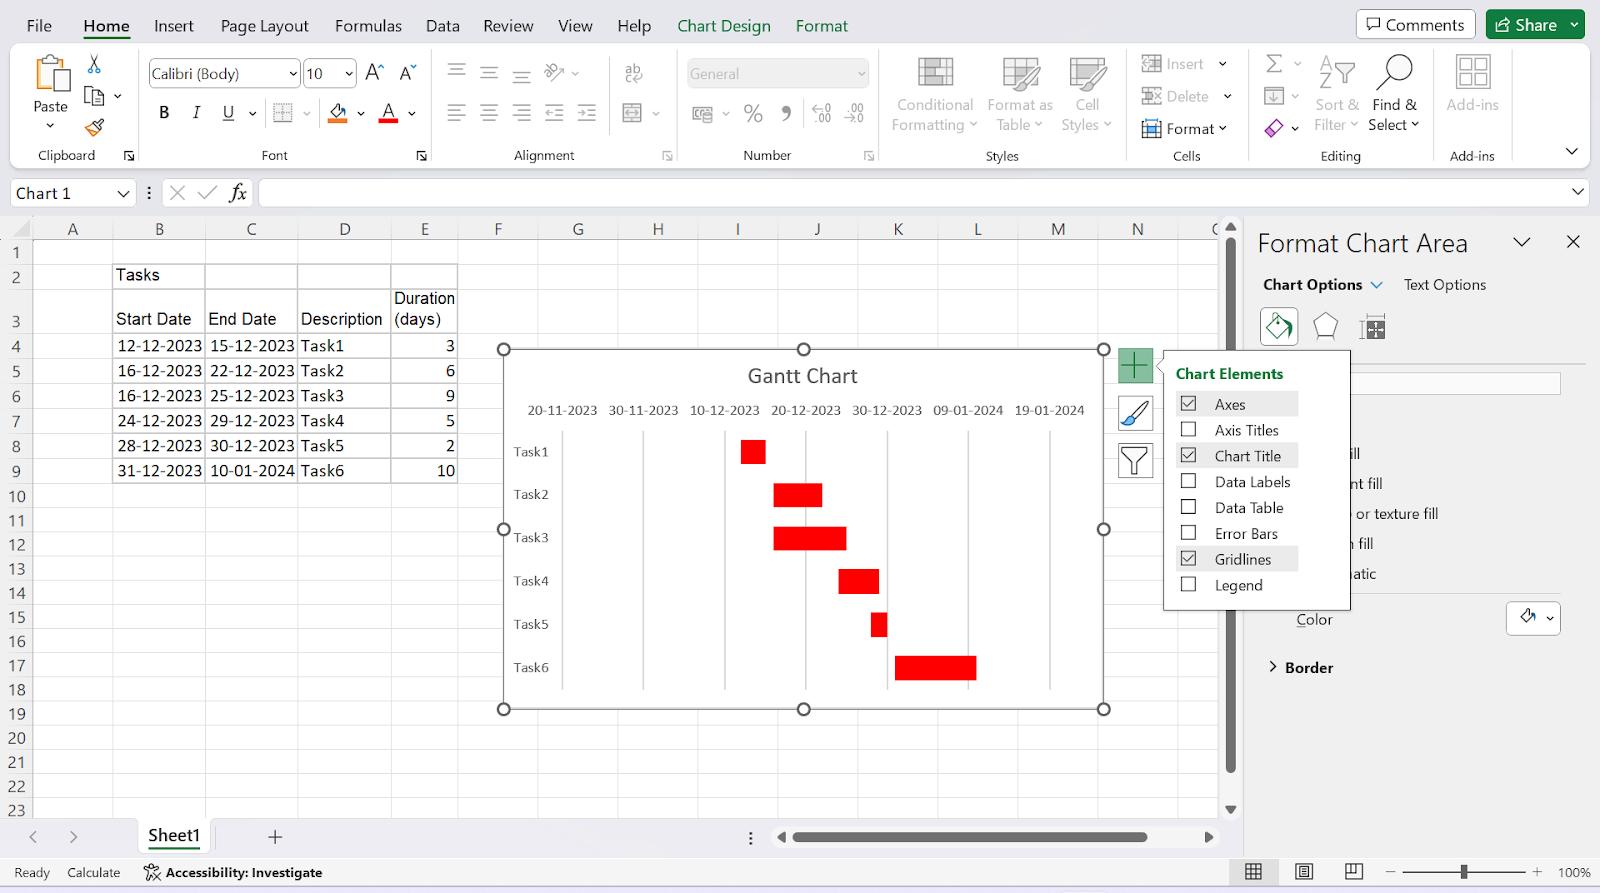
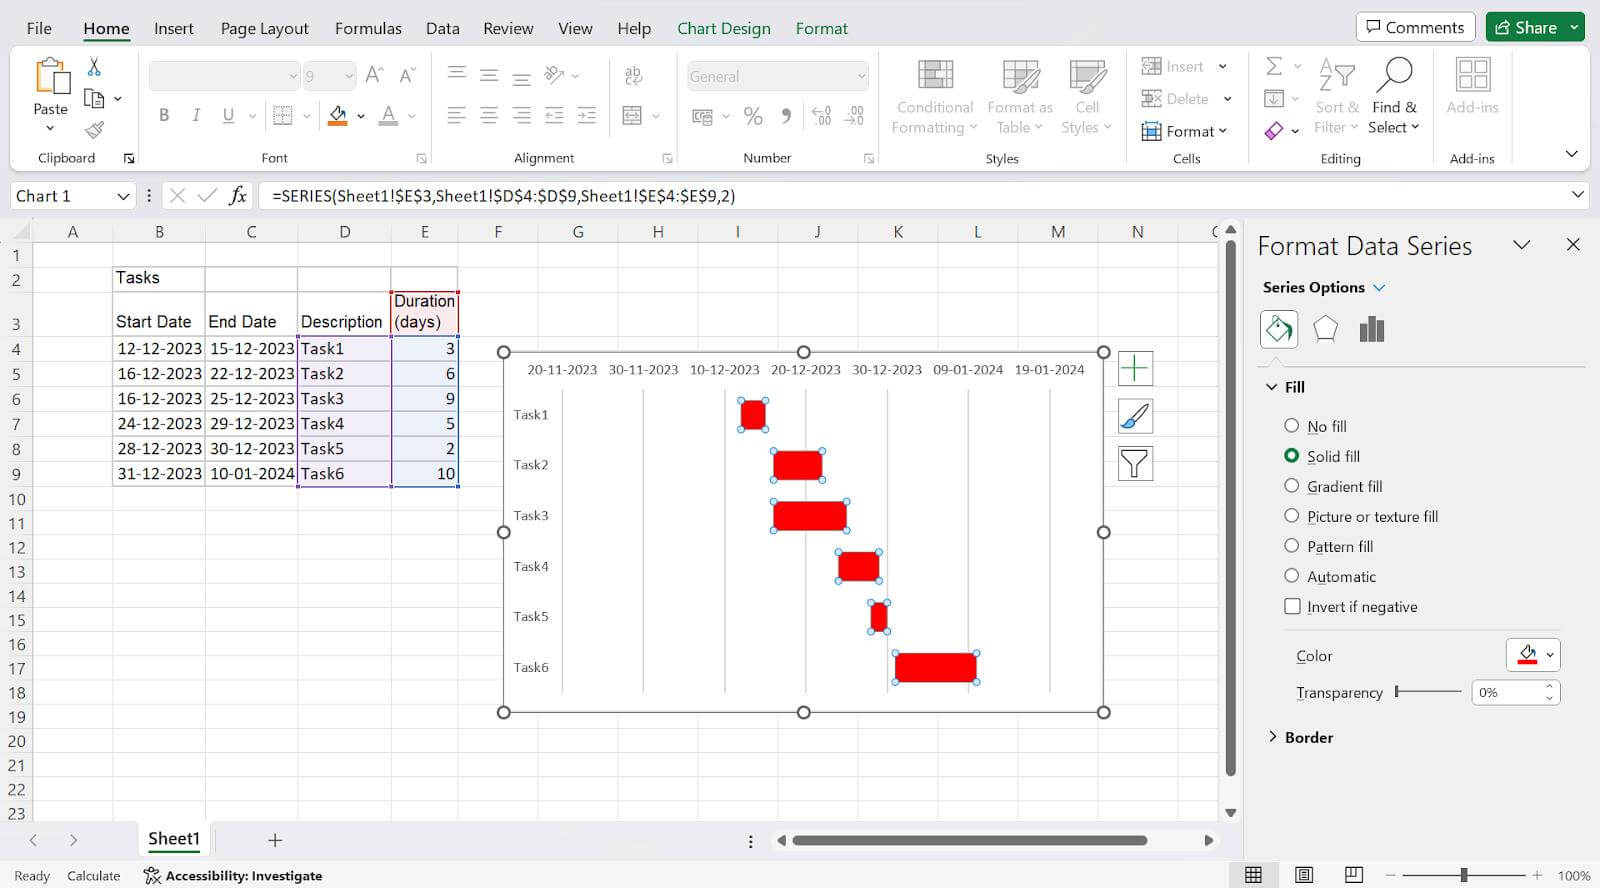
Customize Task Bars and Chart Area:
- Add a title to your Gantt chart.
- Change the colour of task bars (e.g., from orange to dark blue).
- Use Bold font for task descriptions.
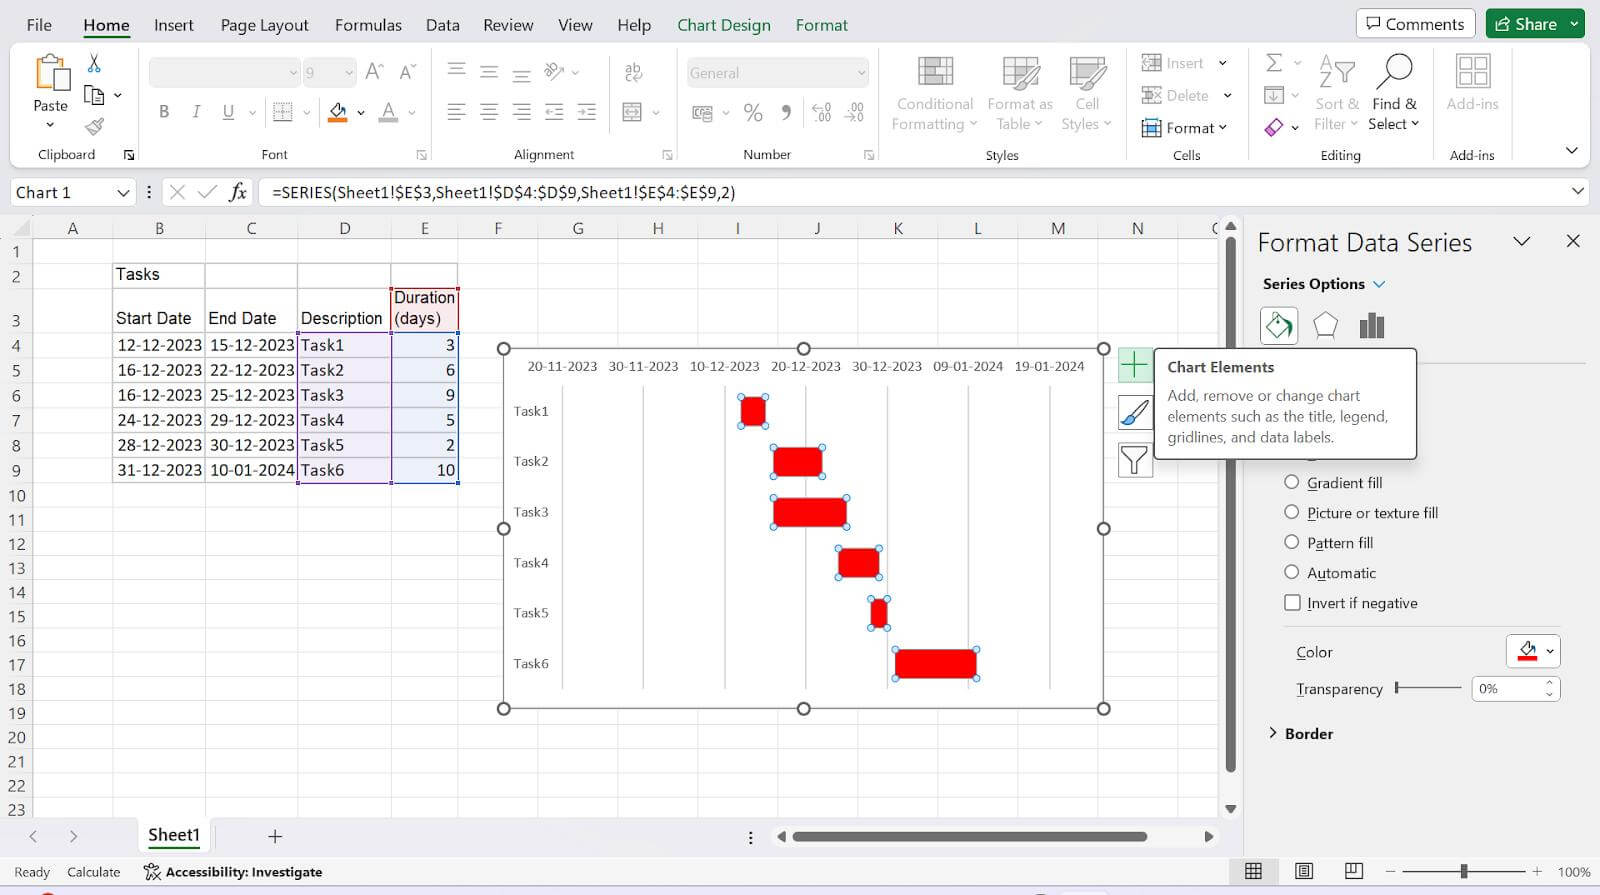
- To add a title, select the chart area, click the "+" button, and check the box for Chart Title. Double-click to type the name.
These final touches will enhance the appearance and legibility of your Gantt chart.
How to Make a Gantt Chart in EdrawMax
EdrawMax stands out as a versatile 2D diagramming tool, boasting the capability to generate over 210 types of diagrams ranging from flowcharts and organizational charts to mind maps, network diagrams, and engineering illustrations.
With its user-friendly Word 2010-like interface, EdrawMax caters to both organizational and individual needs, providing professional solutions. Its cross-platform compatibility ensures accessibility on all operating systems and mobile devices.
The online version, EdrawMax Online, extends the repertoire to more than 210 diagram types, making it a comprehensive visual solution. The cloud-based workspace facilitates seamless collaboration, allowing teams to work together in real-time on an expansive canvas, enhancing creativity and productivity. EdrawMax Online emerges as a powerful tool for visualizing ideas, streamlining workflows, and achieving project goals collaboratively.
Accessing Gantt Chart Templates in EdrawMax
To access Gantt Chart Templates in EdrawMax and create a Gantt chart for project management, following are the steps:
Step 1: Open EdrawMax
Download EdrawMax or try it online.
Step 2: Select Project Management Category
Navigate to the template library and locate the "Project Management" category. This can usually be found in the template selection interface or simply type "Gantt chart" in the search bar, This quick approach streamlines access to Gantt Chart templates.
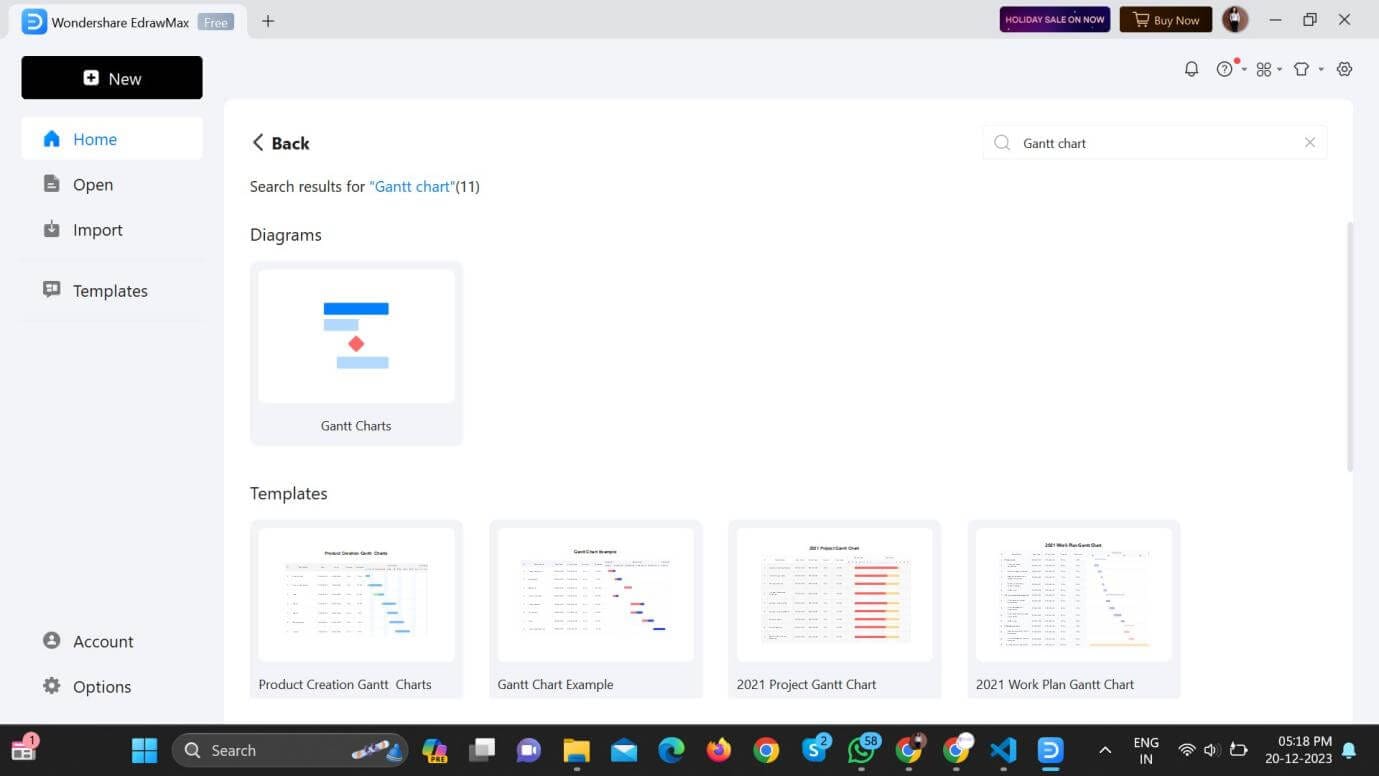
Step 3: Choose Gantt Chart Templates
Within the "Project Management" category, look for Gantt Chart templates. EdrawMax typically provides a variety of Gantt Chart templates suited for different project needs.
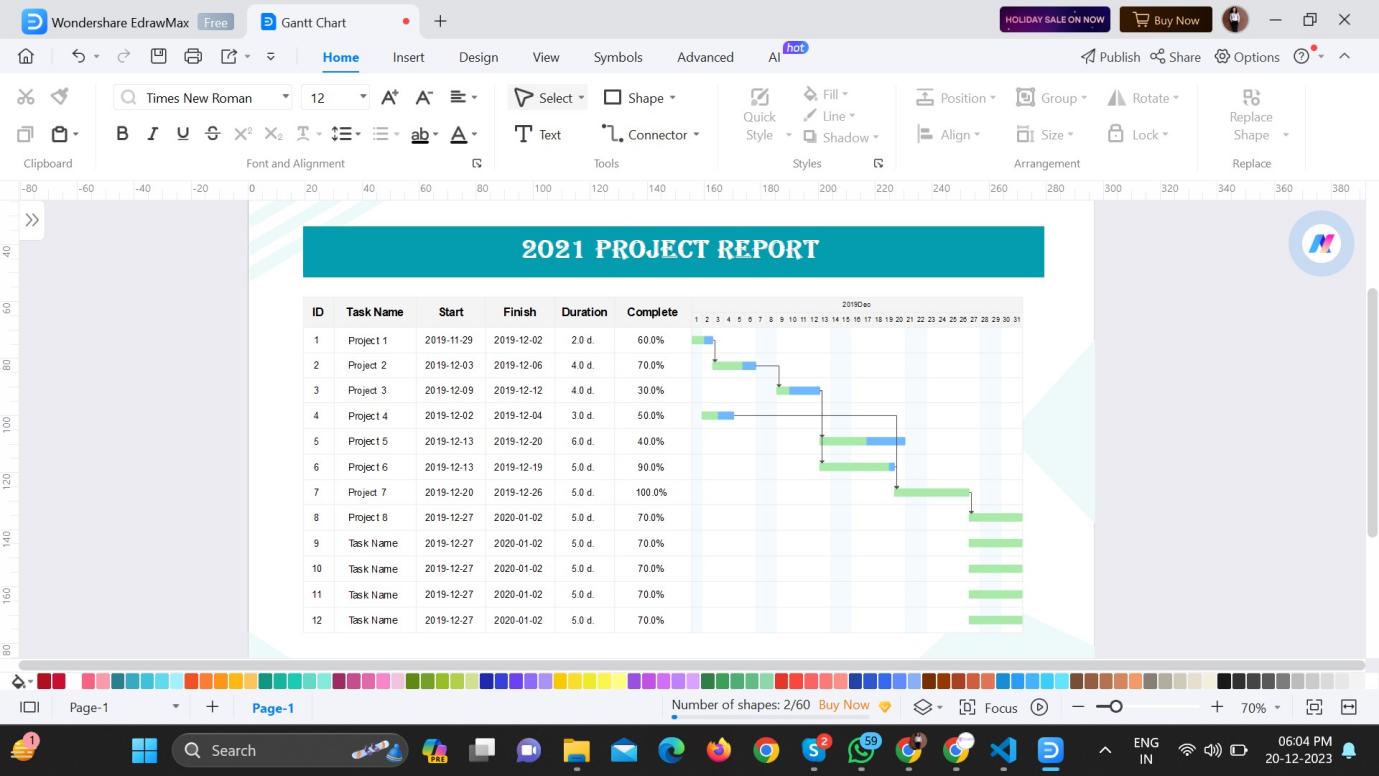
Step 4: Preview Templates
Preview the available Gantt Chart templates to find the one that best fits your project requirements. Consider templates that include fields such as Project ID, Task Name, Start Date, Ending Date, Duration of Task, and Percentage of Completion.
Step 5: Select a Template
Once you find a suitable Gantt Chart template, select it to open the template in the EdrawMax editor.
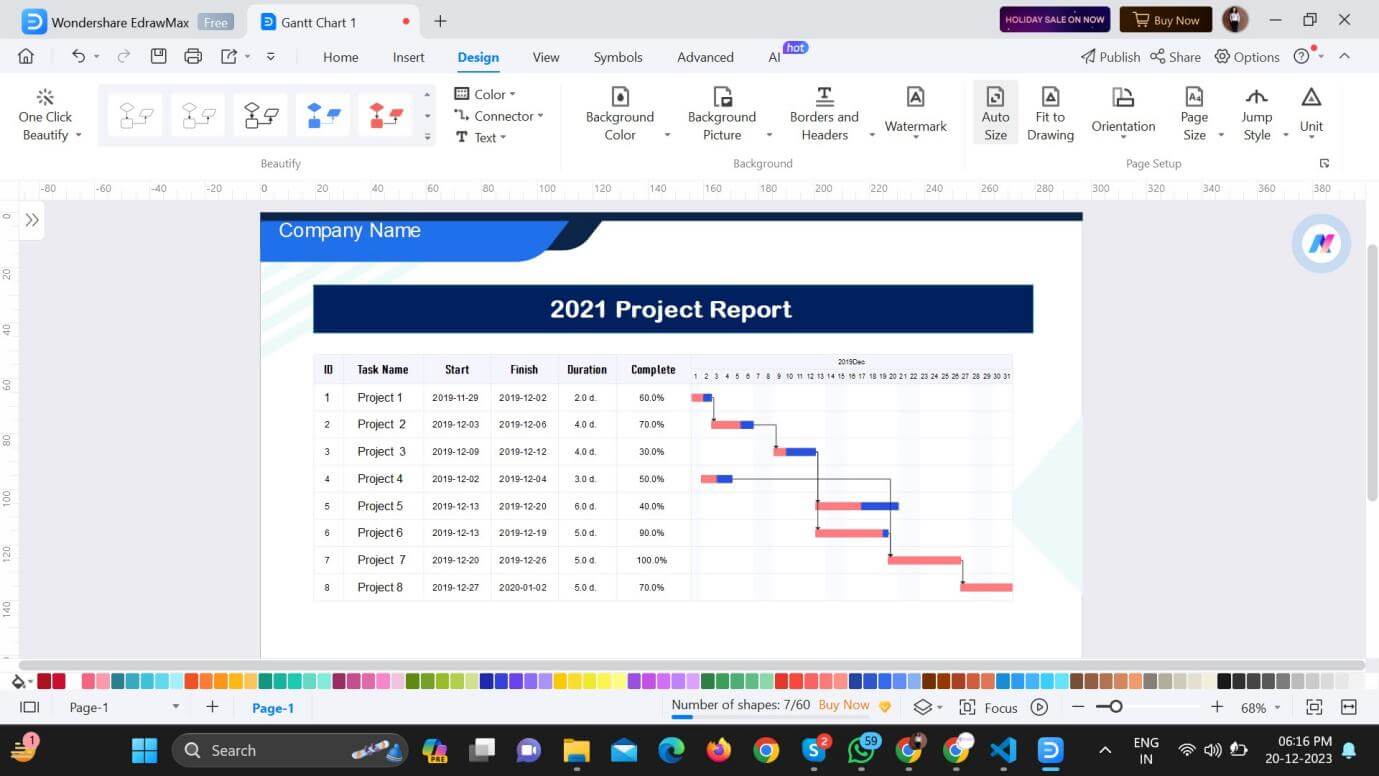
Step 6: Customise the Gantt Chart
After opening the template, you can start customising the Gantt Chart to fit your specific project details. Insert or edit fields such as Project ID, Task Name, Start Date, Ending Date, Duration of Task, and Percentage of Completion.
Step 7: Add Tasks and Details
Use the provided tools and options in EdrawMax to add tasks and input relevant details for each task.
Step 8: Save Your Project
Save your Gantt Chart project in EdrawMax to ensure you can access and modify it as needed.
Step 9: Export or Share
If required, you can export your Gantt Chart to various formats or share it with your team directly from EdrawMax.
By following these steps, you can easily access Gantt Chart templates in EdrawMax and create a project management chart with the specified details for Project ID, Task Name, Start Date, Ending Date, Duration of Task, and Percentage of Completion.
Customizing Gantt Charts in EdrawMax
Step 1: Open Your Gantt Chart
Start by opening the Gantt chart you want to customize in EdrawMax.
Step 2: Access Task Information
Click on individual tasks within the Gantt chart to access task information.
Step 3: Modify Task Names
Easily modify task names by selecting the task and editing the text. This allows you to update task details and ensure clarity in your project planning.
Step 4: Adjust Timelines
To modify timelines, click on the task's timeline bar and drag it to the desired start or end date. Alternatively, use the task properties panel to input specific start dates and end dates.
Step 5: Handle Dependencies
Explore the dependency lines connecting tasks on the Gantt chart. To modify dependencies, click on the line and adjust it according to the desired task relationship. EdrawMax's intuitive interface makes it easy to create and edit task dependencies.
Step 6: Color Code Tasks
Enhance visual clarity by color-coding tasks. Click on a task, navigate to the formatting options, and choose a color to represent different task categories or priorities.
Step 7: Resize Task Bars
Customize the appearance of your Gantt chart by resizing task bars. Click on a task bar and drag to adjust the duration, providing a visual representation of the task's timeline.
Step 8: Add Task Details
For more comprehensive information, add details to each task. Utilize the task properties panel to input additional information such as task duration, resources, and completion status.
Step 9: Save Your Customization
Once you've made the necessary modifications, save your customized Gantt chart in EdrawMax to preserve your changes.
EdrawMax's user-friendly interface and easy customization options allow users to easily customize Gantt charts to their own projects requirements.
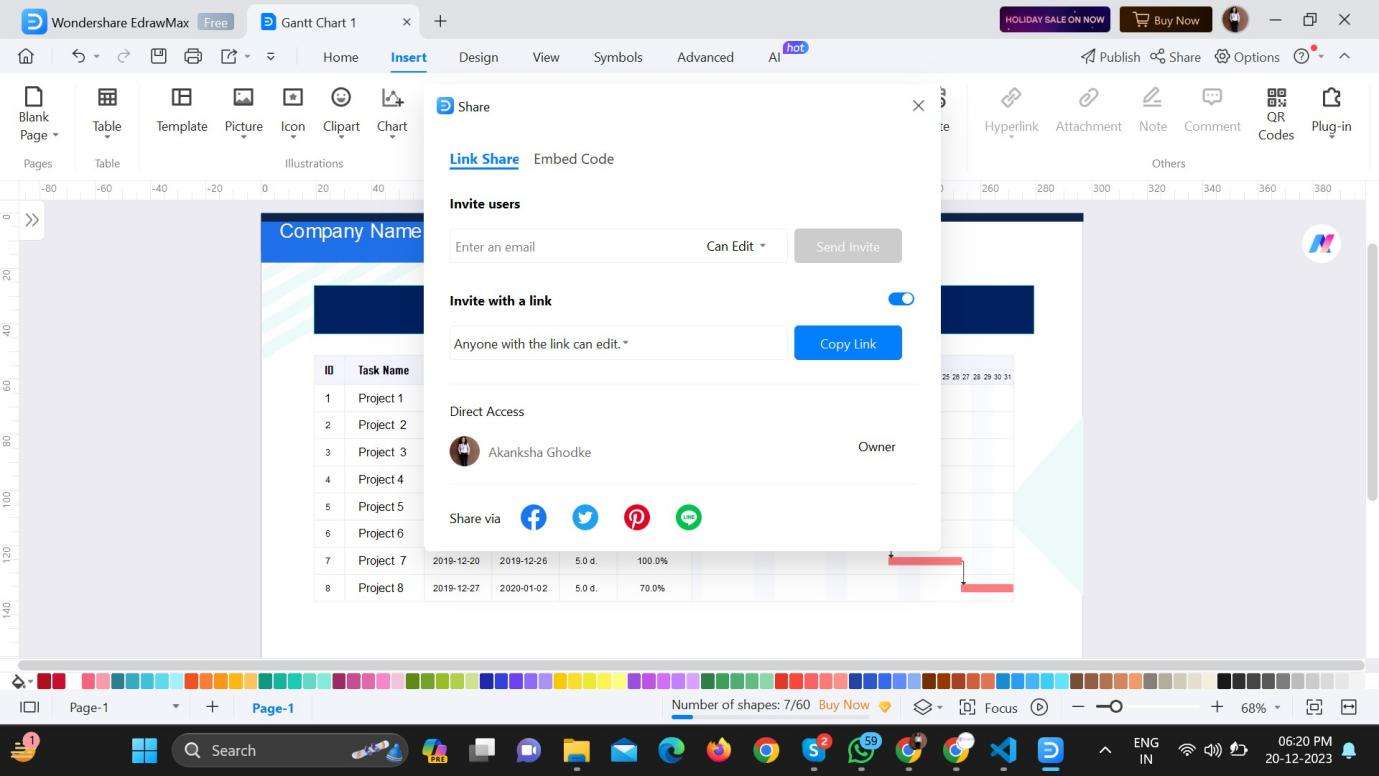
Collaboration and Sharing
EdrawMax streamlines teamwork through Collaborative and Sharing features:
- Cloud-Based Workspace: Access a shared cloud workspace for real-time collaboration.
- Real-Time Editing: Simultaneously edit diagrams with team members, ensuring instant visibility of changes.
- Commenting and Feedback: Communicate within the diagram, fostering real-time discussions and feedback.
- Access Control: Manage permissions to control editing and viewing access for team members.
- Template Sharing: Share diagrams effortlessly by sending invitations or generating links for access.
- Export: Export diagrams in various formats and integrate with other collaboration tools.
EdrawMax's collaborative features empower teams to work efficiently, communicate seamlessly, and enhance overall productivity.
Additional Tips for Gantt Chart Mastery
Utilising Advanced Features in EdrawMax
To enhance your management experience, check out EdrawMax's advanced features for more information on adding Gantt charts. Explore tools like critical path analysis, which identifies the most important activities affecting uptime for operational planning and risk mitigation.
Additionally, use EdrawMax's resource management feature to efficiently allocate and track resources to ensure efficient use throughout the project. By integrating these advanced features, users can improve their project management skills and use a more efficient and intuitive Gantt chart design in EdrawMax.
Integration with Project Management Tools
EdrawMax provides seamless compatibility with a variety of project management tools, increasing overall project efficiency and collaboration. Users can easily integrate EdrawMax with their business management plans to streamline their operations. This integration ensures data consistency by allowing Gantt charts and other charts to be easily transferred between EdrawMax and external management tools.
Whether connecting projects, updating schedules, or sharing progress, EdrawMax's compatibility with project management tools facilitates a cohesive and efficient project management experience, promoting effective communication and coordination among team members.
Why Choose EdrawMax for Gantt Chart Creation?
EdrawMax is the preferred tool for Gantt chart creation, providing excellent results. The user-friendly interface facilitates the ease to use and operation of the campaign by providing easy access to users of all levels. The variable library simplifies the design process and provides users with a variety of predefined Gantt charts and other templates.
Additionally, EdrawMax excels in high-level functions by integrating critical analysis and resource management, enhancing the depth and planning capabilities of Gantt charts.
Collectively, these features make EdrawMax the best choice for creating a Gantt chart, providing a project management experience by combining user-friendly templates, a rich database, and advanced features.
Conclusion
In conclusion, EdrawMax empowers project managers with a user-friendly interface, diverse templates, and advanced functionality for Gantt charts.
Seamless integration with project management tools enhances efficiency, while the step-by-step guide simplifies Gantt chart creation in Excel and EdrawMax. Transitioning to EdrawMax introduces cloud-based collaboration, transforming project management with precision and efficiency.