


Program Evaluation Review Technique (PERT) chart is a model of order and efficiency. The complexity of project planning and execution is greatly reduced with the help of this effective visual tool. It provides an unobstructed, high-level picture of the activities, dependencies, and best course of action for completing the project.
The primary function of a PERT chart is to help project managers establish reasonable deadlines, plan for enough resources, and keep their projects on track. It's an interactive tool for seeing the progression of a project in a way that improves collaboration and decision-making.
This article is written for those learning about PERT charts and seasoned project managers wishing to use online PERT chart production tools. In addition to learning why PERT chart in project management is so useful, you'll also walk away with some tips for using them effectively in your projects. Let's start on the journey to better project management and more successful projects.

In this article
Part 1. How to Draw PERT Chart Online
Creating a PERT chart online is easy with our efficient diagramming tool, EdrawMax. It is an easy-to-use AI-powered tool that helps you with diagram creation and analysis and provides suggestions for effective results.
Below is an easy-to-follow instruction to make a PERT chart step by step using EdrawMax online.
Step1
Sign in to EdrawMax with your Wondershare, Google, Twitter, or Facebook account or open EdrawMax Online for web.
Step2
Choose the desired PERT chart template for EdrawMax Template gallery. You can quickly get results for PERT chart templates by typing it in the search bar.

Step3
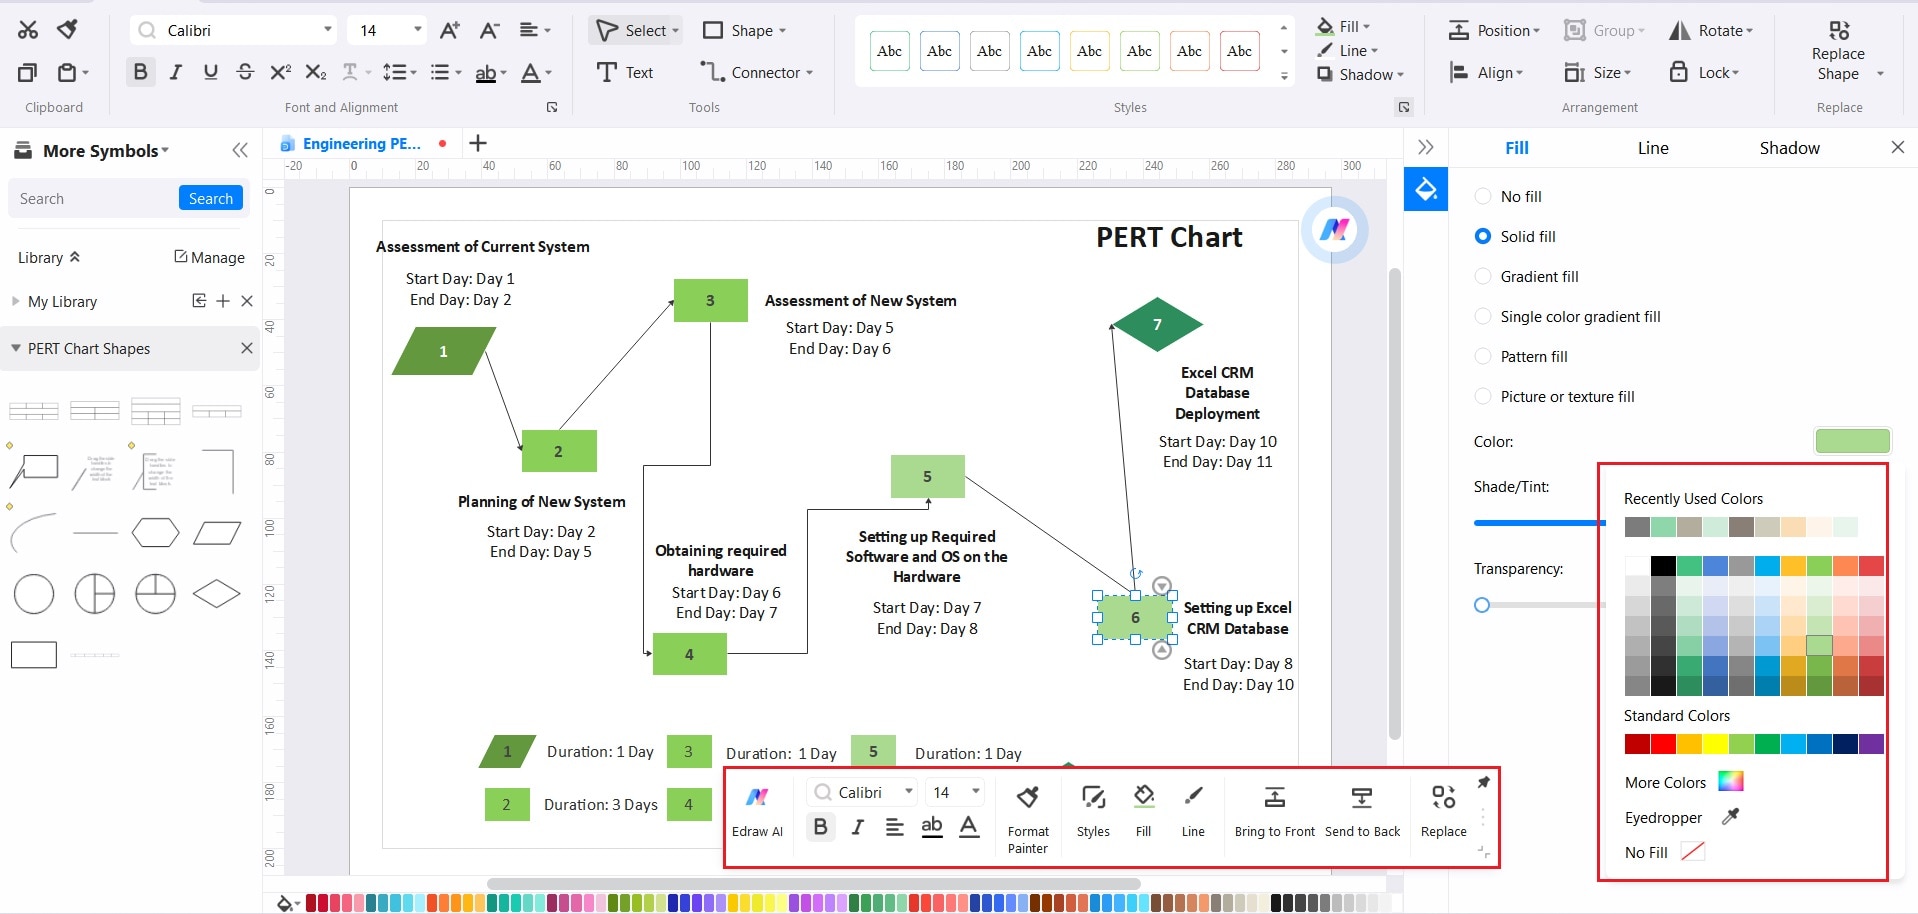
Customize the template by double-clicking the area/shape you want to edit and replace with the new. Ensure everything is displayed correctly in your PERT chart, including tasks, dependencies, durations, and deadlines.
Step4
Adjust the colors, fonts, and styles in EdrawMax Online to fit your project's aesthetic or your tastes.
Step5
You can download the PERT chart in multiple file formats on your device and also share it with your team to facilitate collaboration.
Part 2. Why Use EdrawMax for PERT
Tools that simplify planning and carrying out complicated projects are increasingly important in the dynamic field of project management, and EdrawMax is one of those. It is a feature-rich online application that helps project managers manage their projects easily in addition to creating diagrams like Gantt Chart, PERT charts and more.
When it comes to making PERT charts, which are essential for visualizing the timelines of projects, activities, and dependencies, it offers the following amazing features:
- User-Friendly Experience: The UI of EdrawMax is well thought out and simple to use. Whether you're just starting or have years of experience, this tool is beneficial and helps you create PERT charts quickly.
- Variety of Templates: To help you get started quickly, EdrawMax offers a variety of pre-made PERT chart examples. Using a template allows you to quickly and easily adapt to your project's changing needs.
- Drag-and-Drop Functionality: The PERT chart creation tool allows you to easily add tasks, milestones, and dependencies using a simple drag-and-drop interface. The time spent creating charts is reduced.
- Customization Options: You can make your own unique PERT charts with the help of EdrawMax. You have complete control over the look and feel of your project by changing the colors, fonts, shapes, and styles to your liking.
- Real-Time Collaboration: EdrawMax facilitates efficient teamwork. Team members can edit the same PERT chart in real time, improving communication and efficiency.
- File Export and Sharing: Exporting your PERT charts to common file types like PDF, PNG, Excel, Word, and others simplifies sharing your work with colleagues and external parties.
- Platform independence: Since it is hosted in the cloud, EdrawMax Online works with any system or device, making it ideal for distributed teams.
- Cost-Effective: By doing away with the requirement for costly desktop software, EdrawMax provides a low-cost alternative for project managers.
Part 3. Top Three Templates from EdrawMax’s Templates Community
Project managers and other professionals can find useful tools and resources in EdrawMax's wide template community, such as PERT (Program Evaluation Review Technique) chart examples. Here are three of EdrawMax's most impressive PERT chart samples:
Simple PERT Chart Template
The template works well for showing the relationships between different parts of a project. It simplifies chart development with clearly delineated task shapes and easy connectors, giving you confidence in the accuracy and aesthetics of your project's timeline depiction.
This template proves to be extremely useful when creating charts for production planning projects. You can also present the project to clients or team members who can respond better to a visually exciting portrayal.

 below.
  below.
Colorful PERT Chart Template
The template is for individuals who desire a more eye-catching presentation of their PERT data. The usefulness of PERT charts is combined with an engaging visual style in this template.
Using contrasting colors for tasks, arrows, and landmarks improves the chart's visual attractiveness and helps identify task types and relationships rapidly. You can use this template for path planning, resource allocation, float or slack calculation, schedule development and control and more.

Detailed PERT Chart Template

This in-depth PERT chart template by EdrawMax is an all-inclusive tool for serious workers. Since it uses project management techniques, you can include more information like distributing resources, critical path analysis, and cost projections.
This template is a great option if your project is more detailed and you want all the projects to be on track and under budget by better managing project resources and optimizing project timelines.
Part 4. Tips for Making PERT Charts
Managing projects successfully requires creating PERT (Program Evaluation Review Technique) charts. PERT charts are a graphical method of communicating project tasks, dependencies, and schedules. Keep these helpful hints in mind while creating your PERT chart to maximize its accuracy and utility:
Define Clear Task Dependencies
The first step is to catalog the project's tasks and the relationships between them. Task dependencies should be well defined, including whether they are start-to-finish, finish-to-start, or start-to-finish. An accurate depiction of job dependencies is required to identify a project's critical path.
Use Software Tools
Save time and effort using PERT chart software like EdrawMax. Simple drag-and-drop features, personalization, and simultaneous collaboration are benefits of modern software. It streamlines the production phase and yields high-quality end products.
Keep It Simple
To be effective, a PERT chart must be straightforward. Simplify and streamline by describing tasks in as few words as possible. This keeps the chart from becoming too complex for your team to comprehend.
Include Milestones
There must be milestones to track the development of a project. Add them to your PERT chart to emphasize milestones or objectives. Clearly defined milestones can help keep your team focused on the big picture.
Allocate Resources
Allocating resources is a fundamental aspect of project management. Ensure your resources are used efficiently by including them in your PERT chart. This is useful for keeping costs down and avoiding shortages.
Continuously Update and Review
As the project develops, the PERT chart should be updated accordingly. The chart should be reviewed and updated regularly for any shifts, delays, or additional work. This will keep your project on schedule.
Critical Path Analysis
Locate the tasks on your PERT chart that cannot be delayed since this is the key route. The critical route is a method for prioritizing tasks and allocating time and resources to ensure a project is completed on time.
Test Scenarios
If you want to foresee any delays or dangers in your project, you should run several scenarios through your PERT chart. Scenario planning is useful for considering potential solutions to problems or ways to handle unknowns.
Conclusion
Learning how to make PERT charts is importat for every project manager. The ability to plan, execute, and control a project effectively relies heavily on these visual representations. By adhering to the guidelines mentioned above and using software solutions like EdrawMax, creating a PERT chart can be streamlined without sacrificing precision, accuracy, or adaptability.
An efficient PERT chart will display job dependencies, allocate resources, monitor progress toward milestones, and perform a critical path analysis. The dynamic nature of projects needs frequent updates and scenario planning to minimize risks and maximize success.
Keeping your team and interested parties informed and on the same page is only possible via clear and consistent communication. If you keep these tips in mind, you can use PERT charts to their full potential, improving your chances of completing projects on time and within budget.
[没有发现file]