Scatter graphs, also known as scatter plots, are powerful tools used to visualize the relationship between two variables. They provide valuable insights into patterns, trends, and correlations within data. Understanding scatter graphs is crucial for anyone who wants to make a scatter graph and analyze data.
Here, we will explore the characteristics of scatter graphs and their importance in various industries and offer tips on customizing and interpreting these graphs.
In this article
Part 1: Characteristics of a Scatter Graph
A scatter graph has some specific characteristics. Knowing about these characteristics is important to make a scatter diagram.
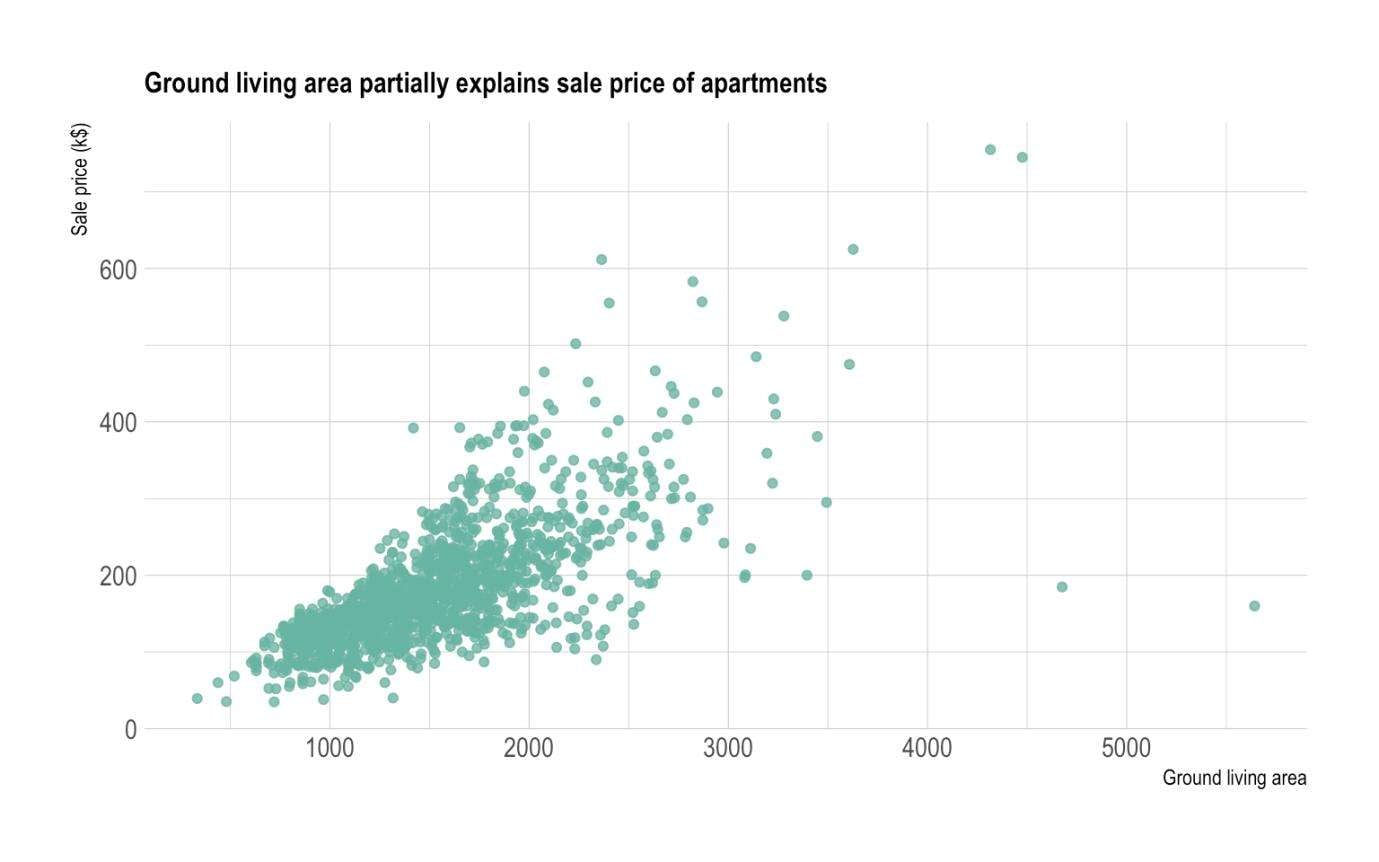
- Dependent and Independent Variables: A scatter graph, also known as a scatter plot, is a visual representation of the relationship between two variables.
- Data Points: Each data point on the scatter graph represents the values of the two variables for a single observation or data pair.
- Trendline: A trendline can be added to a scatter graph to show the general pattern or direction of the relationship between the variables.
- Data Distribution: Scatter graphs are useful for identifying the distribution of data points and any clustering or outliers that may be present.
- Correlation: The scatter graph can visually indicate the strength and direction of the relationship between the variables.
Part 2: Importance of Using Scatter Graphs in Various Industries
The reasons to use and draw scatter graphs are several, and the importance of using scatter graphs cannot be understated. Scatter graphs are utilized in various industries.
- Scientific Research: In scientific research, scatter graphs are used to visualize the relationship between experimental variables and to identify patterns or trends in the data.
- Business and Economics: In business and economics, scatter graphs are employed to analyze market trends, consumer behavior, and economic indicators.
- Healthcare and Medicine: In healthcare and medicine, scatter graphs are utilized to study the correlation between medical treatments, patient outcomes, and risk factors.
- Environmental Science: In environmental science, scatter graphs are important for studying the impact of environmental factors on ecosystems, climate patterns, and natural resources.
- Engineering and Technology: In engineering and technology, scatter graphs are essential for analyzing the performance of materials, mechanical systems, and technological innovations.
Part 3: Tips to Customize the Scatter Graph
Customizing the scatter graph can be very useful. One can effectively customize and draw a scatter plot by keeping a few things in mind.
- Axis Labels and Units: Clearly label the x-axis and y-axis with the names of the variables being represented and their respective units of measurement.
- Data Point Markers: Choose appropriate markers, such as circles, squares, triangles, or crosses, to represent the data points on the scatter graph.
- Trendline Style: Customize the style of the trendline by selecting the type, color, thickness, and pattern.
Part 4: Interpreting the Patterns Displayed in the Scatter Graph
A scatter graph has certain patterns. Interpreting these patterns is of utmost importance for those who want to create a scatter chart.
- Positive Correlation: A scatter graph with a positive correlation shows that an increase in the independent variable is associated with an increase in the dependent variable. The data points tend to cluster in an upward direction, and the trendline slopes upward from left to right.
- Negative Correlation: A scatter graph with a negative correlation indicates that an increase in the independent variable is linked to a decrease in the dependent variable. The data points tend to cluster in a downward direction, and the trendline slopes downward from left to right.
- No Correlation: In cases where there is no discernible pattern or relationship between the variables, the data points on the scatter graph appear scattered with no clear trendline. The absence of a correlation suggests that changes in the independent variable do not systematically influence the dependent variable.
Part 5: How You Can Make a Scatter Graph Using EdrawMax
Wondershare EdrawMax is the best tool to make a scatter graph for visually representing data. With its user-friendly interface and advanced features, it allows users to easily design, customize, and analyze scatter graphs. Its wide range of templates and symbols makes it easy to present complex data in a simplified and interactive manner. These are the steps to create a scatter graph using the tool:
Step 1:
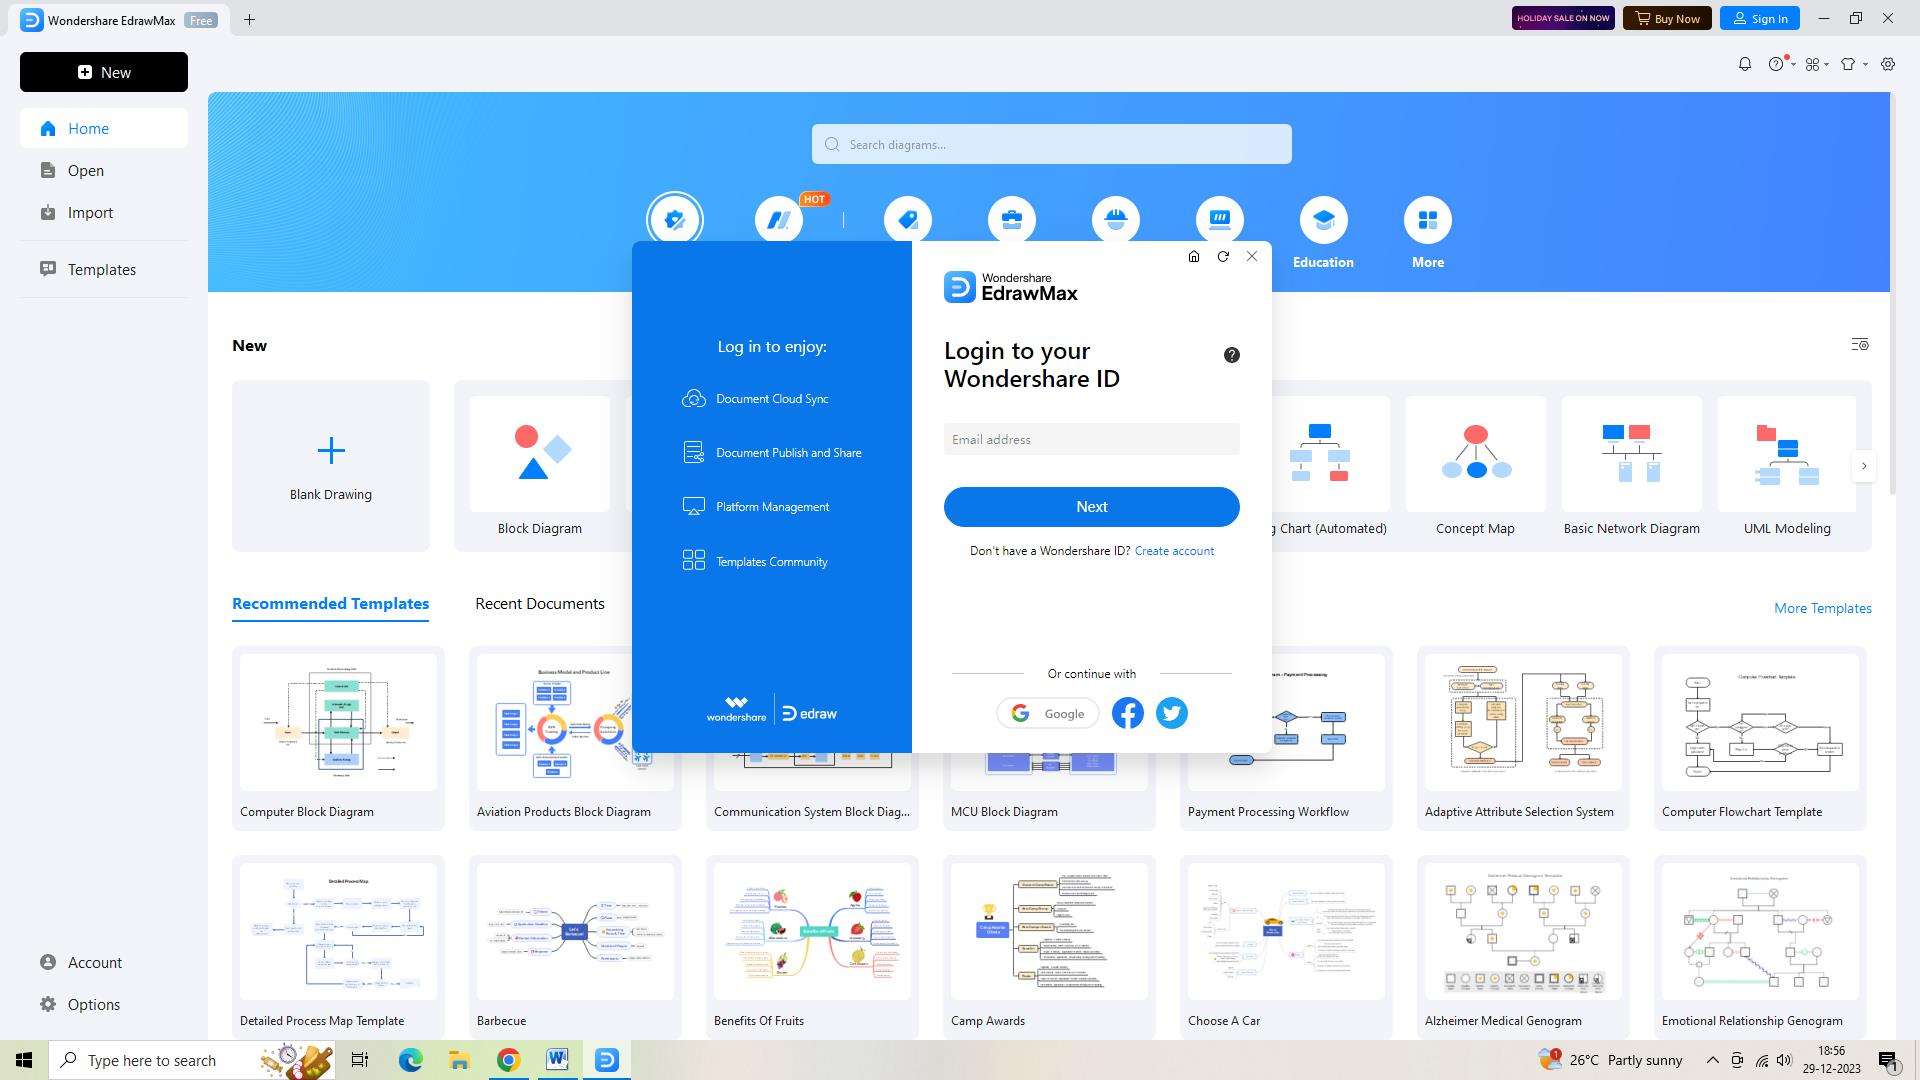
Begin by logging into your EdrawMax account using your credentials and clicking on the login button to access the platform.
Step 2:
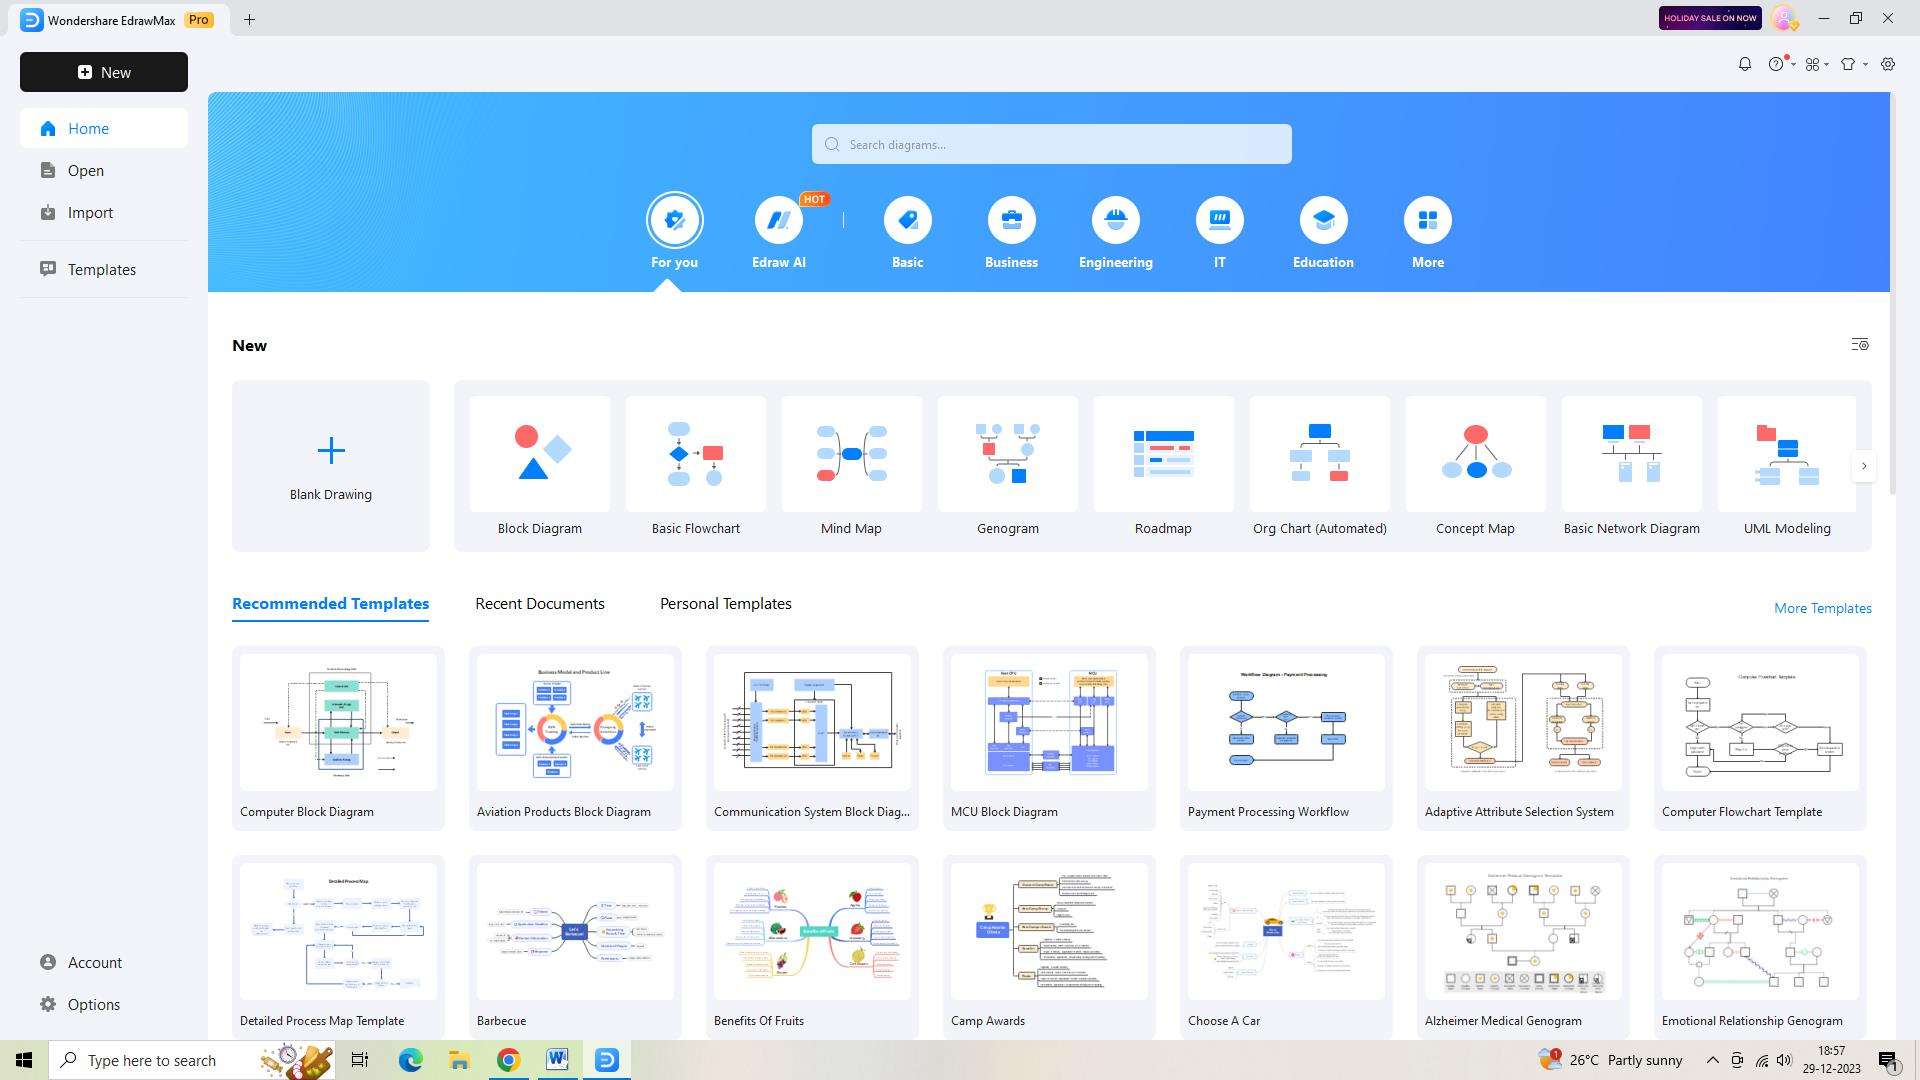
After logging in, click on the "New Document" button located on the top left corner of the interface. This will open a blank canvas for you to create your scatter graph.
Step 3:
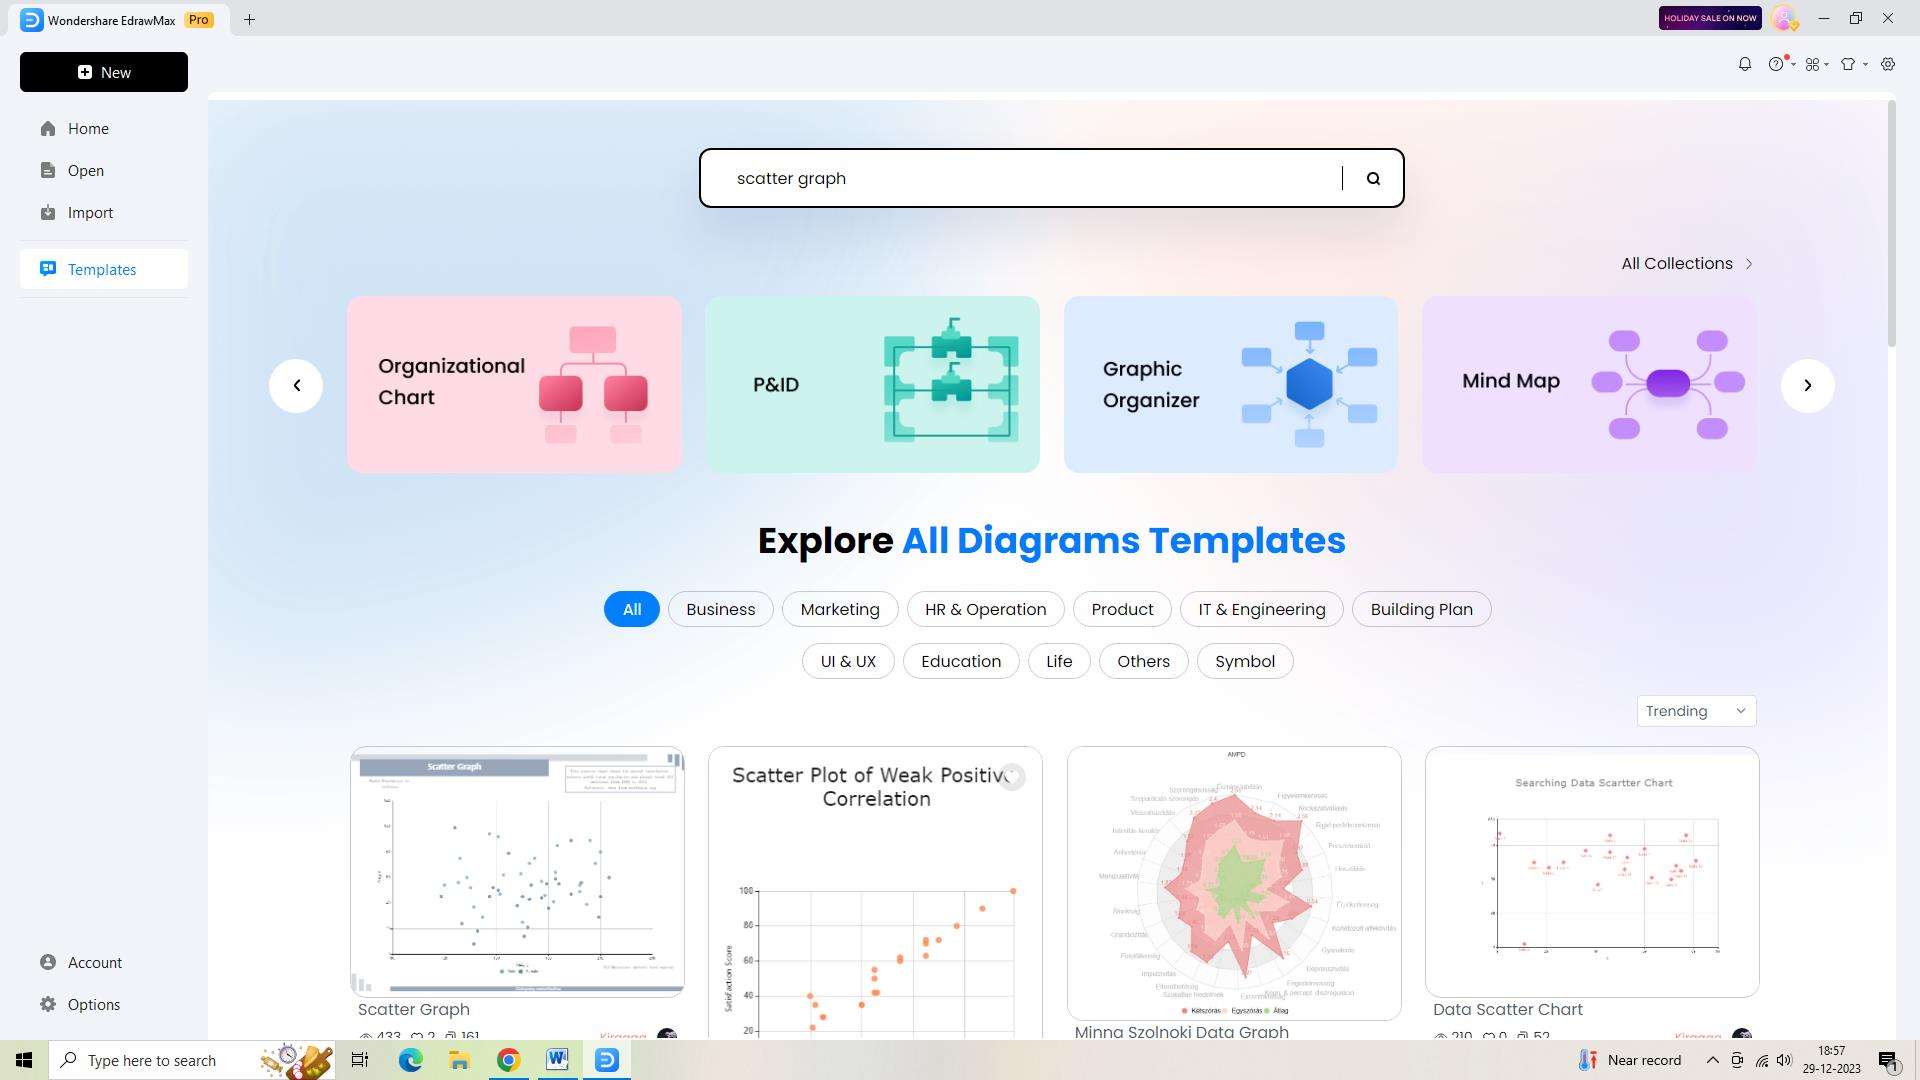
Access the template gallery by clicking on the "Templates" tab in the left sidebar. Use the search bar to find a scatter graph template by typing "scatter graph" and pressing enter. Choose the template that suits your needs and open it.
Step 4:
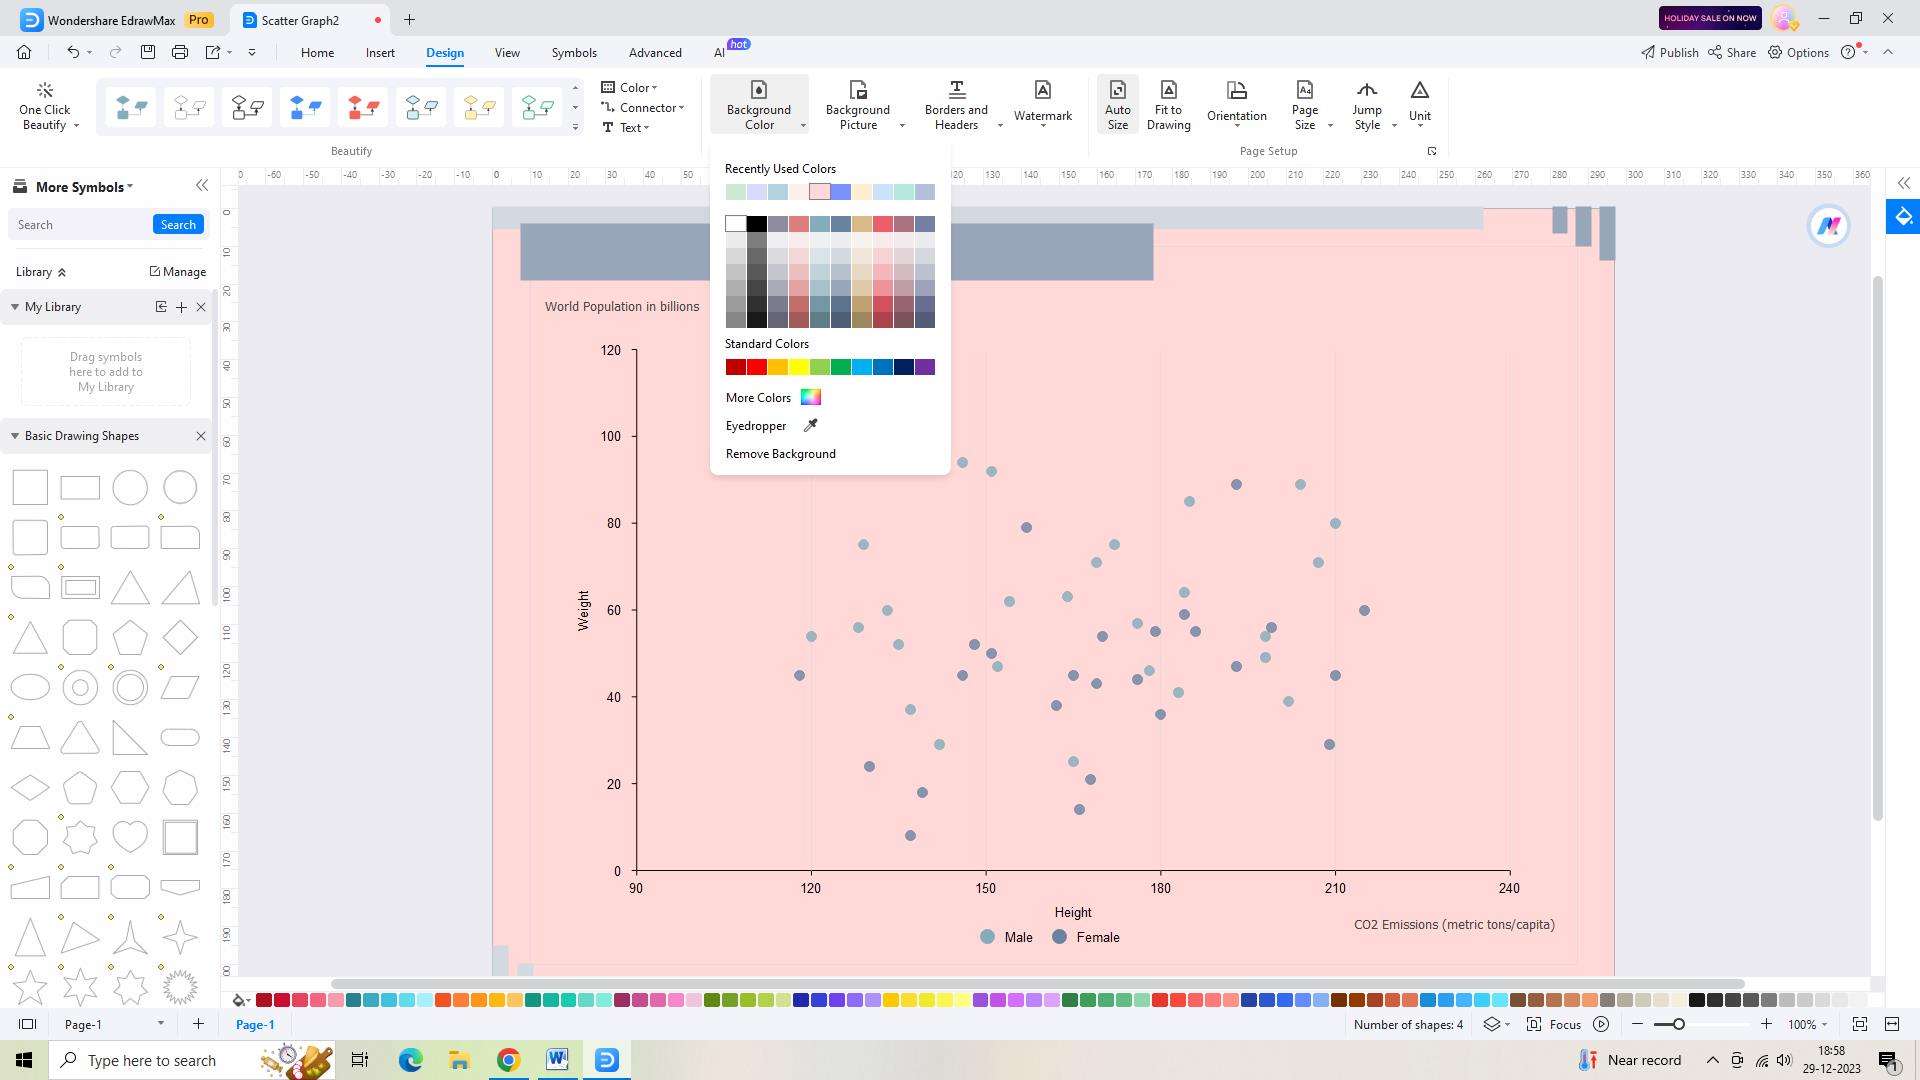
Customize the template according to your requirements by changing colors, fonts, and styles to achieve your desired aesthetic.
Step 5:
Once you are satisfied with the changes made, save your Scatter Graph by clicking on the "Save" button in the top toolbar. Provide a name for your graph and select a location on your computer or cloud storage to save it.

Step 6:
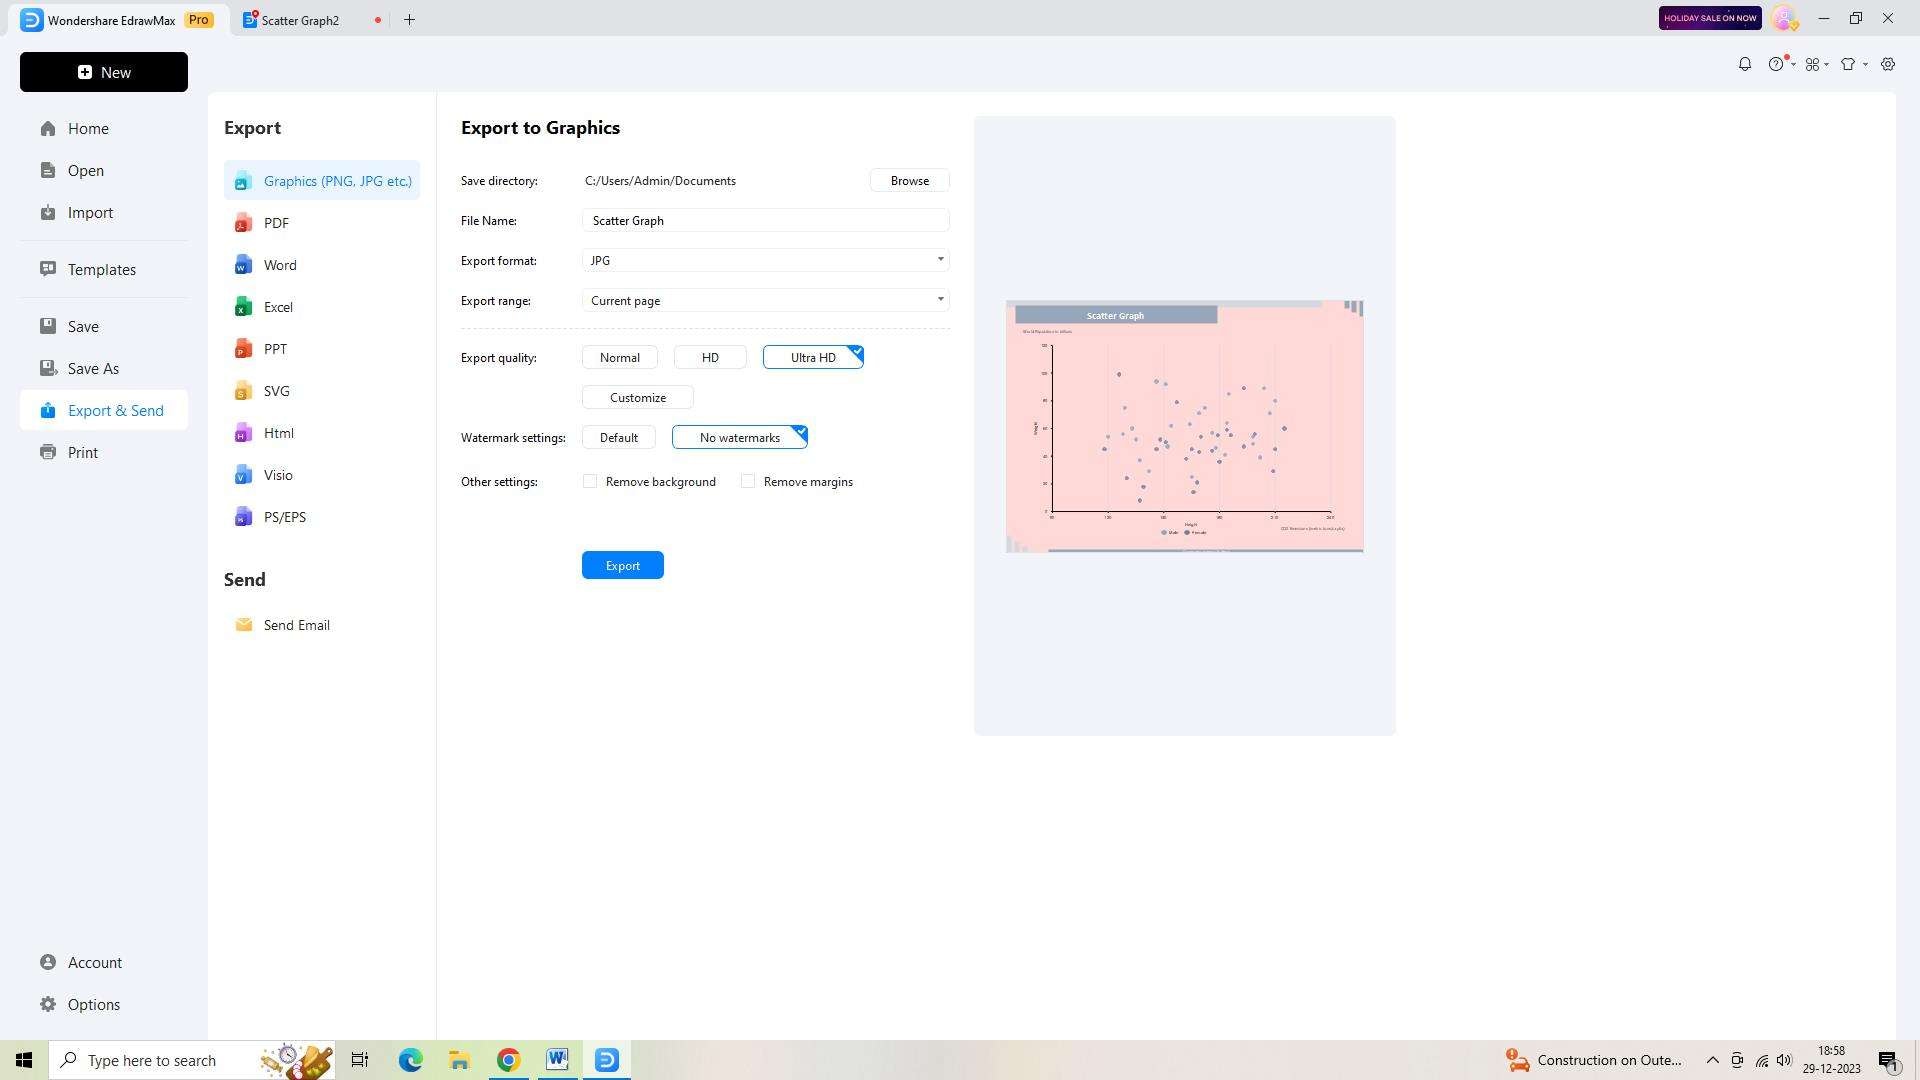
To share or use your Scatter Graph outside of EdrawMax, export it by clicking on the "Export" button in the top toolbar. Choose the desired file format, such as PDF or PNG.
Conclusion
The characteristics of a scatter graph, the importance of using scatter graphs in various industries, and interpreting the patterns displayed in the scatter graph are crucial aspects of data visualization and analysis. By understanding these components and their applications, a professional can effectively utilize and create a scatterplot to gain insights and make informed decisions.


