About this We-Intercept River Whale Model Architecture Diagram
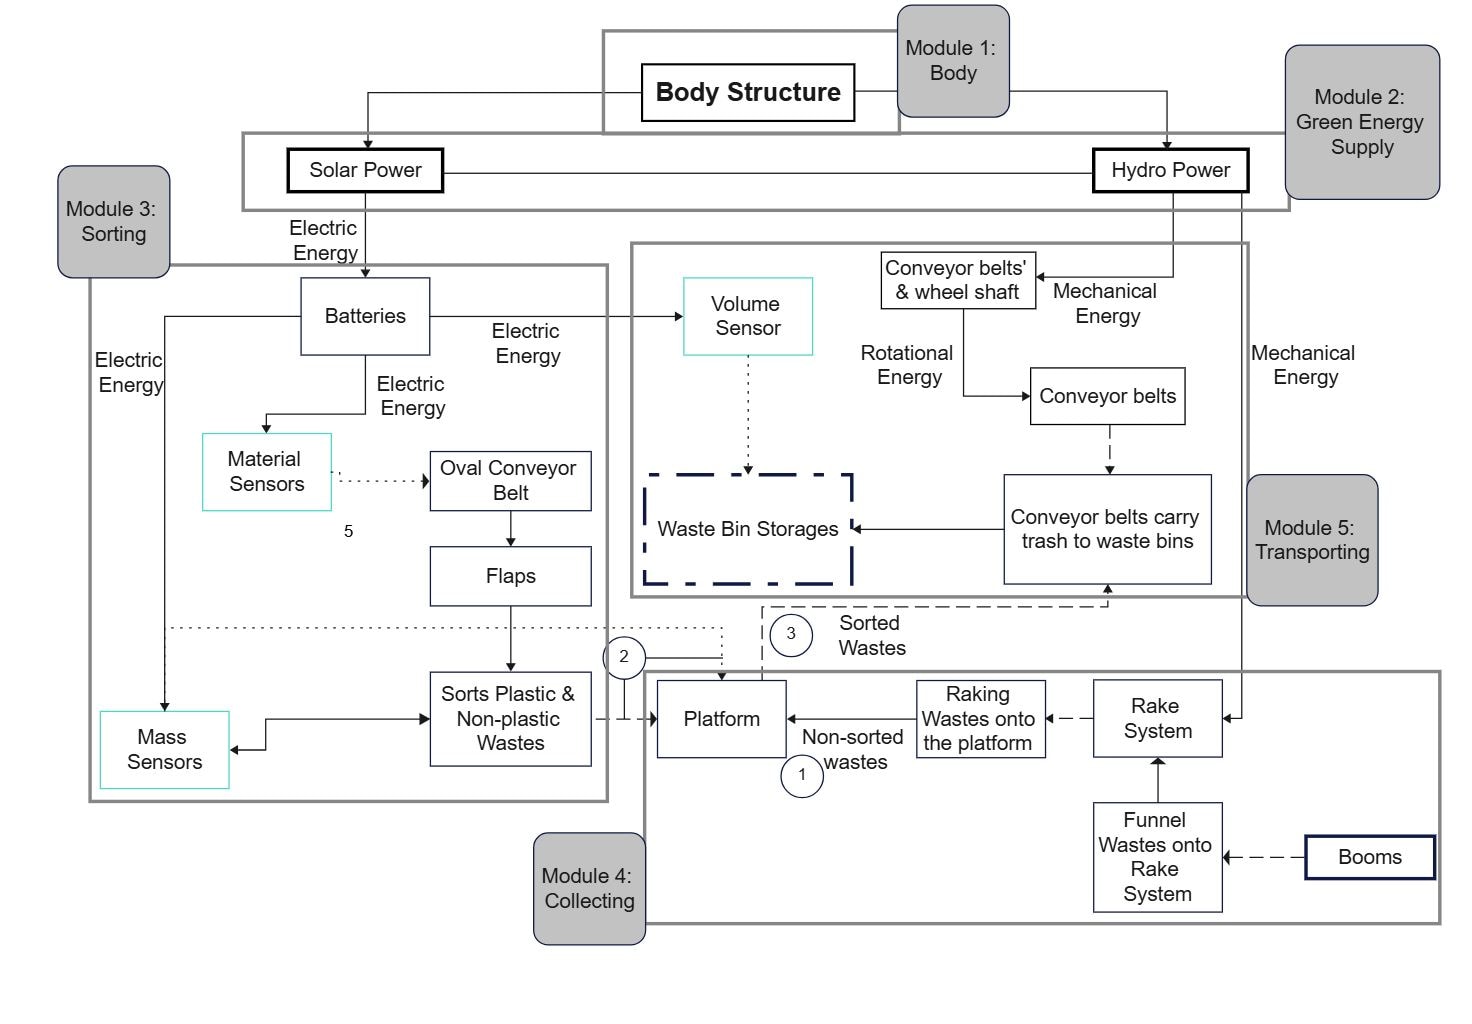
This diagram presents a river-cleanup concept built around a floating body, renewable power input, sensor-based sorting, waste collection, and transport flow. Instead of showing one abstract system block, it breaks the machine into physical structure, power supply, sorting logic, storage, and movement so each part of the cleanup process is easy to follow.
Body
The Body section shows the main mechanical frame of the device. It includes the body structure itself, conveyor belts and a wheel shaft, rotational energy, and a volume sensor. Together these parts suggest how floating waste is pulled in, moved through the system, and measured before it reaches the next stage.
- Body Structure
- Conveyor belts & wheel shaft
- Rotational Energy
- Volume Sensor
Green Energy Supply
This part focuses on how the machine is powered. Hydro power, solar power, and electric energy are grouped here, so the diagram reads as a hybrid energy design rather than a single-source device. That makes this section useful for explaining how the cleanup system could operate with lower external energy demand.
- Hydro Power
- Solar Power
- Electric Energy
Sorting
The Sorting section is centered on material sensors. In the full diagram, that works as the decision point between intake and storage. It suggests that collected river waste is not only captured but also identified or separated before moving into collection bins or later handling steps.
- Sorting
- Material Sensors
Collecting
Collecting is where the processed waste ends up. The waste bin storages make this section read like the holding area of the machine, giving the diagram a clear end point for captured material. It helps show that the design covers both interception and temporary storage, not just front-end collection.
- Collecting
- Waste Bin Storages
Transporting
The Transporting section represents the movement stage after collection. Even though it is visually lighter than the other groups, its placement helps complete the workflow by showing that captured material is meant to continue onward instead of stopping at the storage layer.
- Transporting
FAQs about this Template
-
How do teams visualize We Intercept River Whale Model IoT architecture?
Teams usually visualize We Intercept River Whale Model IoT architecture with a diagram that separates devices, connectivity, processing, and application or control layers. This makes it easier to review how sensor data moves, where decisions are made, and how cloud, edge, monitoring, or automation services connect in the wider system.
-
What should a We Intercept River Whale Model IoT architecture diagram include?
A strong We Intercept River Whale Model IoT architecture diagram should include the devices, communication path, core processing components, and the main user or control interfaces. It should also show where gateways, cloud services, storage, analytics, monitoring, or security controls connect, so the end-to-end behavior of the IoT system is easier to understand.
-
What is the difference between IoT architecture and system architecture?
IoT architecture focuses more directly on connected devices, telemetry flow, gateways, processing, and control logic, while system architecture is a broader term for overall software or infrastructure structure. IoT diagrams are more useful when teams need to explain sensor behavior, data transfer, remote control, alert flow, and the relationship between physical devices and digital services.
-
Can AI generate We Intercept River Whale Model IoT architecture diagrams automatically?
Yes, AI can generate an early IoT architecture draft, but engineers still need to validate it carefully. AI can suggest common layers and device-to-cloud flow, while the team should confirm the real hardware roles, communication methods, control points, security design, and support assumptions before using the diagram in planning or stakeholder review.
-
Which diagram type is best for documenting IoT workflows?
An architecture diagram is usually the best starting point for documenting IoT workflows because it shows devices, communication, processing, and user-facing logic together. Teams often add network, sequence, or data flow diagrams later when they need deeper detail for telemetry handling, alert logic, troubleshooting, operational deployment, or control behavior.