About this Power Grid Maintenance Plan 2025 template
This professional template provides a visual breakdown of annual power infrastructure upkeep. It tracks key performance indicators, regional progress, and identifies strategic areas for future improvement in electrical utility management.
2025 Maintenance Overview
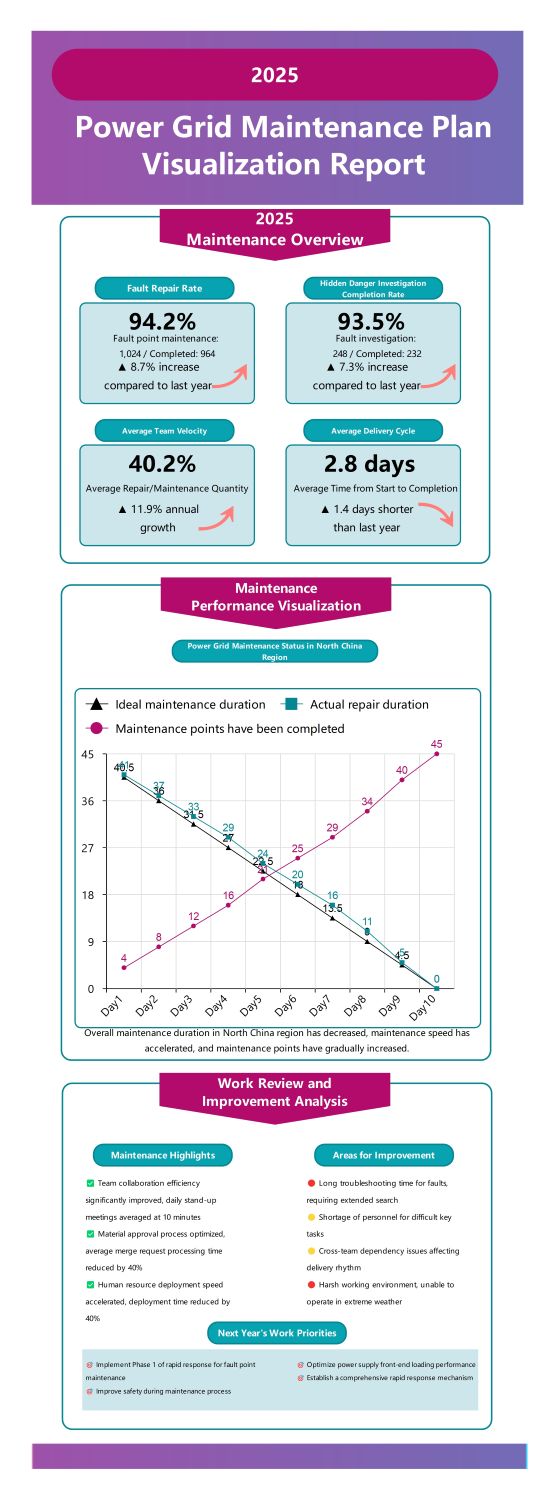
The overview section highlights major operational achievements for the year 2025. It tracks high-level metrics like repair success and inspection rates, showing steady growth compared to previous years through improved team performance.
- Fault Repair Rate: 94.2% (8.7% increase)
- Hidden Danger Investigation Rate: 93.5%
- Average Team Velocity: 40.2% Growth
- Average Delivery Cycle: 2.8 Days
Maintenance Performance Visualization
This section analyzes maintenance trends specifically within the North China Region. It compares ideal timelines against actual durations to visualize how quickly technical teams are completing critical tasks across the power grid.
- Ideal vs. Actual Maintenance Duration
- Maintenance Points Completed Trends
- Operational Speed Acceleration Analysis
- Regional Performance Benchmarking
Work Review and Improvement Analysis
The analysis evaluates internal processes to identify strengths and weaknesses. By reviewing highlights like team collaboration and human resource deployment, managers can address bottlenecks like weather-related delays and personnel shortages effectively.
- Team Collaboration Efficiency Improvements
- Material Approval Process Optimization
- Troubleshooting Time Reduction Strategies
- Cross-team Dependency Resolution
Next Year's Work Priorities
This final section outlines the strategic roadmap for the upcoming maintenance cycle. It focuses on safety, rapid response mechanisms, and technical optimizations to ensure the power grid remains resilient against future challenges.
- Implement Phase 1 Rapid Response
- Improve Maintenance Safety Processes
- Optimize Power Supply Performance
- Establish Comprehensive Response Mechanisms
FAQs about this Template
-
Why is tracking fault repair rates important for a power grid?
Tracking fault repair rates is essential for maintaining grid stability and minimizing downtime for consumers. A high repair rate, such as the 94.2% achieved in this plan, indicates that technical teams are effectively addressing outages. By monitoring these metrics, utility companies can ensure that infrastructure remains reliable while identifying specific areas where maintenance resources need more focus.
-
How does team velocity impact the delivery cycle of grid maintenance?
Team velocity directly affects how quickly maintenance tasks are finished. When velocity increases, the delivery cycle typically shortens, as seen with the reduction to 2.8 days in this report. Faster cycles mean that power grids spend less time in a vulnerable state. This efficiency allows teams to handle more maintenance points annually, ultimately improving the overall resilience of the electrical network.
-
What are the main challenges in power grid maintenance planning?
The primary challenges include managing cross-team dependencies and dealing with harsh weather conditions that halt operations. Shortages of specialized personnel for complex tasks can also create bottlenecks in the schedule. Addressing these requires proactive planning, such as optimizing material approval processes and accelerating human resource deployment. These strategies help mitigate risks that could otherwise lead to significant delays in critical infrastructure repairs.