About this AI-Based Material Property Prediction System for TIG Welding Architecture Diagram
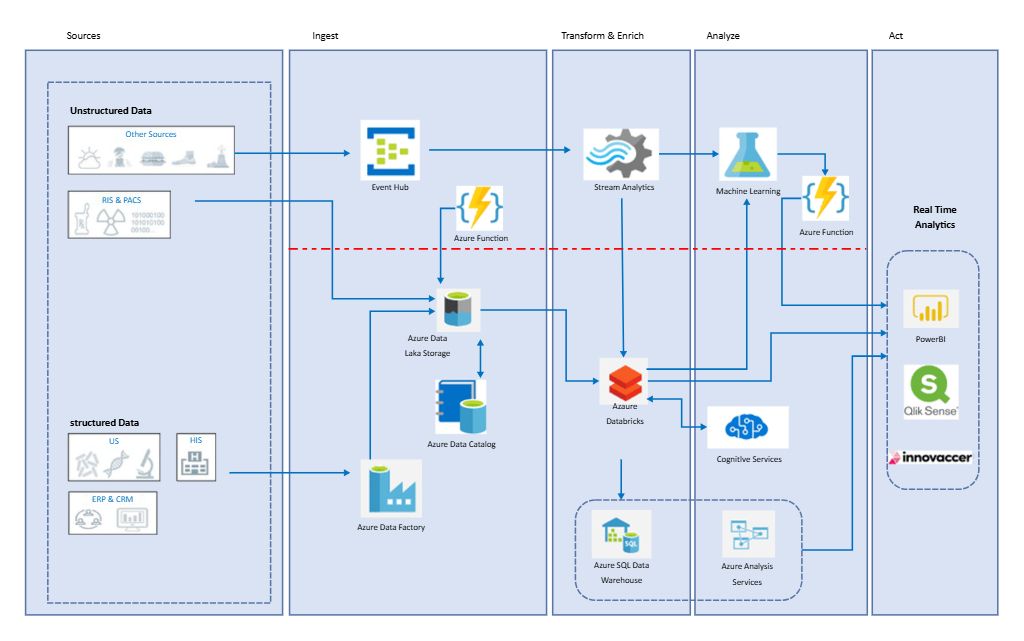
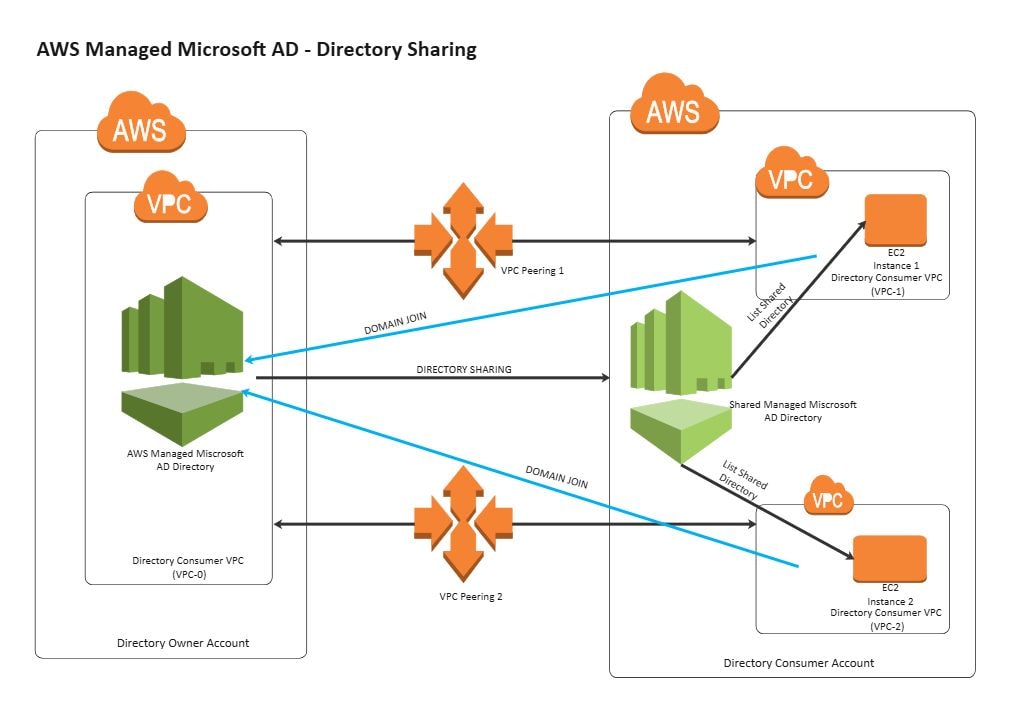
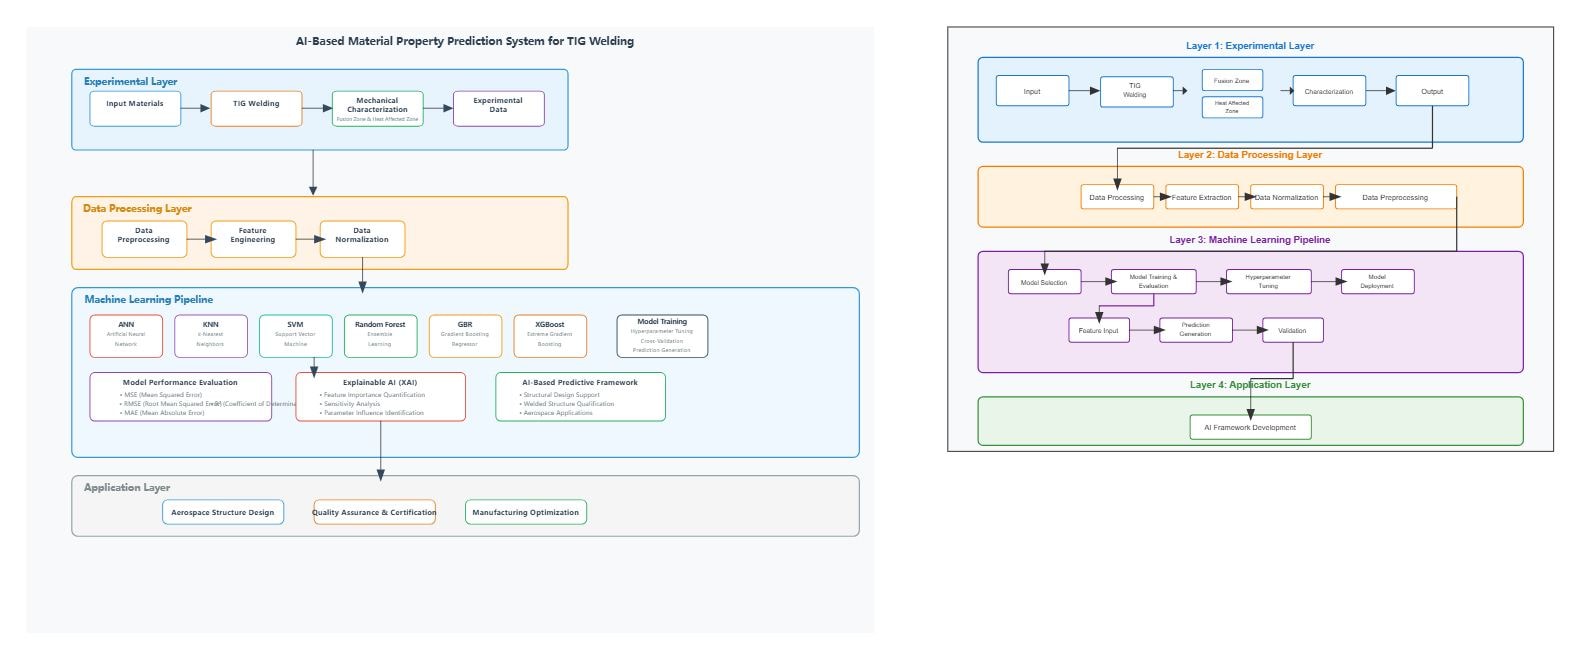
This diagram shows a research workflow that starts with welding experiments, turns the results into processed features, runs them through machine learning models, and ends with prediction-driven engineering use. The structure is useful because it separates laboratory work, data preparation, model development, and application outcomes instead of treating them as one vague AI block.
Experimental Layer
The Experimental Layer shows where the pipeline begins. Input materials, TIG welding, mechanical characterization, and experimental data are grouped with the fusion zone and heat-affected zone, so this part reads like the source of the measured welding results that feed the rest of the system.
- Input Materials
- TIG Welding
- Mechanical Characterization
- Experimental Data
- Fusion Zone & Heat Affected Zone
Data Processing Layer
This section turns raw experiment results into model-ready inputs. Data preprocessing, feature extraction, data normalization, and general data processing are listed together, showing that the diagram treats preparation as its own stage between physical testing and machine learning work.
- Data Preprocessing
- Feature Extraction
- Data Normalization
- Data Processing
Machine Learning Pipeline
The Machine Learning Pipeline is the model-building core of the diagram. It covers model selection, training, performance evaluation, hyperparameter tuning, deployment, and prediction generation, while naming methods such as ANN, KNN, SVM, GBR, and XGBoost. That makes this section read like a full model comparison and delivery workflow.
- Model Selection
- Model Training
- Model Performance Evaluation
- Hyperparameter Tuning
- Model Deployment
- Prediction Generation
- ANN
- KNN
- SVM
- GBR
- XGBoost
Application Layer
The Application Layer shows where the predictions become useful in practice. Explainable AI, structural design support, welded structure qualification, aerospace applications, and AI framework development are grouped here, so the diagram ends with real engineering outcomes instead of stopping at model accuracy alone.
- Explainable AI (XAI)
- Structural Design Support
- Welded Structure Qualification
- Aerospace Applications
- AI Framework Development
FAQs about this Template
-
How do teams visualize The AI Based Material Property Prediction System For TIG Welding AI architecture?
Teams usually visualize The AI Based Material Property Prediction System For TIG Welding AI architecture with a diagram that separates input flow, model processing, orchestration, and supporting data or control layers. This makes it easier to review how requests move through sections such as Experimental Layer, Data Processing Layer, and Machine Learning Pipeline, and where inference, retrieval, feedback, external integrations, or support logic fit in the workflow.
-
Can AI generate The AI Based Material Property Prediction System For TIG Welding architecture diagrams automatically?
Yes, AI can generate a first draft of a The AI Based Material Property Prediction System For TIG Welding architecture diagram, but it still needs human review. AI is useful for proposing flow structure and major groupings, while engineers should validate the real model pipeline, data dependencies, security boundaries, tool integrations, and support assumptions before using the diagram in delivery or technical review.
-
What is the difference between AI architecture and application architecture?
AI architecture focuses more directly on model flow, inference logic, retrieval, orchestration, and feedback loops, while application architecture describes broader software structure. AI diagrams are more useful when teams need to explain how prompts, data, models, outputs, support services, and control layers connect inside an intelligent system or agent workflow.
-
What should a The AI Based Material Property Prediction System For TIG Welding AI architecture diagram include?
A strong The AI Based Material Property Prediction System For TIG Welding AI architecture diagram should include the main inputs, model or agent layer, data or retrieval sources, and the core output path. It should also show where orchestration, monitoring, external tools, feedback loops, or support controls connect, so readers can understand the real processing flow instead of seeing only isolated technical blocks.
-
Which diagram type is best for documenting AI workflows?
An architecture diagram is usually the best place to start because it shows the main workflow, dependencies, and support layers in one view. Teams often add sequence, agent flow, or data pipeline diagrams later when they need to explain prompt handling, retrieval order, model interaction, operations detail, or escalation paths more precisely.