


A Gantt chart is an indispensable project management tool that allows you to visualize the schedule of a project. It shows the start and finish dates of project tasks, helping you monitor the progress of a project. Microsoft Visio is a popular software to create Gantt charts. However, Visio can be complex for beginners.
This article provides a step-by-step guide on how to easily create Gantt charts in Visio. We'll also explore a simpler Visio alternative - EdrawMax.
In this article
Part 1. What is a Visio Gantt Chart
A Gantt chart created in Microsoft Visio is a type of bar chart that illustrates a project schedule. The chart displays tasks vertically while the time intervals are shown horizontally. The bar lengths represent the duration of each activity.
Gantt charts in Visio provide a graphical view of the project timeline. They help plan, coordinate, and track specific tasks in a project. Visio Gantt charts are used for project scheduling and monitoring in software development, construction projects, product development, and more.
With Visio, you can create Gantt charts quickly once you understand how to use the built-in Gantt chart templates and shapes.
Part 2. Key Components of Gantt Chart in Visio
A basic Gantt chart in Visio contains the following key elements:
- Date Scale: The horizontal axis represents the total time span of the project broken down into uniform time intervals such as days, weeks, months.
- Tasks: The vertical axis lists all the tasks or activities that must be completed.
- Task Bars: The bars represent the time span of each task within the total timeline.
- Milestones: These are represented by diamond shapes and indicate important checkpoints in the project.
- Connecting Lines: These indicate task dependencies and the sequence in which tasks need to be performed.
- Progress: Progress is marked by changing the color of completed portions of the taskbars.
Part 3. How to Create Gantt Charts in Visio
Here are the essential steps to create a Gantt chart in Visio:
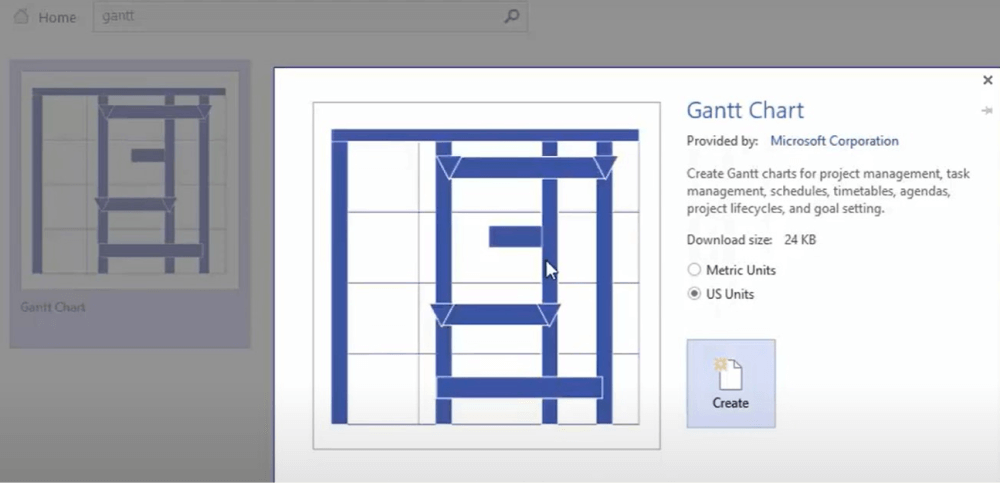
Step 1: Launch Visio on your PC. Open a new file in Visio and search for the “Gantt chart” template.
The template will have a sample Gantt chart.
Step 2: Add the timescale at the top horizontal axis of the chart. To do this, select the timescale shape from the Gantt Shapes stencil.
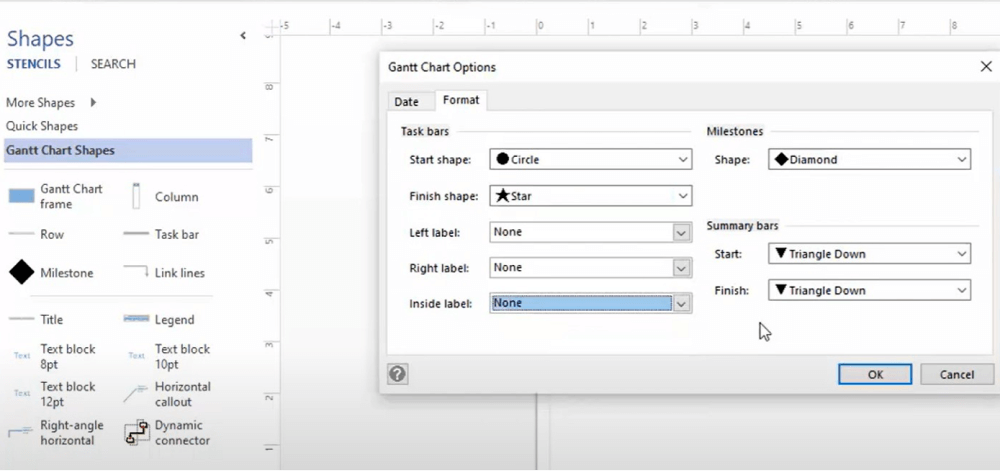
Step 3: Input the start and end dates for the project timeline and set the interval width as per your requirements.

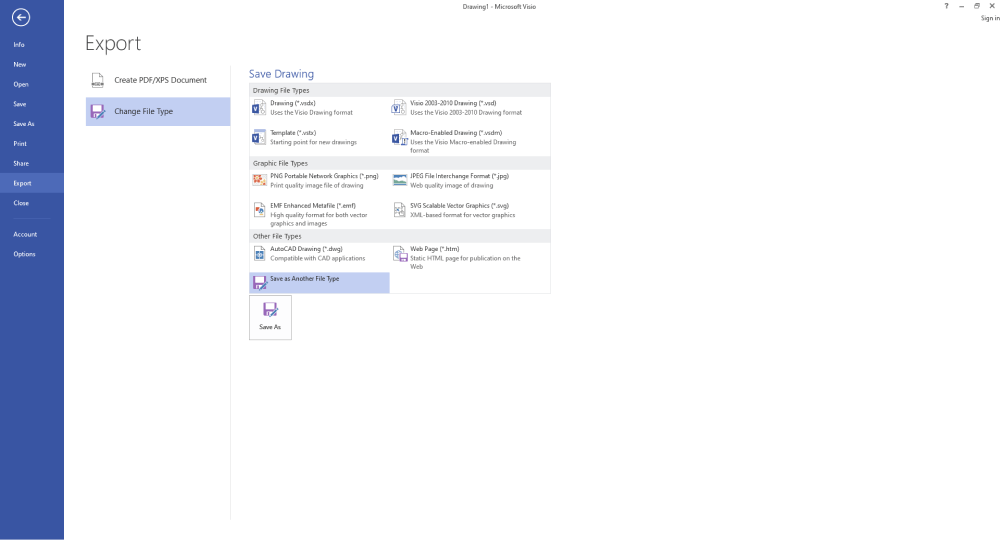
Step 4: Once you've added tasks and their durations, put the project title at the top. Save your Visio Gantt chart and share it with your team.
Part 4. Which is the Best Visio Alternative: EdrawMax
Although Visio is a popular tool for creating Gantt charts, it comes with a steep learning curve. From downloading and installing Visio to understanding the advanced features, it can get overwhelming for non-tech-savvy users. This is where EdrawMax comes in as a simpler yet powerful Visio alternative for Gantt charts.
EdrawMax is a cross-platform drag-and-drop diagramming and charting tool suitable for business users of all skill levels. With 5000+ ready-made templates, EdrawMax makes it easy for beginners to create professional-quality Gantt charts and other diagrams in minutes.
Here are some key benefits of using EdrawMax over Visio for Gantt charts:
- Easy to use interface - No learning curve even for new users.
- No need to install - Works on any device with a browser.
- 10000+ vector icons - Makes charts visually engaging.
- Built-in Gantt chart templates - Create charts in 5 steps.
- Share and export in multiple formats - PNG, JPG, PDF, etc..
- Affordable pricing - Fraction of Visio license cost.
- Works on Windows, Mac, Linux & Mobile.
Part 5. Creating a Gantt Chart Easily Using EdrawMax
Follow these simple steps to create a Gantt chart using EdrawMax:
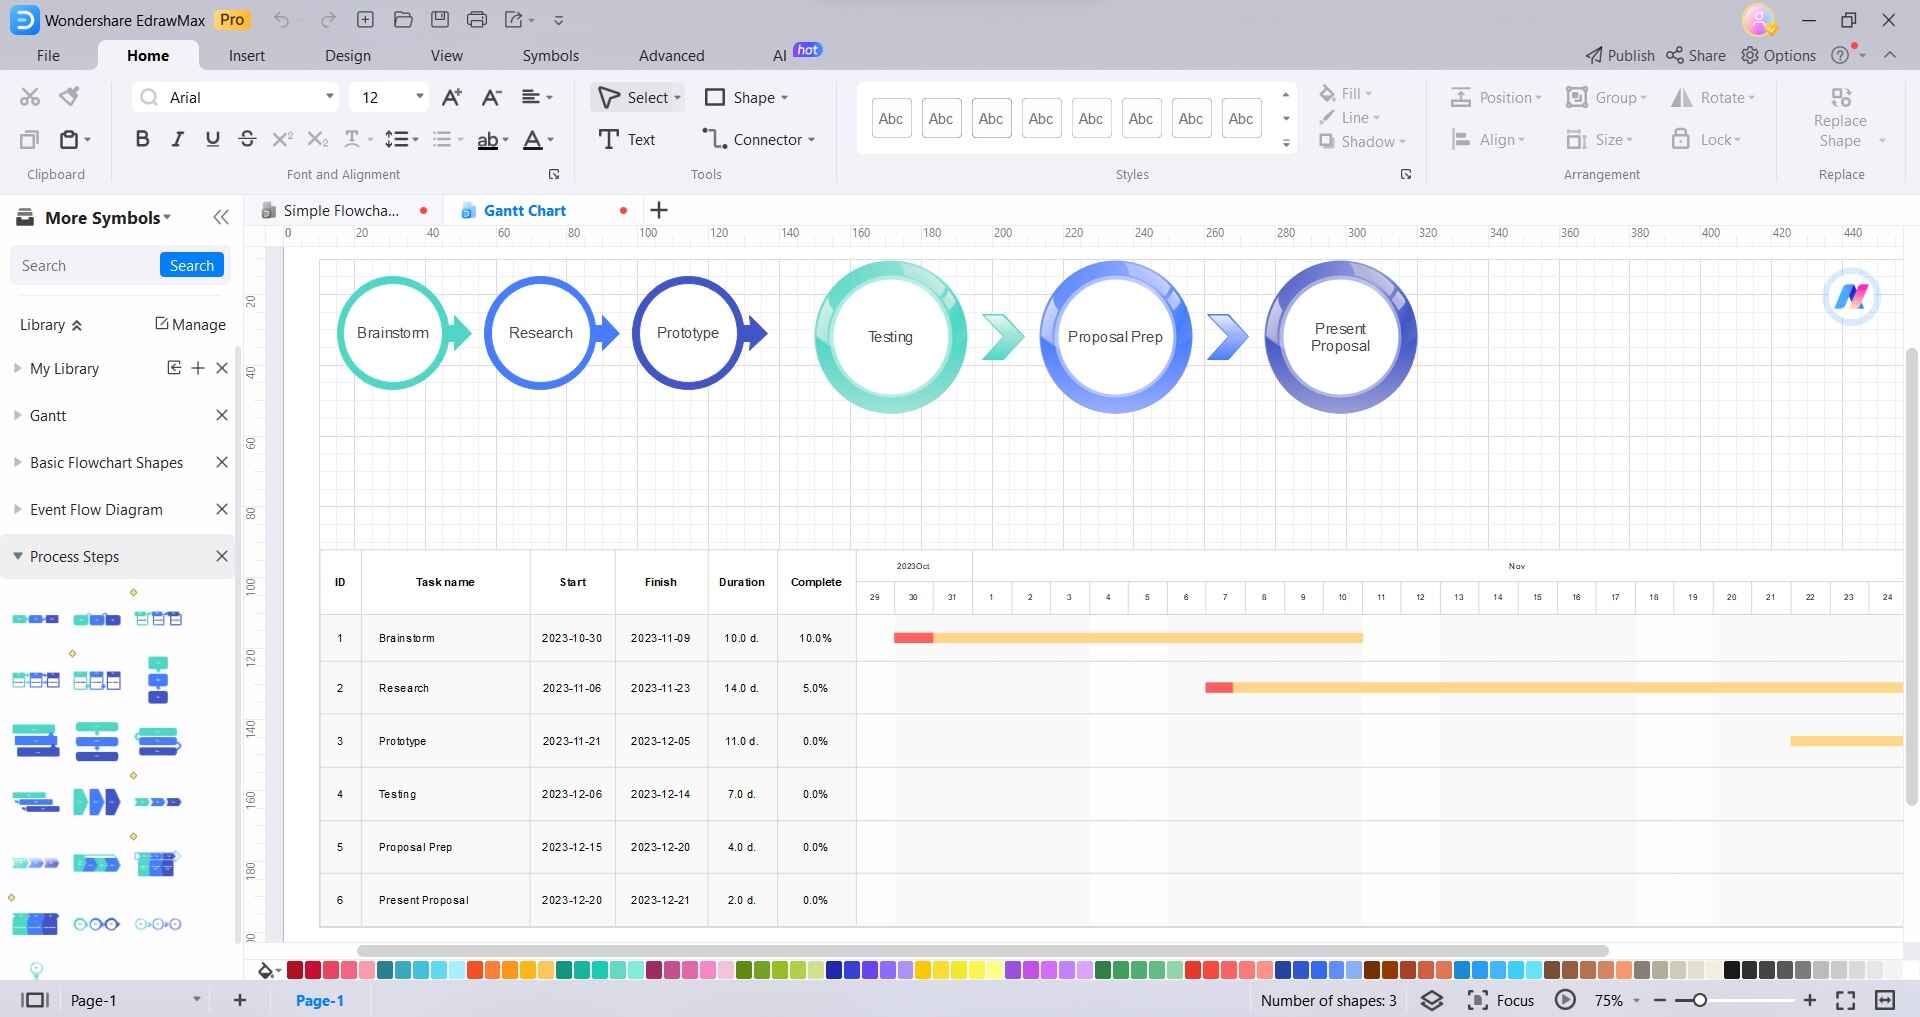
Step 1: Download and install Wondershare EdrawMax on your PC. Launch EdrawMax after installing it. Open a new document and search “Gantt” in the template library. Select a suitable template to get started.
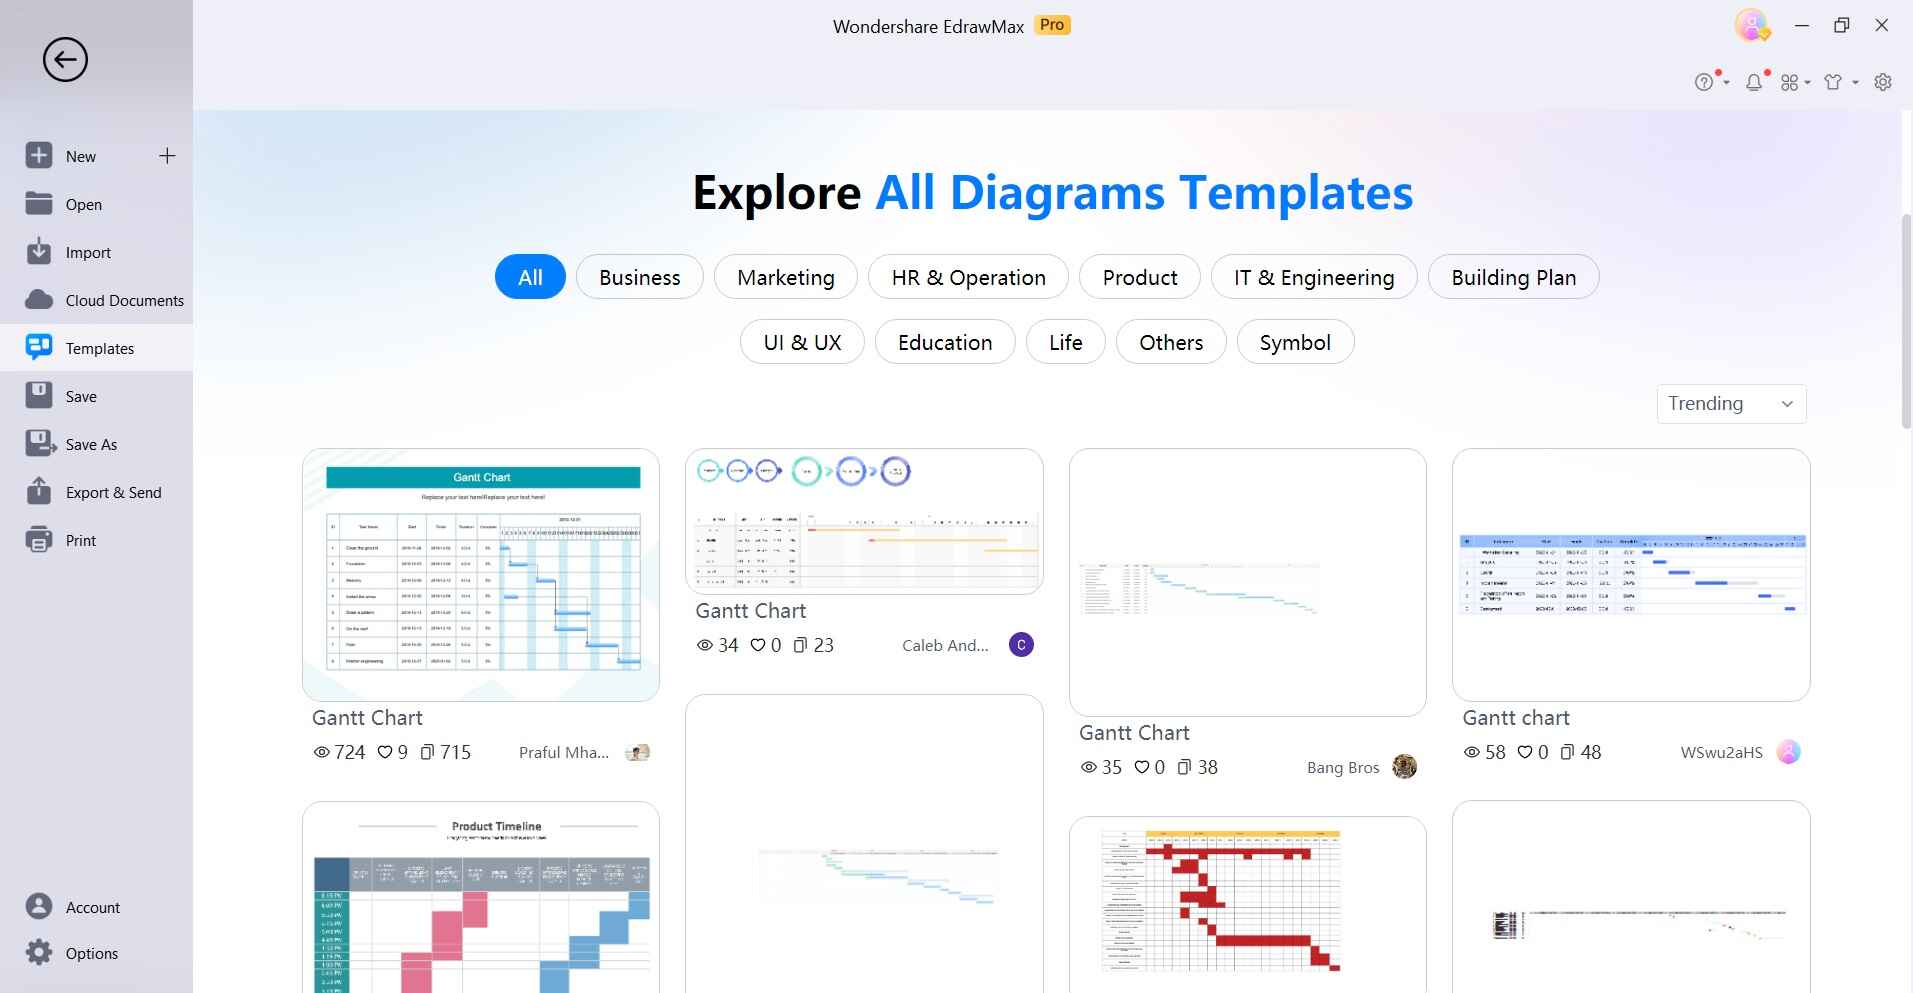
Step 2: The template will contain a sample Gantt chart. Customize it by adding your project details.
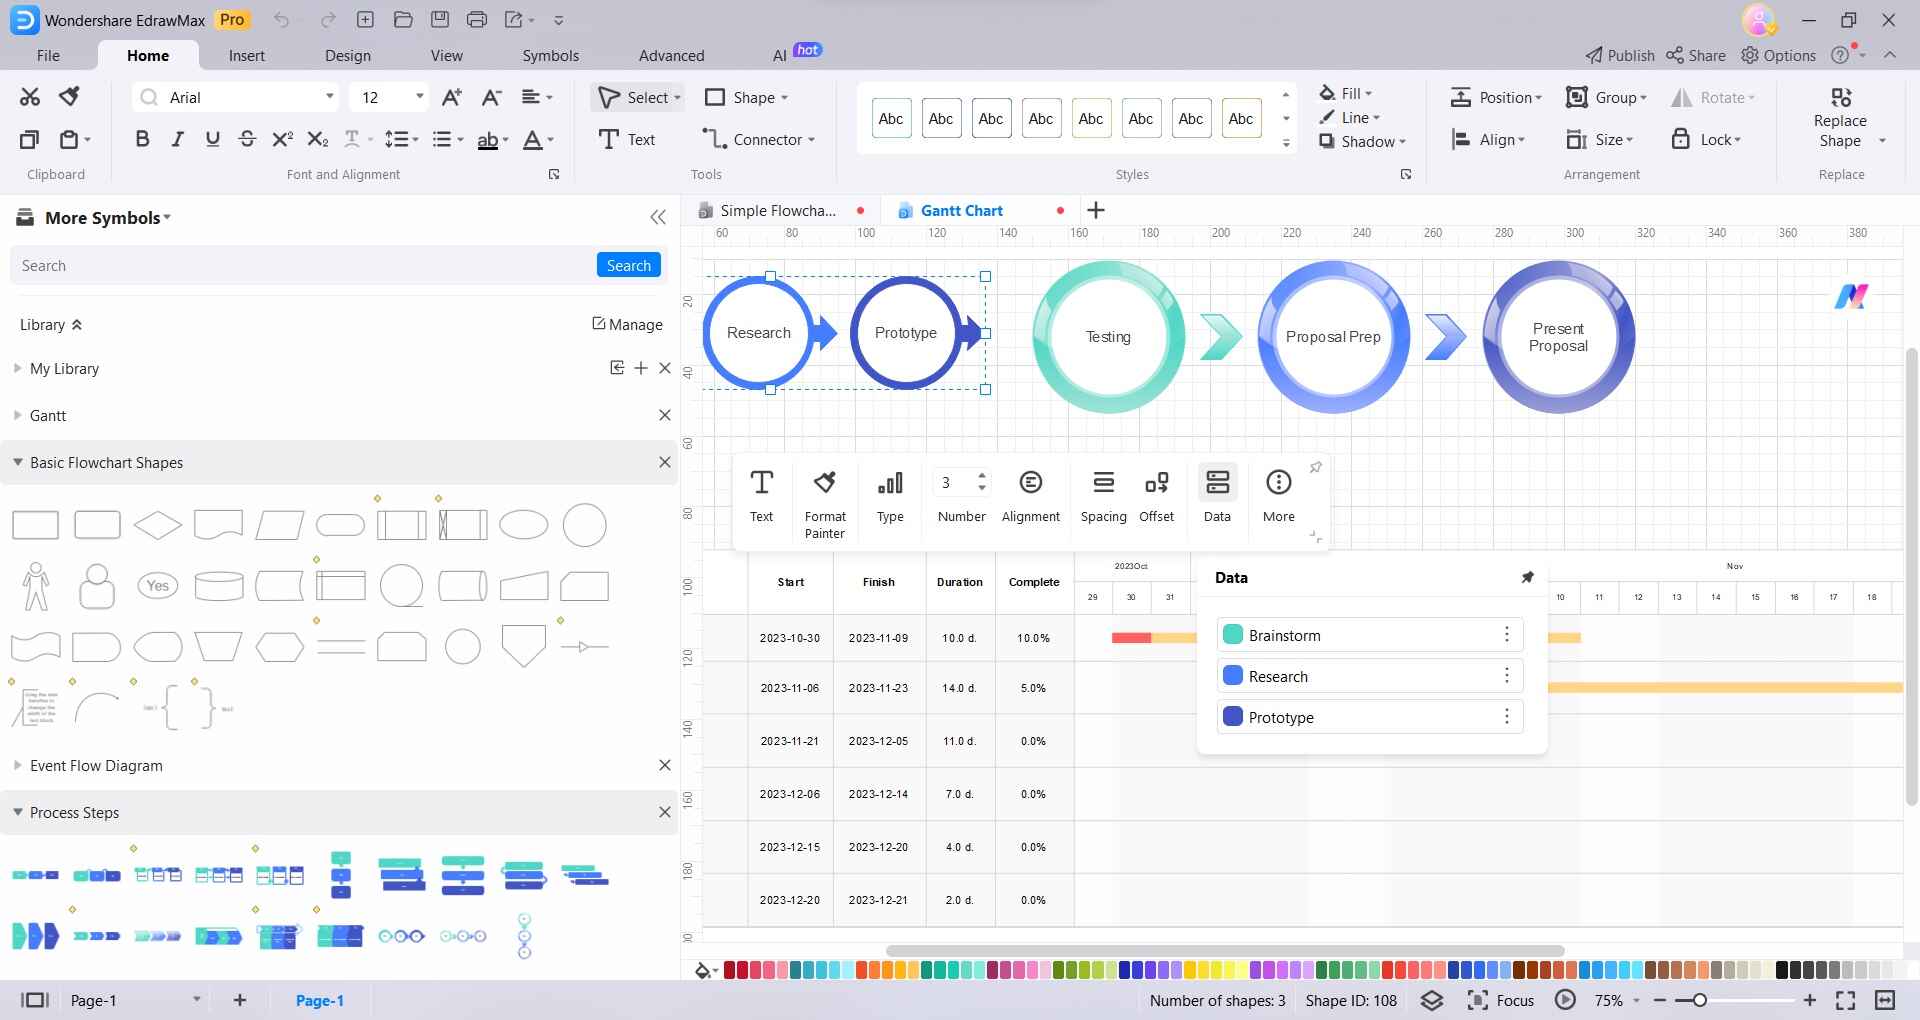
Step 3: Enter the project timeline dates on the horizontal timescale. Adjust timescale units if needed.
Click the Task shape from the sidebar to add task bars. Enter task names and duration. Add other elements like legends, headers, and titles.
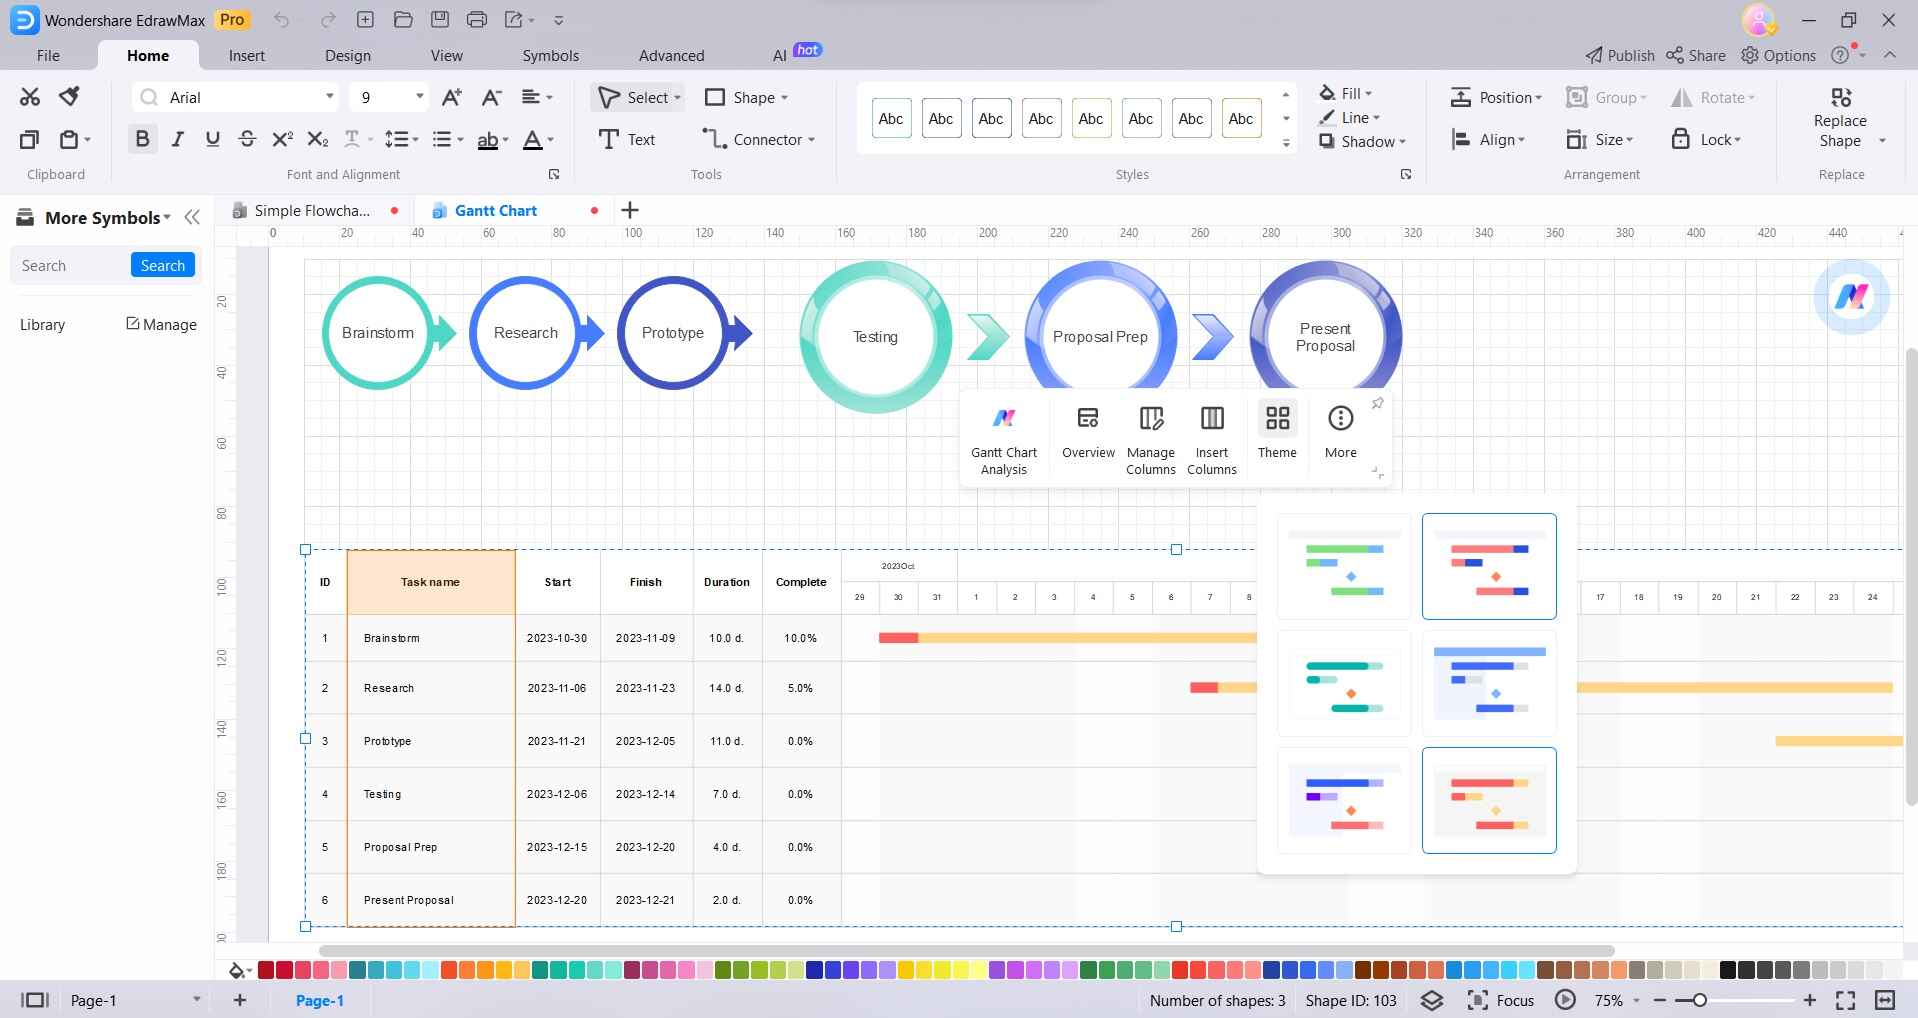
Step 4: Customize fonts, colors, and shapes as per your preference.
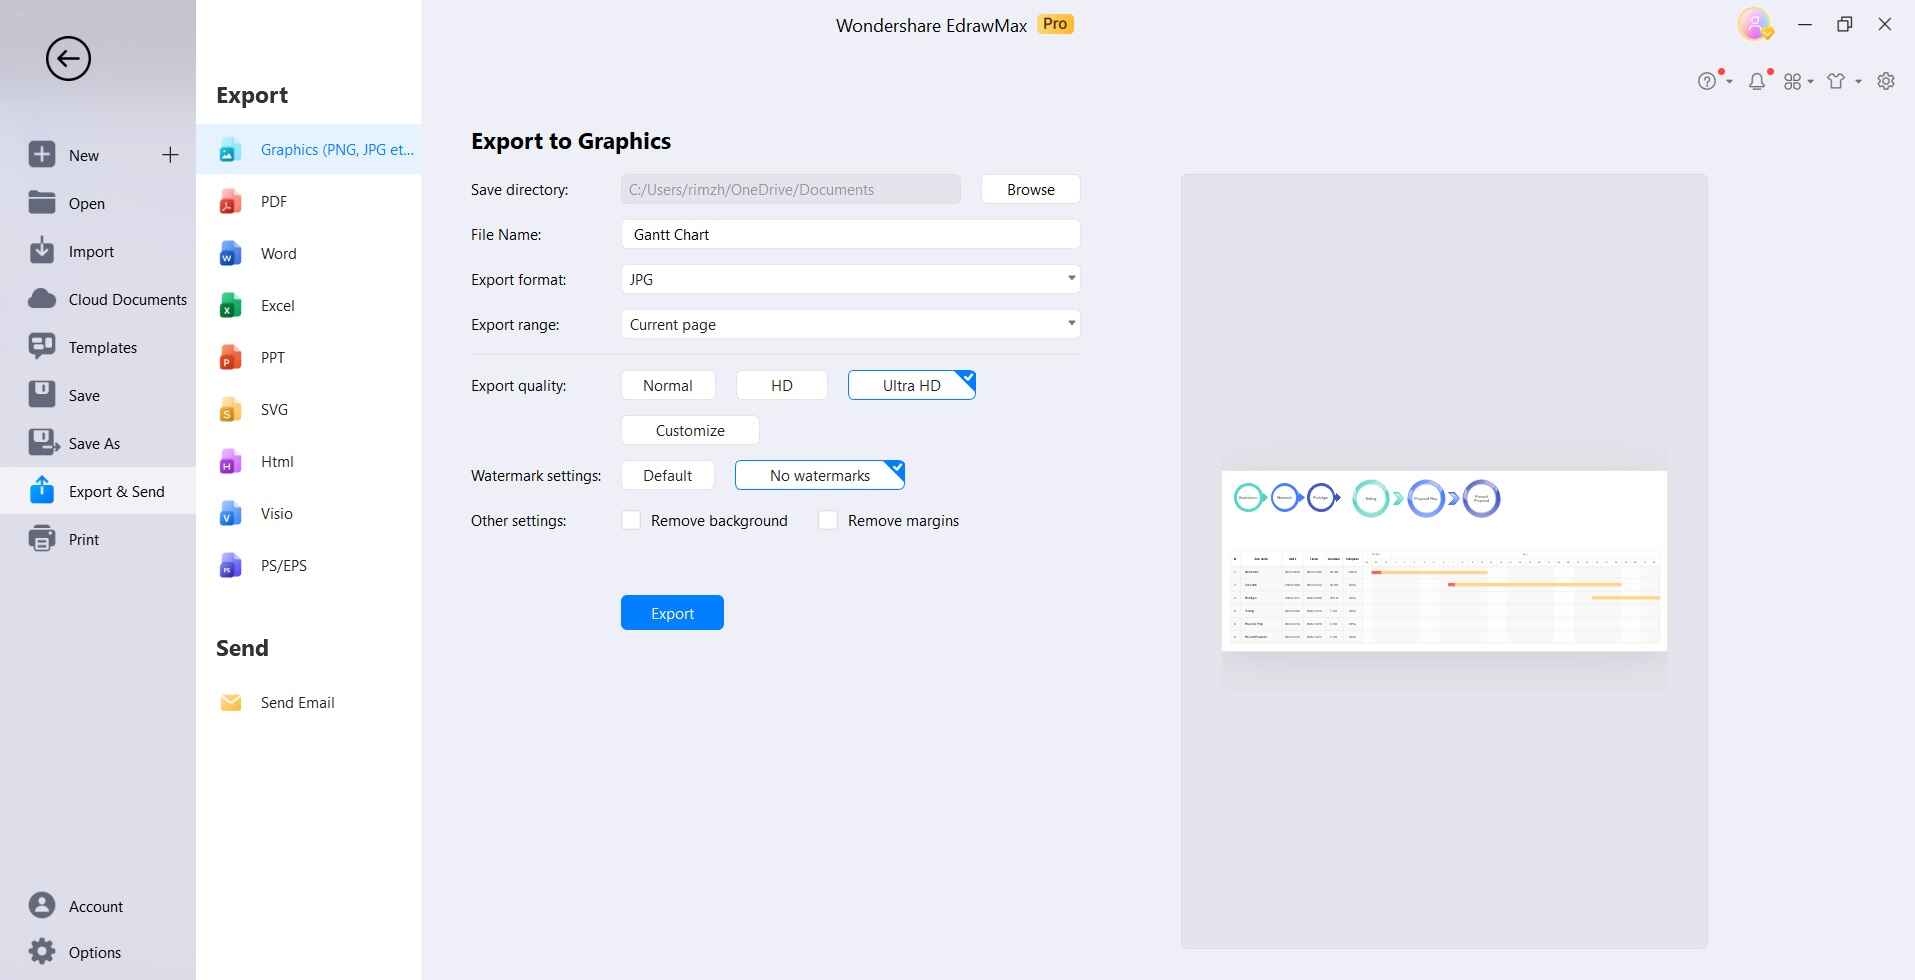
Step 5: Export the finished Gantt chart in JPEG, PNG, and PDF formats.
EdrawMax comes loaded with features to create stunning Gantt charts with minimum effort. Here are some additional reasons why it is the best Visio alternative for Gantt charts:
- Requires no learning curve or training costs.
- Easy drag-drop interface ideal for beginners.
- Hundreds of professionally designed Gantt chart templates.
- Customizable templates to match company branding.
- Visualize data vividly with icons, fonts, and color themes.
- Import data from Excel, and export charts in multiple formats.
Conclusion
Gantt charts offer an easy visual overview of project timelines and task schedules. While Visio provides advanced functionality for Gantt charts, its complexity makes it hard to use for many users. EdrawMax delivers extensively on ease of use and simplicity while retaining all key features needed for professional Gantt charts.
With a zero learning curve, top-notch templates, and outstanding technical support, EdrawMax is undoubtedly the best Visio alternative for creating Gantt charts effortlessly.
AI Diagram Generator
Enter your prompt. Upload files if needed. Generate diagrams, charts, or slides instantly.


