


In the realm of data visualization, Excel Combo Charts stand as a powerful tool, allowing you to merge various chart types into one cohesive representation. This guide is tailored to demystify the process, ensuring that even beginners can effortlessly navigate and create compelling visuals. By following our step-by-step instructions, you'll gain a comprehensive understanding of how to harness the full potential of Combo Charts, unlocking a new level of insight and clarity in your data presentations.
Contents of this article
What is an Excel Combo Chart?
An Excel Combo Chart is a dynamic data visualization tool that allows users to combine two or more different types of charts within a single chart area. This means you can represent different data sets using distinct chart formats, such as bars and lines, in a single graph. This combination enables a more comprehensive and insightful analysis, as it allows for the simultaneous display of different data trends and patterns. Excel Combo Charts are particularly useful when you want to compare and contrast multiple sets of data with varying scales or units of measurement.
Differences Between Graph and Chart:
A graph typically represents mathematical relationships or trends through plotted points on a coordinate system. It's primarily used in mathematics and sciences. On the other hand, a chart is a visual representation of data, often in the form of bars, lines, or pie slices. Charts are commonly utilized in business presentations and reports to convey information in a more accessible format.
How to Make a Combo Chart in Excel
Creating a Combo Chart in Excel involves the following steps:
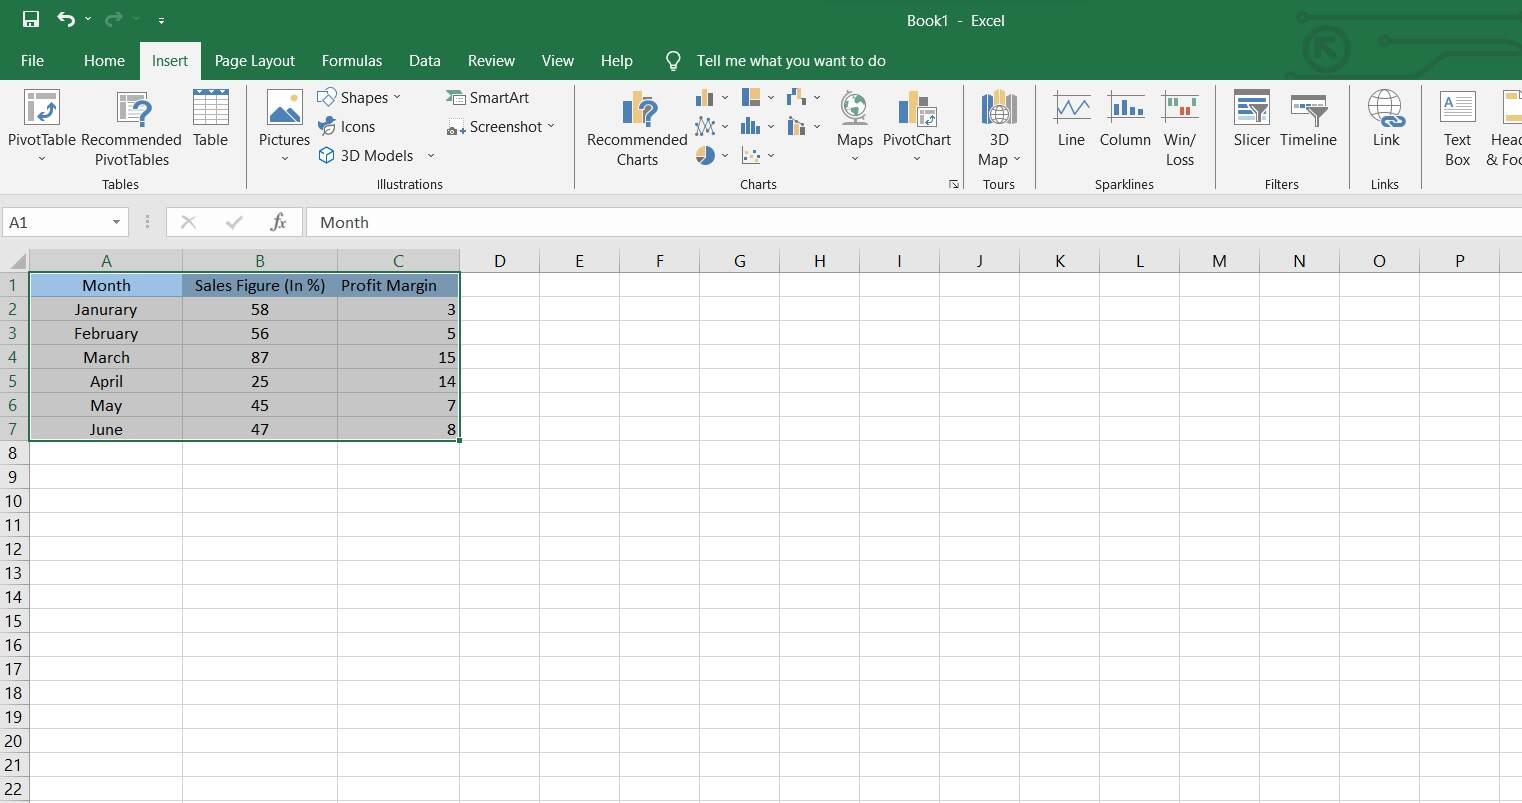
Step 1: Launch Excel and input your data into a spreadsheet. Select the cells containing the data you want to chart.
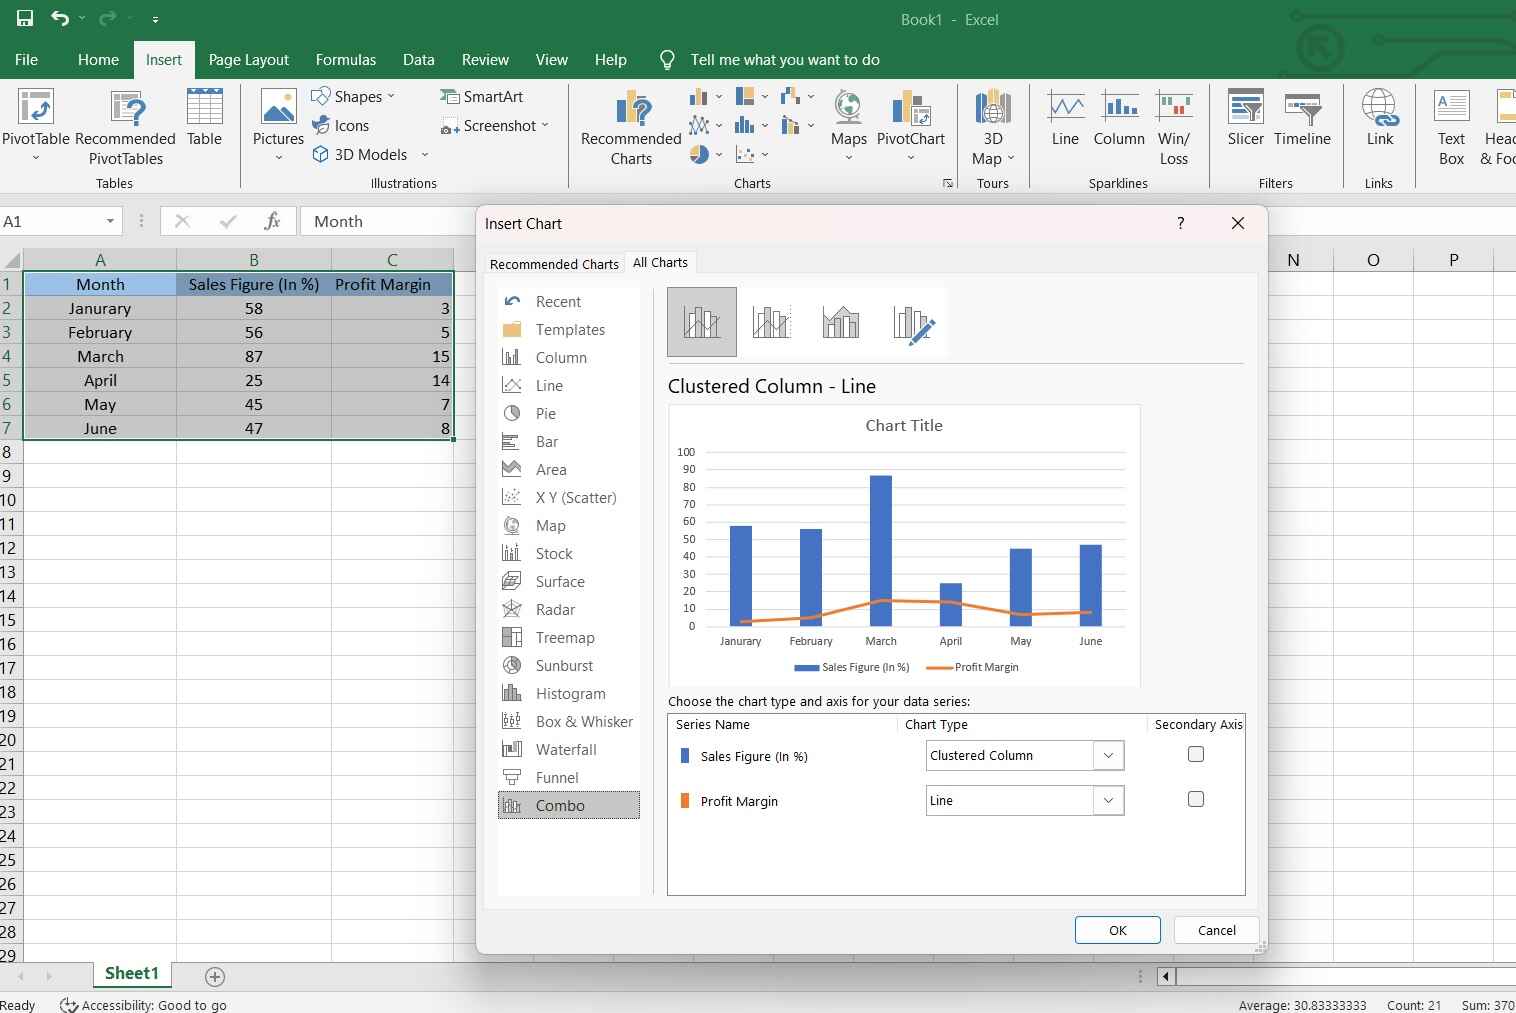
Step 2: Go to the "Insert" tab on the Excel ribbon. Click on "Combo Chart." In the Chart Builder, select the chart types for your data series. For instance, you can choose to have one series as a bar chart and another as a line chart.
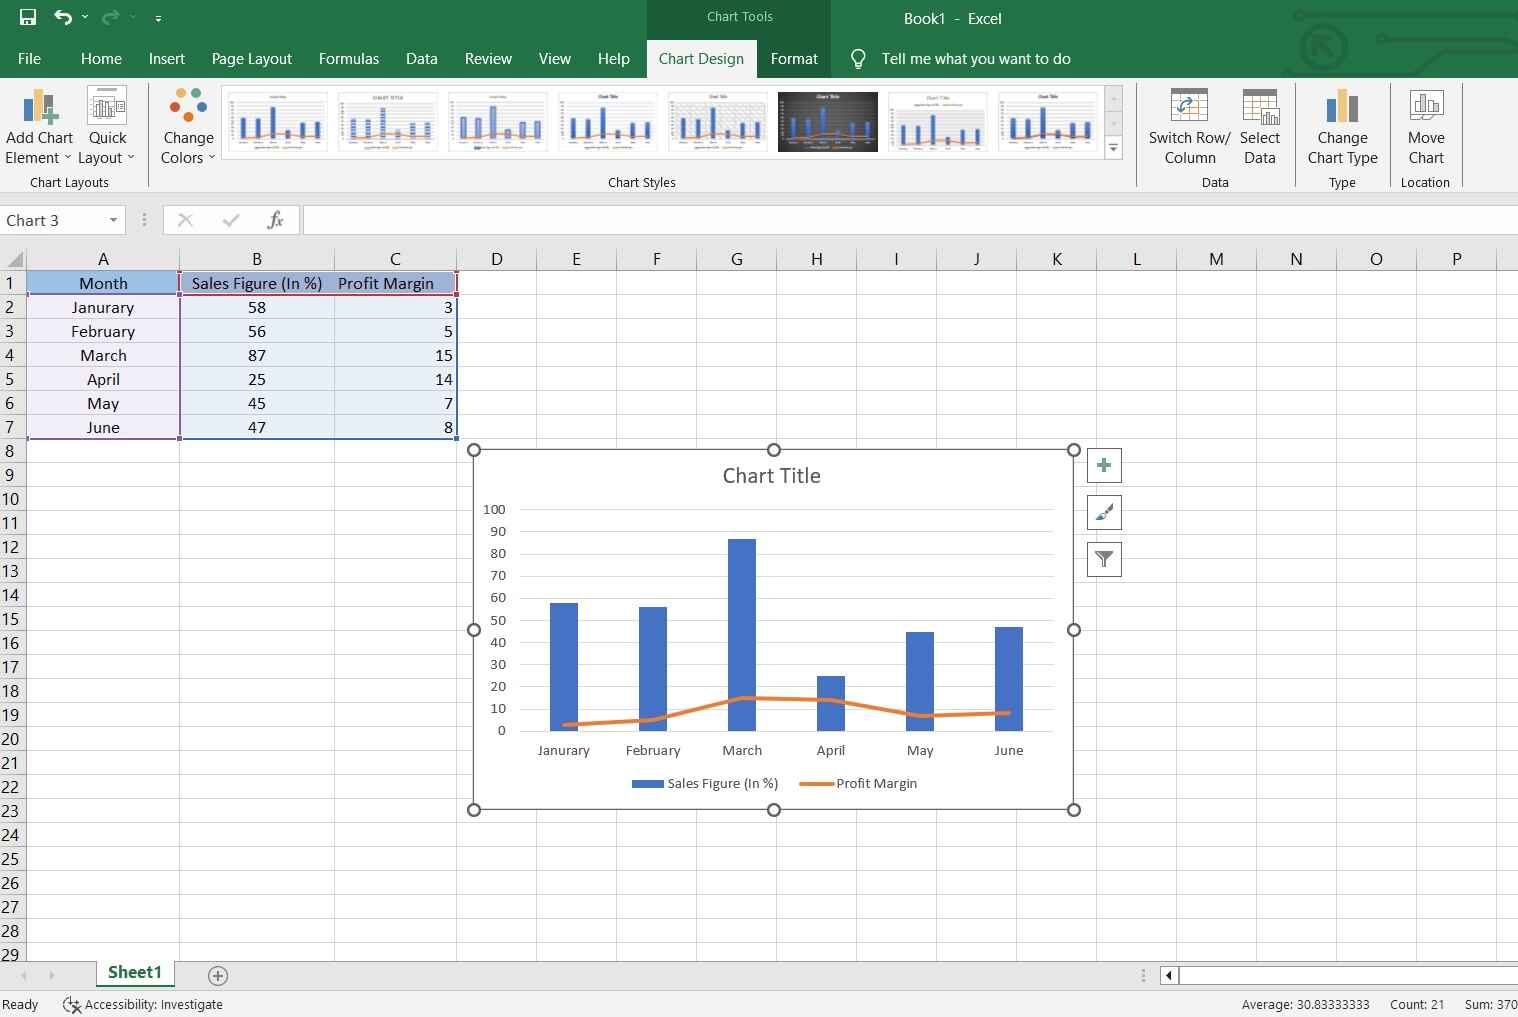
Step 3: Customize the chart by adjusting the axes, titles, and formatting options to suit your preferences.
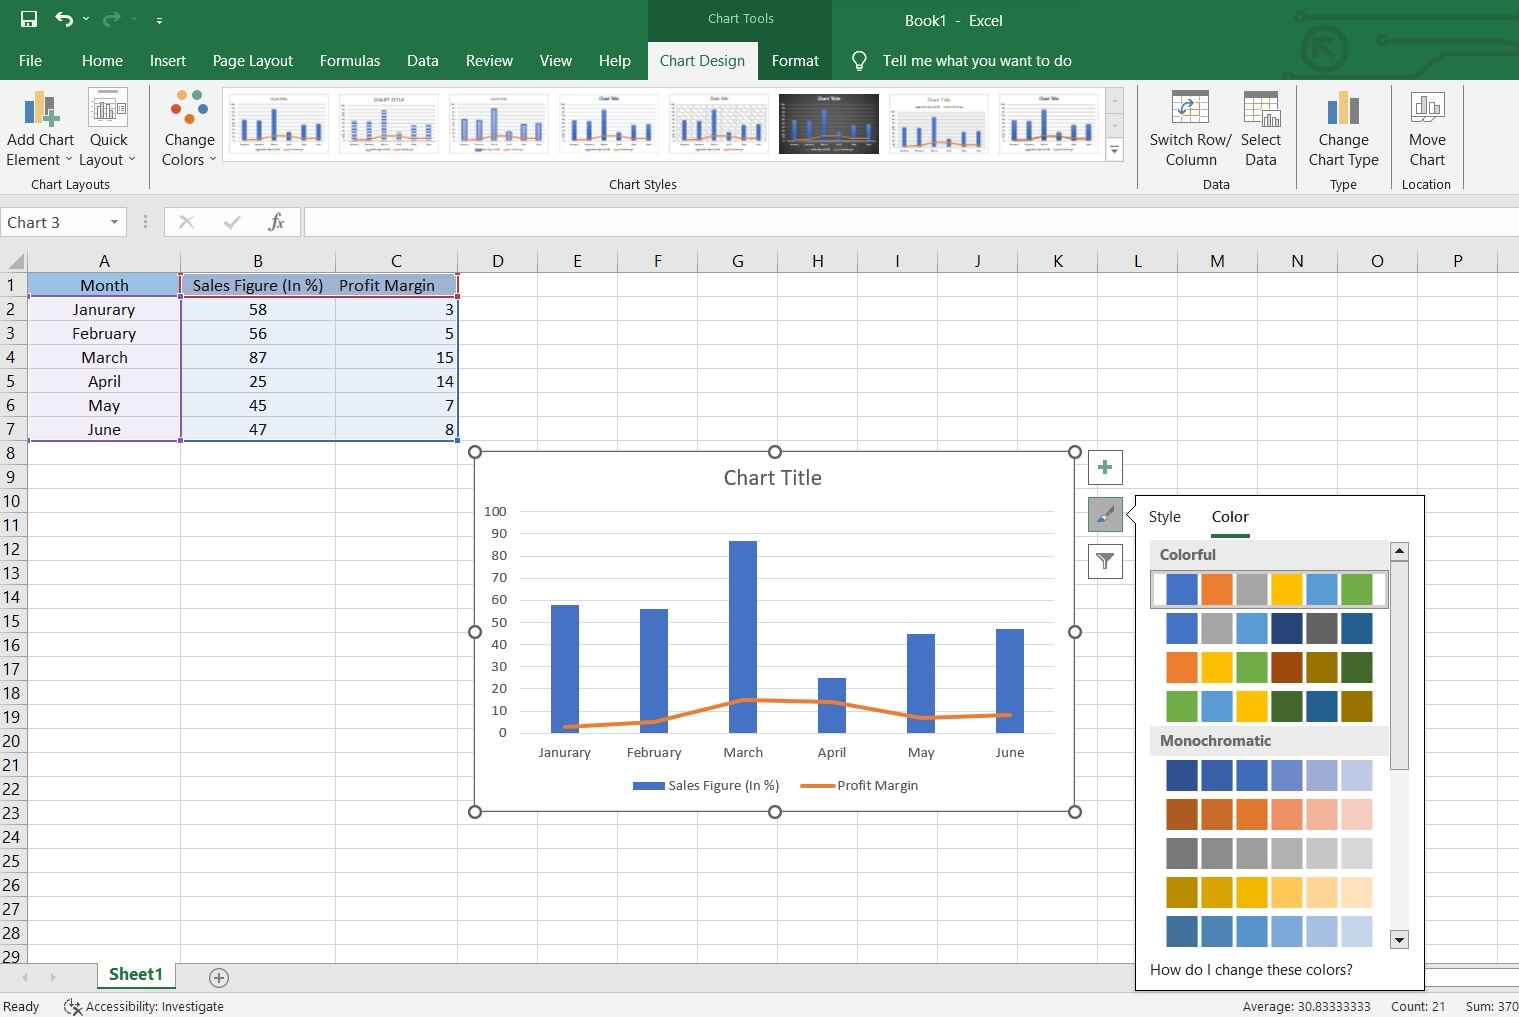
Step 4: Modify colors, styles, and other visual elements to enhance clarity and aesthetics.
Step 5: Double-check your combo chart for accuracy. Once satisfied, go to the "File" menu, click "Save As," and choose a location to save your file.
By following these steps, you can effortlessly create an Excel Combo Chart and save your work for future reference.
Create a Combo Chart Using EdrawMax
Wondershare EdrawMax offers a distinct advantage over Excel when it comes to creating combo charts. Unlike Excel, EdrawMax is specifically designed for intuitive and professional diagramming, making it an ideal choice for complex visual representations like combo charts. Its user-friendly interface and extensive library of templates and symbols streamline the process, allowing users to create visually appealing combo charts effortlessly.
Additionally, EdrawMax provides a wide range of customization options, enabling users to fine-tune every aspect of the chart to meet their specific needs. This level of control ensures that the final combo chart is not only informative but also aesthetically pleasing.
Here are the steps to create a combo chart using EdrawMax:
Step 1: Open EdrawMax and select the "Graph and Chart" category. EdrawMax provides a variety of chart types like bar, line, scatter, etc. Choose the appropriate ones for each series to create the combo effect. Choose the "Combo Chart" template to start your project.

Step 2: Double-click on the data placeholders in the chart to input your own data. EdrawMax allows you to directly type or import data from Excel or other sources.
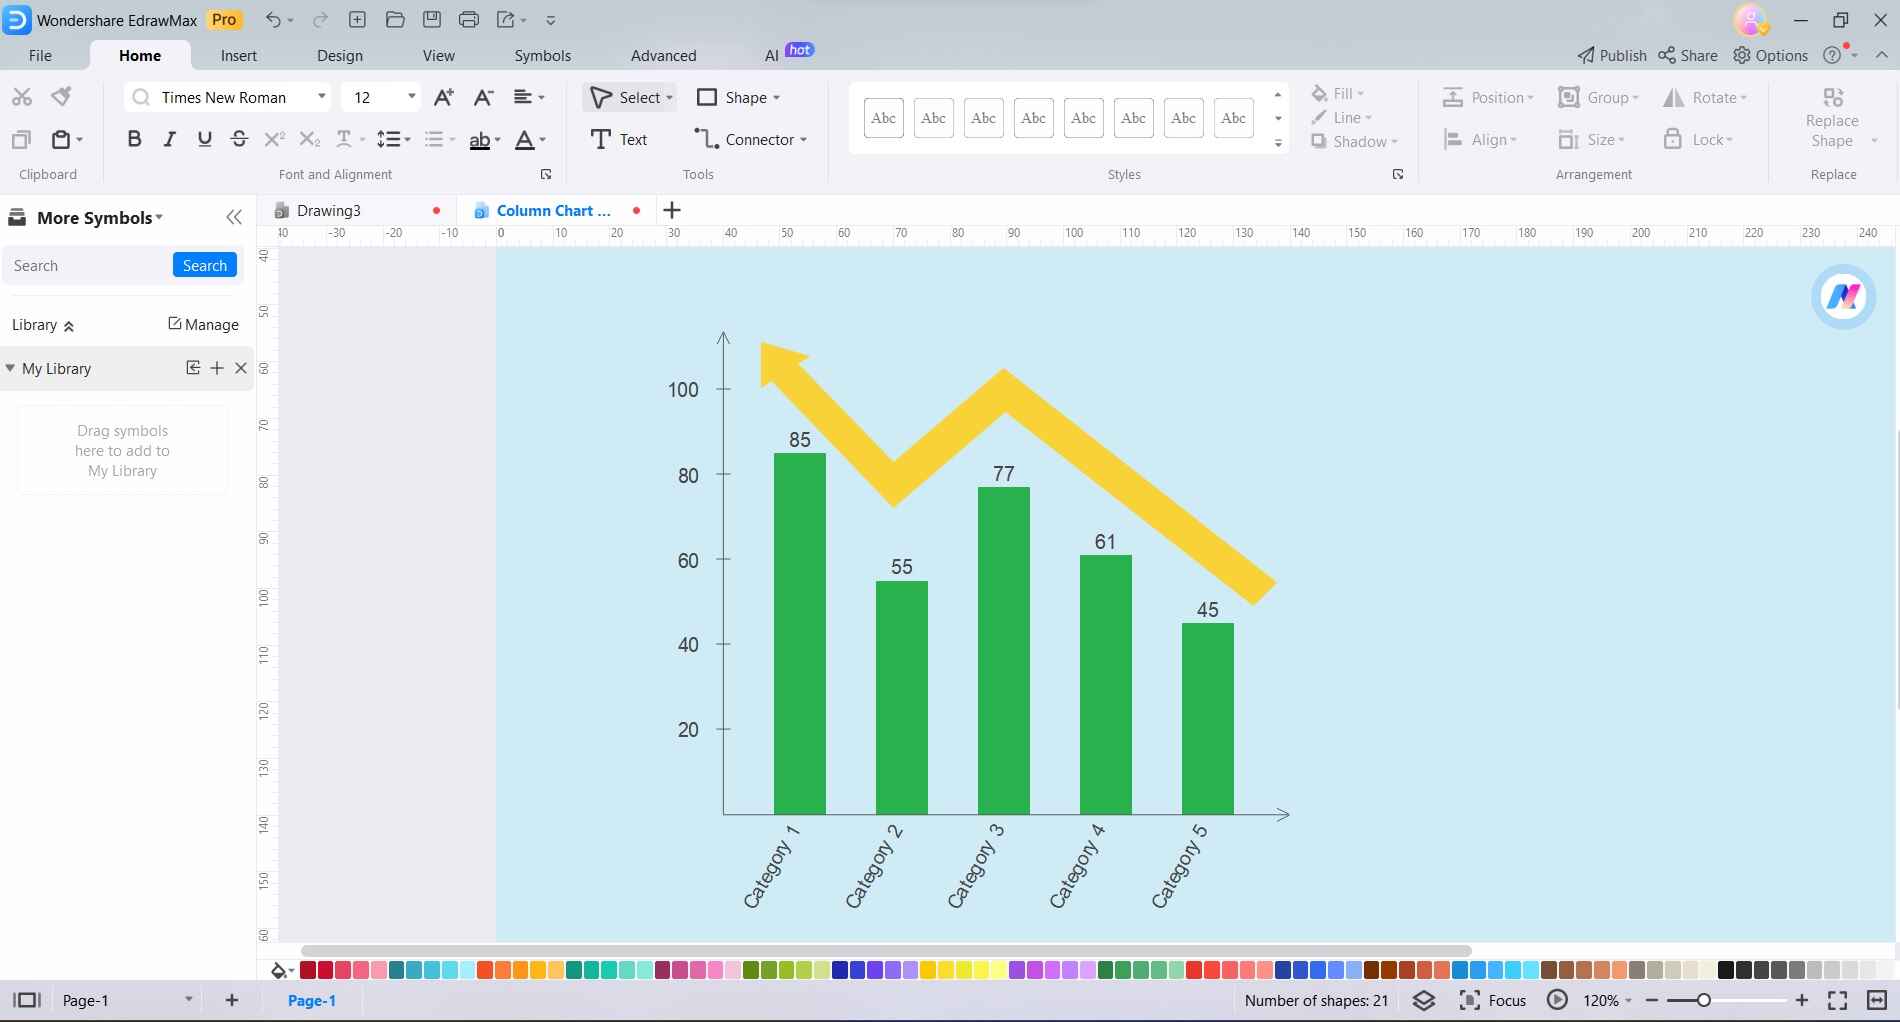
Step 3: Fine-tune the chart by adjusting axes, titles, and labels. You can customize axis scales, add titles, and label data points for clarity.
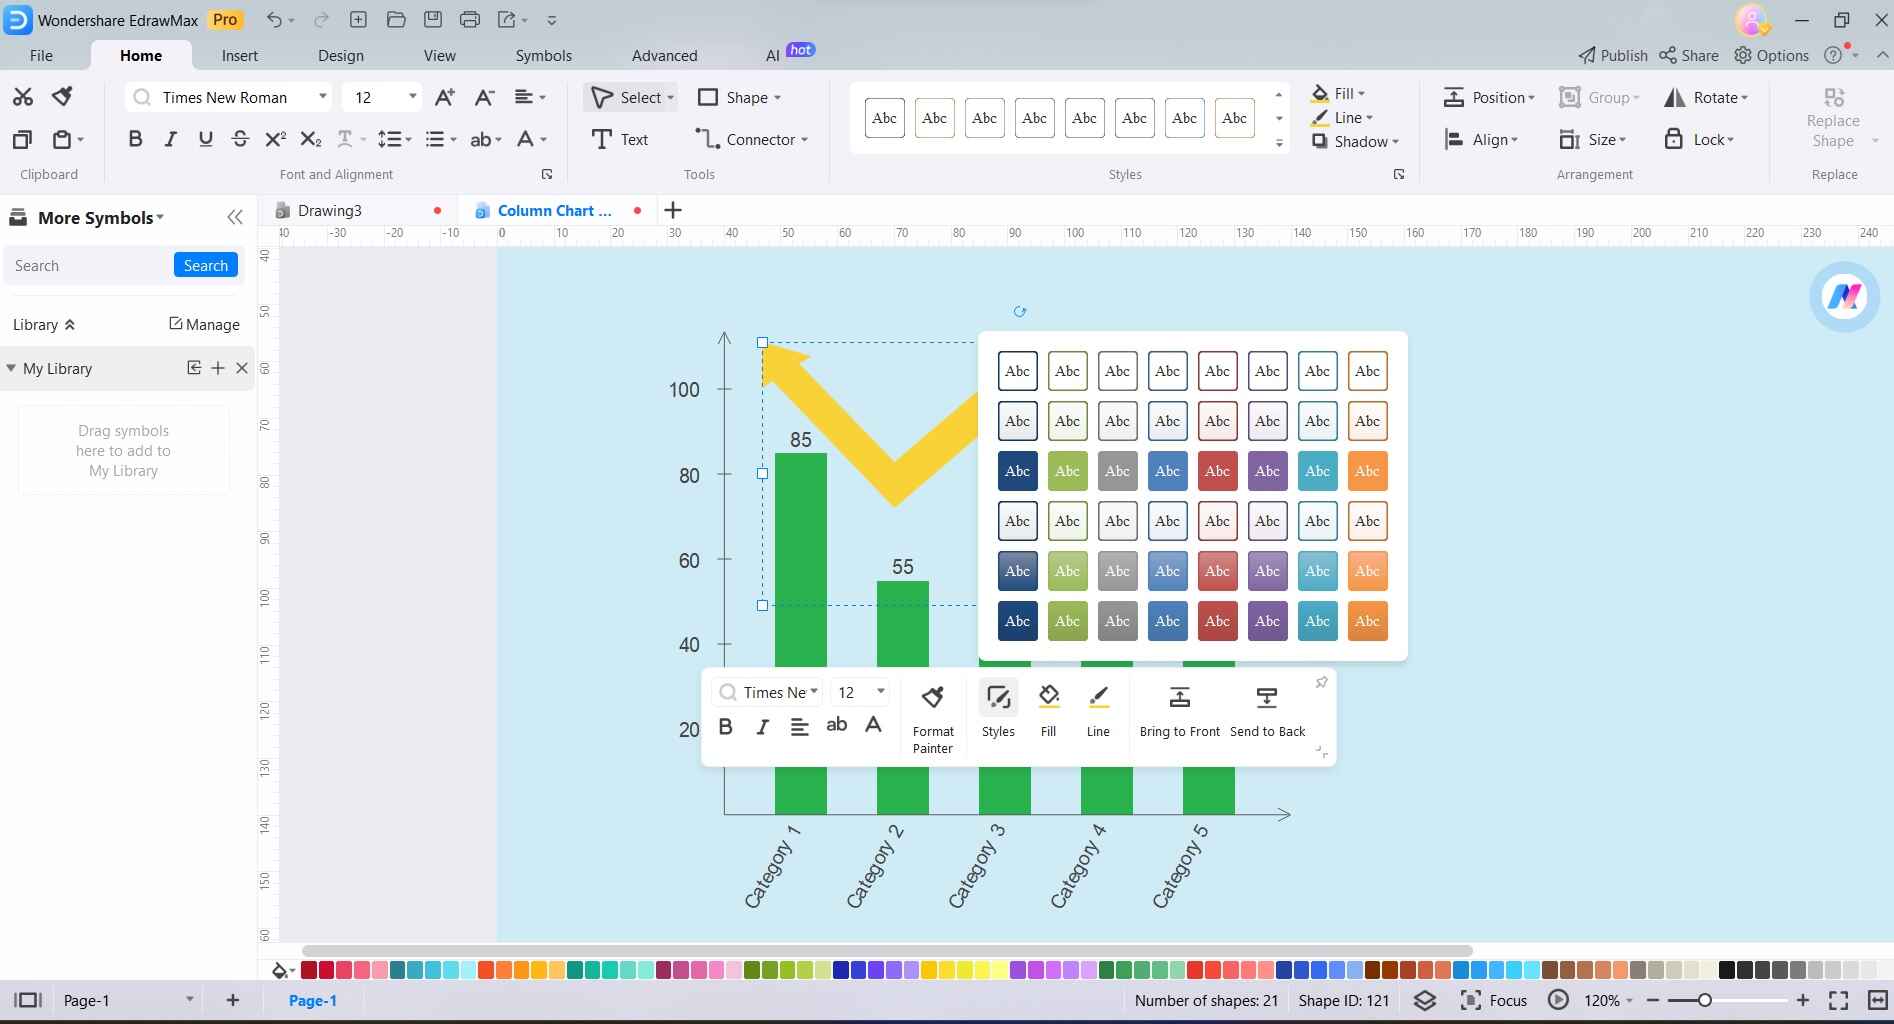
Step 4: Customize the appearance of the combo chart using EdrawMax's formatting options. Modify colors, styles, and other visual elements to enhance the overall aesthetics.
Step 5: Double-check your combo chart for accuracy and coherence. Once satisfied, click on "File" and choose "Save As" to save your project to your desired location. If needed, you can export the combo chart in various formats such as images, and PDFs, or even directly share it through email or social media.
Following these instructions will enable you to adeptly generate a combo chart using EdrawMax, making the most of its user-friendly interface and robust charting functionalities.
How to Export an EdrawMax Combo Chart to Excel
Exporting an EdrawMax Combo Chart to Excel is a seamless process. Here are the steps:
Step 1: Ensure your combo chart in EdrawMax is complete and ready for export. Select the combo chart you want to export by clicking on it.
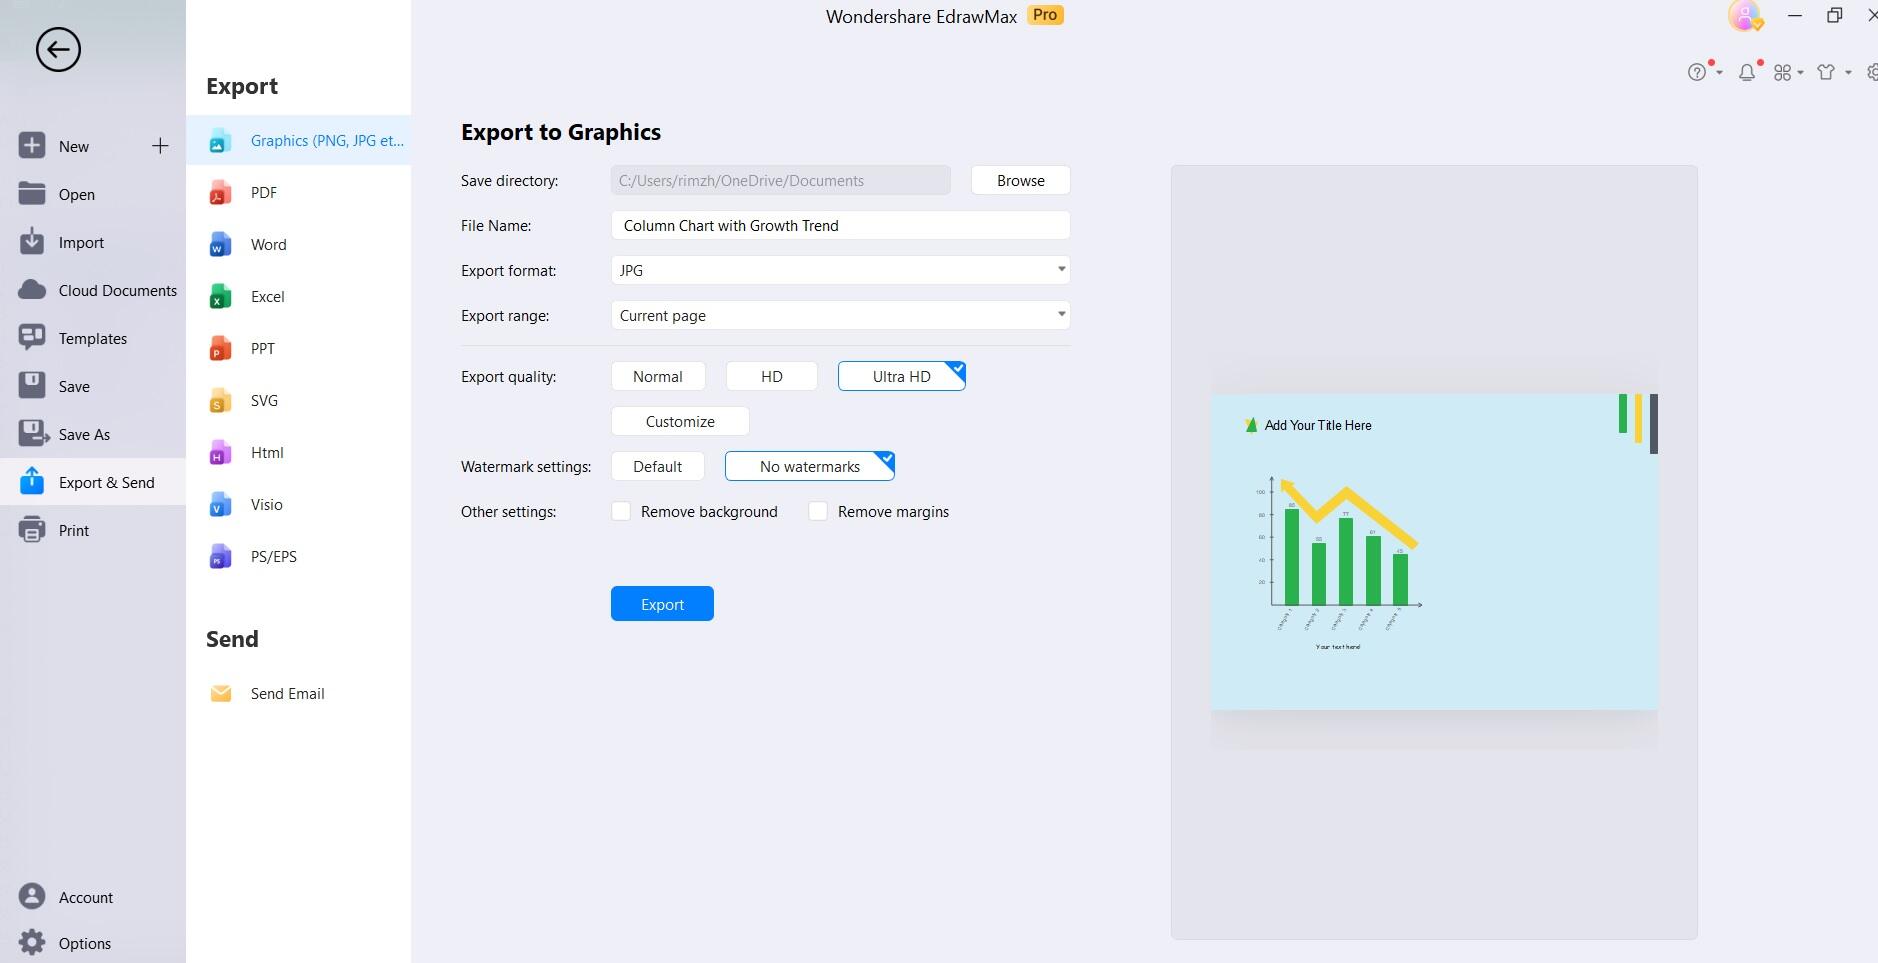
Step 2: Tap on File>Export and Send. From the export options, select "Export to Excel (.xlsx)." This will initiate the export process.
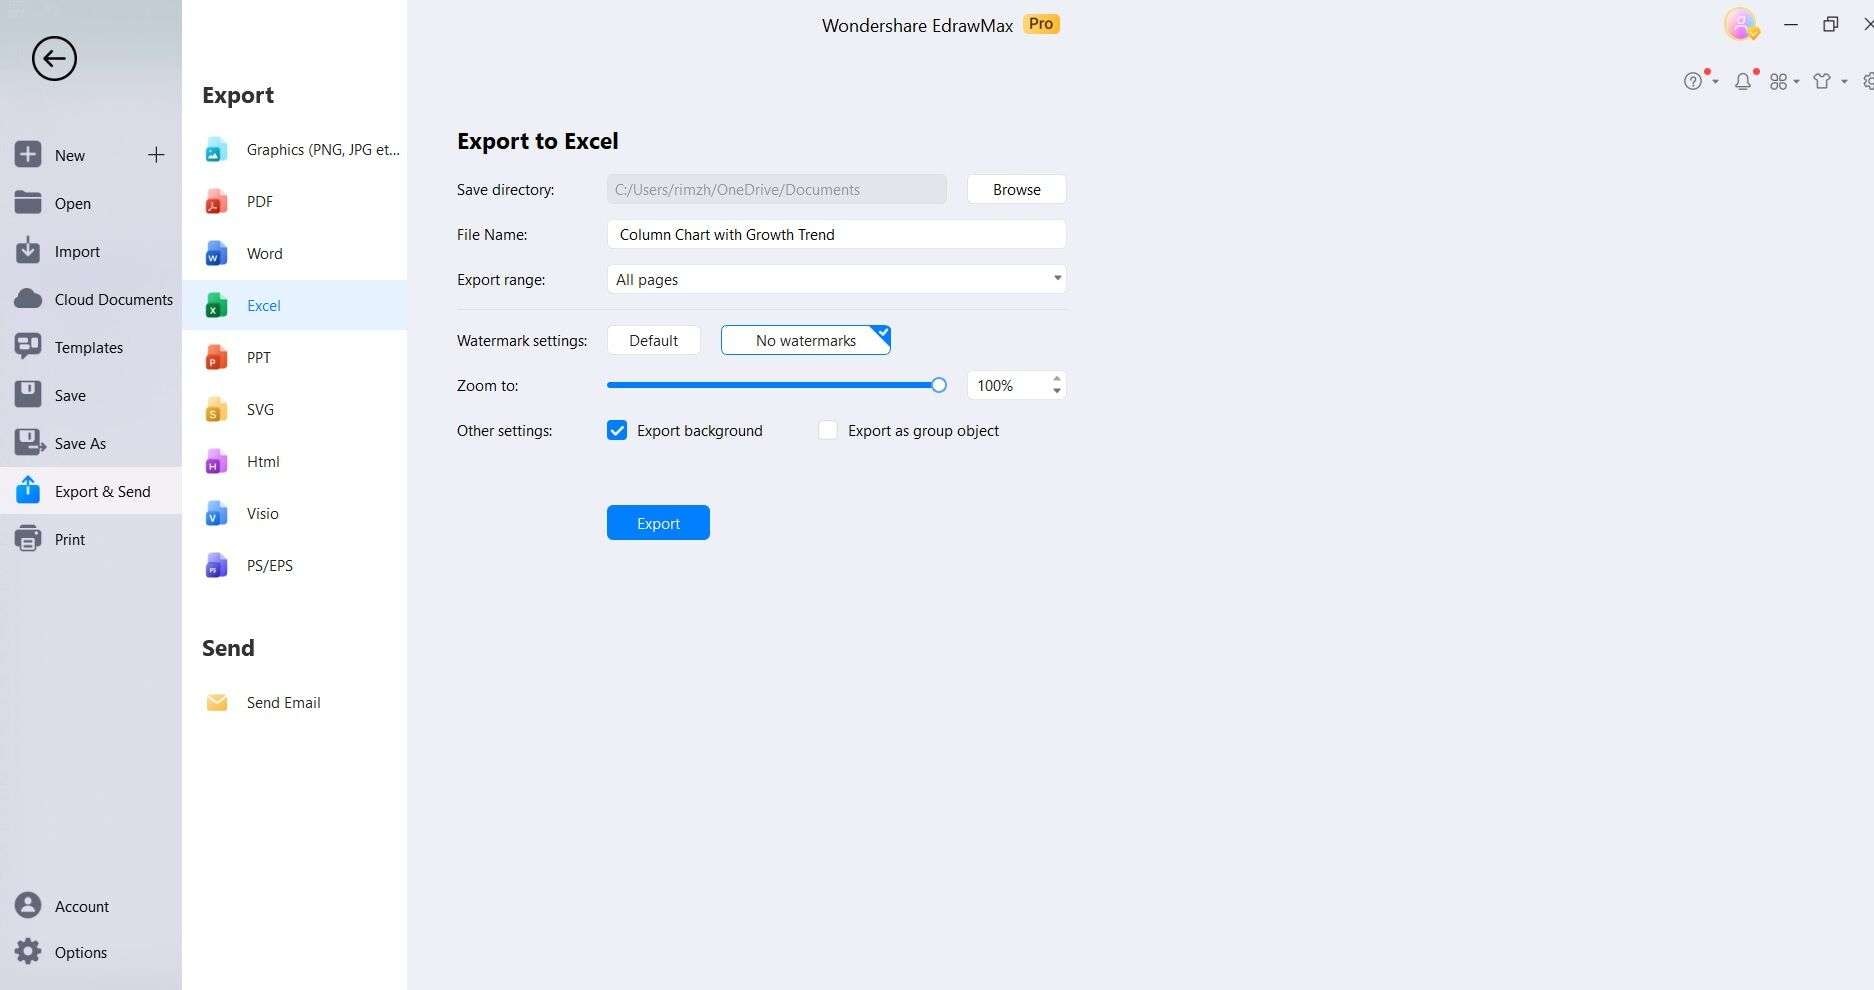
Step 3: A dialog box will appear, prompting you to choose the location where you want to save the exported Excel file. Select the desired folder and click "Save."
Step 4: Once the export is complete, navigate to the chosen location and open the Excel file to ensure that the combo chart has been accurately transferred.
Following these steps makes it straightforward to export an EdrawMax combo chart to Excel, providing you with the opportunity to conduct additional data analysis or manipulation within the familiar Excel environment with ease.
Conclusion
In summary, creating and exporting combo charts proves to be an essential skill for impactful data representation. While Excel serves as a reliable option, EdrawMax's user-friendly interface and powerful features offer a notable advantage. The seamless export to Excel enhances analytical capabilities, merging the strengths of both platforms.
Armed with these steps, you're poised to fully utilize combo charts, adding a layer of depth and clarity to your data presentations.
AI Diagram Generator
Enter your prompt. Upload files if needed. Generate diagrams, charts, or slides instantly.


