


Running any sort of business could be more challenging than it seems. It requires a lot of effort and time to do something out of the box. For example, if you have a manufacturing industry, you should keep the raw material in stock and monitor the production level regularly to produce better outcomes.
This is where an Ishikawa diagram could lend you a helping hand. It is a business tool used to investigate and identify different causes of a specific outcome, issue, or event. If you are looking forward to exploring this diagram with examples in detail, you will never want to miss this read.
Content Table
Part 1. What Is an Ishikawa Diagram?
If you want to identify the root causes of a problem, an Ishikawa diagram will be your best partner. The diagram’s name is derived from its creator’s name, Kaoru Ishikawa. Ishikawa diagram is also known as the Fishbone diagram or Cause and Effect diagram. If you see the structure of this diagram, you will find it similar to a fish. The fish head presents the outcome, whereas the smaller bones indicate the event’s causes.
In the Ishikawa diagram, the problem is placed on the rightmost side of the structure. The central problem is called “effect.” The line (spine) is drawn from right to left. Other branches are attached to it from below and above the line. The branches are called affinities. While brainstorming, you can add more branches to affinities.
Why ishikawa diagram Is Important & Where to Use?
The Ishikawa diagram plays a key role in brainstorming. The most common use of this diagram is in the product development process. It brainstorms and outlines various steps within a particular process and allocates resources accordingly. Moreover, it helps you determine if you are likely to face quality control issues.
At the same time, the Ishikawa diagram also lends you a helping hand in troubleshooting different processes and resolving issues in a system.
Part 2. Exploring the 5 Best Examples of Ishikawa Diagram
This section presents 5 Ishikawa diagram examples to help better understand the working of this diagram. Let’s get deeper into the details of each example presented below.
1. 4S Model Fishbone Diagram
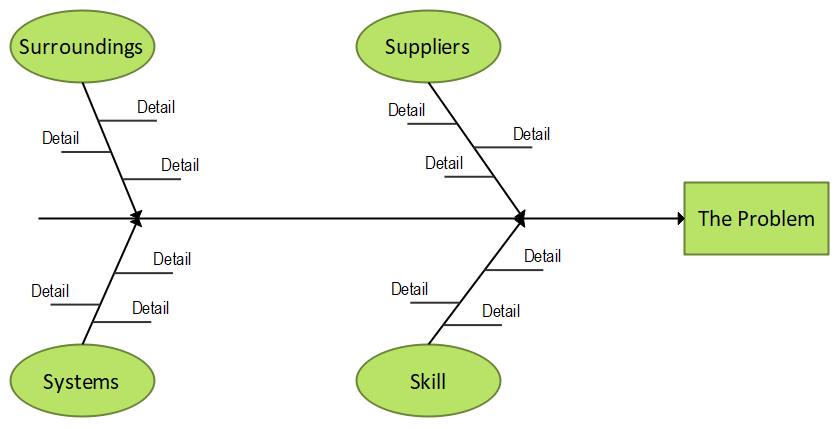
The 4S Model Fishbone diagram is commonly used in the service industry. It holds four categories to organize different types of information. These categories include; suppliers, surroundings, skills, and systems, as shown below. Every category carries pieces of information that help you get out of trouble.
For example, you run a restaurant, and you are worried about a significant decrease in the number of customers. You can use the 4S Model Fishbone diagram to understand the root cause of this problem in a better way.
2. Academic Record Cause-Effect Diagram
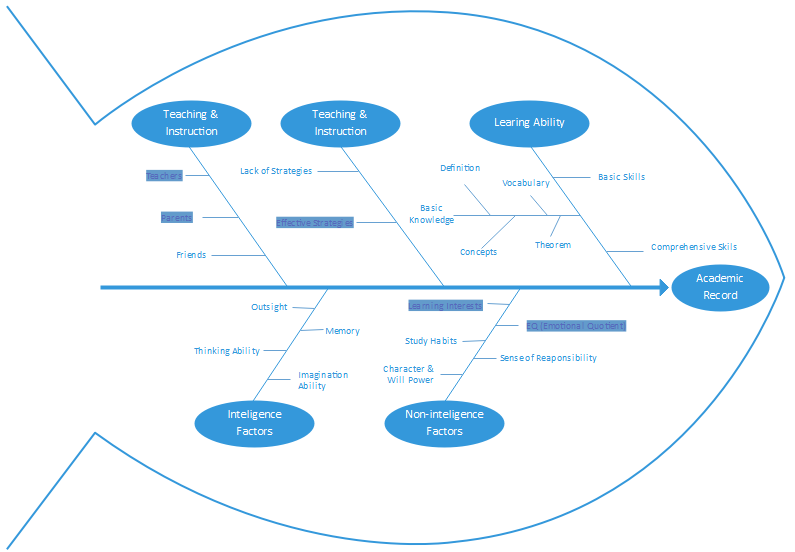
This is another key Ishikawa diagram template or example. This diagram has different categories, including teaching and instructions, learning ability, intelligence factors, and non-intelligence factors, as shown below.
The first category presents information associated with the strategies to be followed by teachers, parents, and friends. Similarly, the “learning ability” category is linked with other parameters, like basic knowledge, basic skills, concepts, vocabulary, definition, and more.
The third category - intelligence factors - deals with imagination ability, thinking ability, memory, and outsight. At the same time, the “non-intelligence factors” category is associated with a sense of responsibility, study habits, and willpower. All they contribute to forming an academic record.
3. Car Breakdown Fishbone Diagram
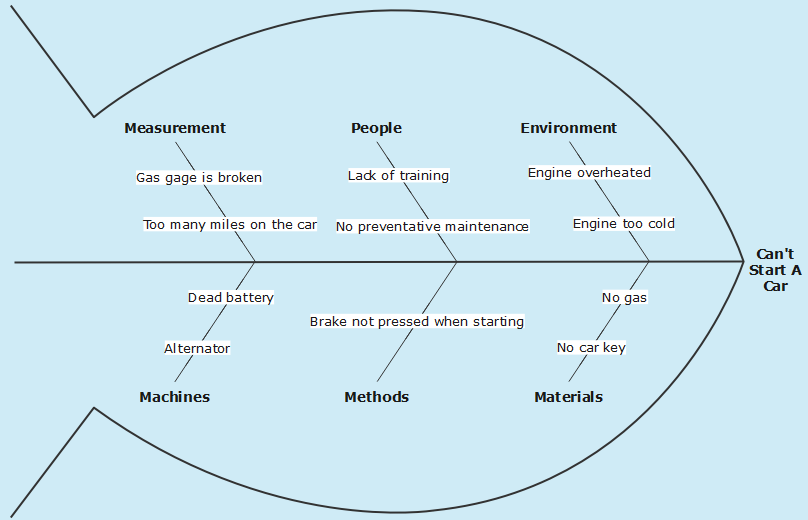
This Ishikawa diagram example presents a car breakdown with six different categories, including measurement, people, environment, machines, methods, and materials, as shown in the image below. The first category determines if there are too many miles on a car or if the gas gauge is broken. The second category is about preventive maintenance and lack of training. Whereas the third category is associated with the environment, like the engine is too cold or overheated.
Moving on to the “machines” category, you will see the parameters; alternator and battery status. The fifth category is about methods, i.e., the brake is not pressed when starting the car. At the same time, the last category deals with materials, like gas and key availability.
4. Pandemic Analysis Fishbone Diagram
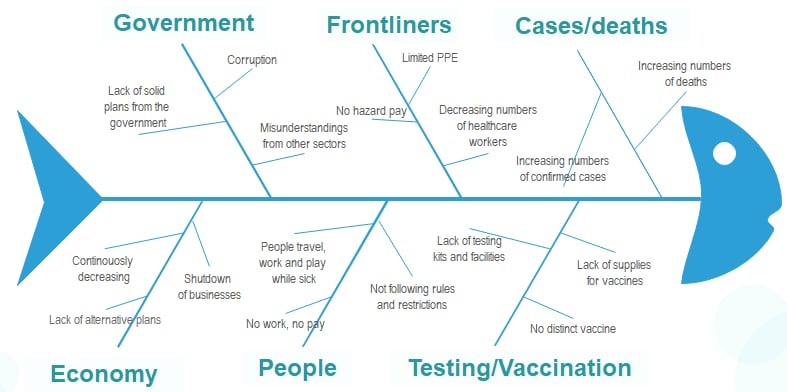
This is one more Ishikawa diagram example that presents the scenario when COVID-19 entered the Philippines market. It divides the information into six categories: government, front liners, cases, economy, people, and testing.
The first category deals with parameters like corruption in the government sector, lack of effective planning, and misunderstandings. Limited PPE, reduction in the number of healthcare workers, and other similar information is presented in the second category, front liners.
The increase in the number of COVID-19 cases in the Philippines and the increasing number of deaths are part of the third category. The fourth category highlights the effect of this pandemic on the Philippines economy, like the lack of alternative solutions and business shutdowns.
The “people” category is about the movement of people while they are sick because they will not get paid if they don’t work. Violating the rules is also part of this category. On the other hand, the sixth category highlights a lack of facilities and testing kits. Plus, the lack of vaccine suppliers is also included in this category.
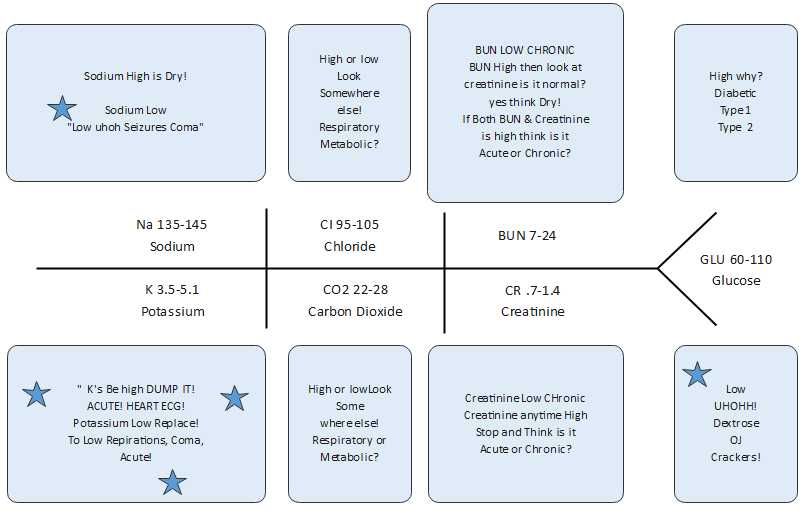
5. Fishbone Diagram Electrolytes
The distinction between chronic and acute conditions is presented in this Ishikawa diagram example. It carries seven lab tests that are examined routinely in different patients’ plasma/serum. The series of tests include BUN, chloride, sodium, creatinine, carbon dioxide, and potassium, as shown below.
Part 3. How to Make Such an Ishikawa Diagram in Minutes?
Creating an Ishikawa diagram online is made super easy with EdrawMax. This is not only an efficient tool but also provides you with unmatchable outcomes in the end.
What Makes EdrawMax Stand Out?
Factors that set this diagramming utility apart are as follows.
- You can try it for free!
- An online version is also available
- Super amazing user interface
- Efficient diagramming ability
- This tool allows you to make a cloud-based workspace.
- It comes with more than 26,000 symbols and over 15,000 pre-built templates.
- It offers over 280 diagram types.
- It supports various formats including Visio, Graphics, Office, Html
- Trusted by over 30 million users, including Fortune 500
- You can easily share your work on various social media channels.
Steps for Creating a Fishbone Analysis Diagram with EdrawMax
Follow these simple steps to create an informative and impressive fishbone diagram within minutes.
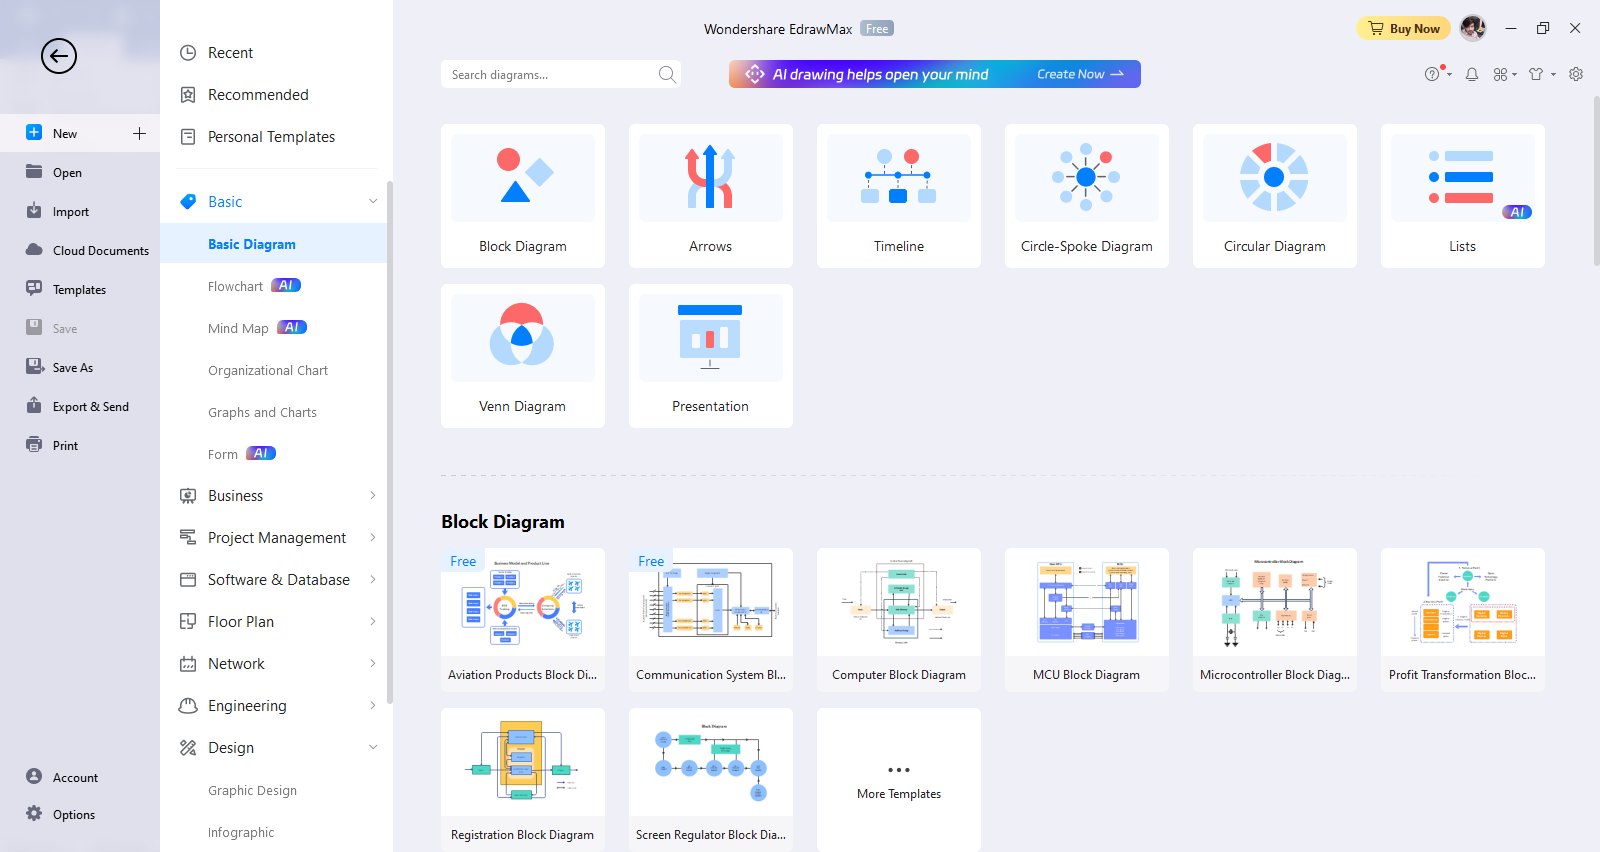
Step 1: Download Wondershare EdrawMax or try the online version, install it on your device, and open it.
Step 2: Now, tap on the "File" menu, click "New", and choose "Management". Then, select “Cause and Effect Diagram.”
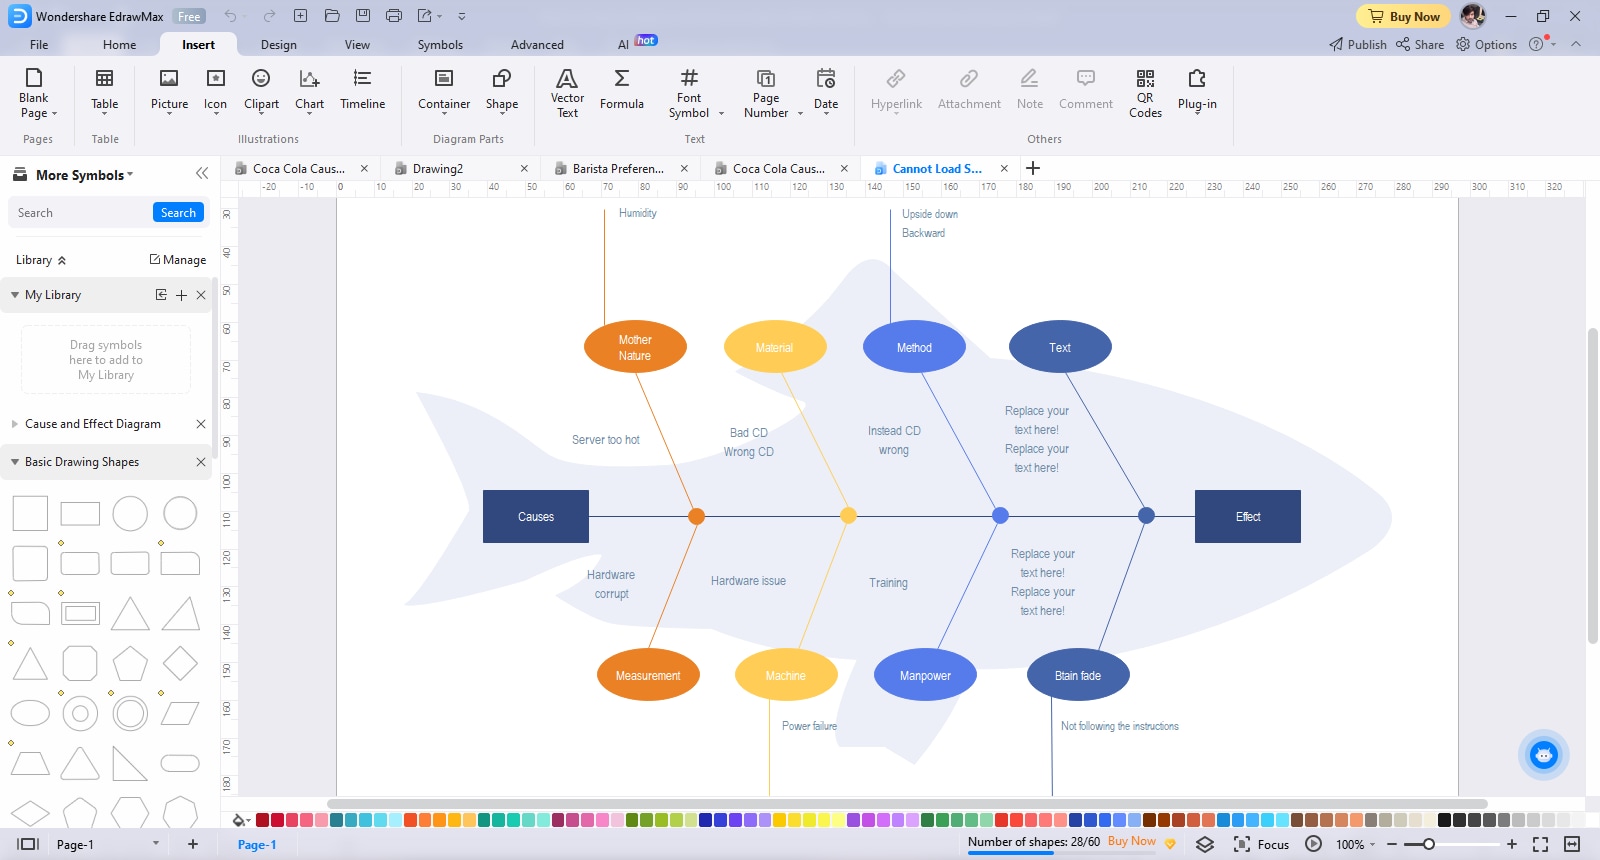
Step 3: It is time to customize your cause and effect diagram so that it can best match your needs. It includes writing problem descriptions and labeling branches and categories with relevant fields.

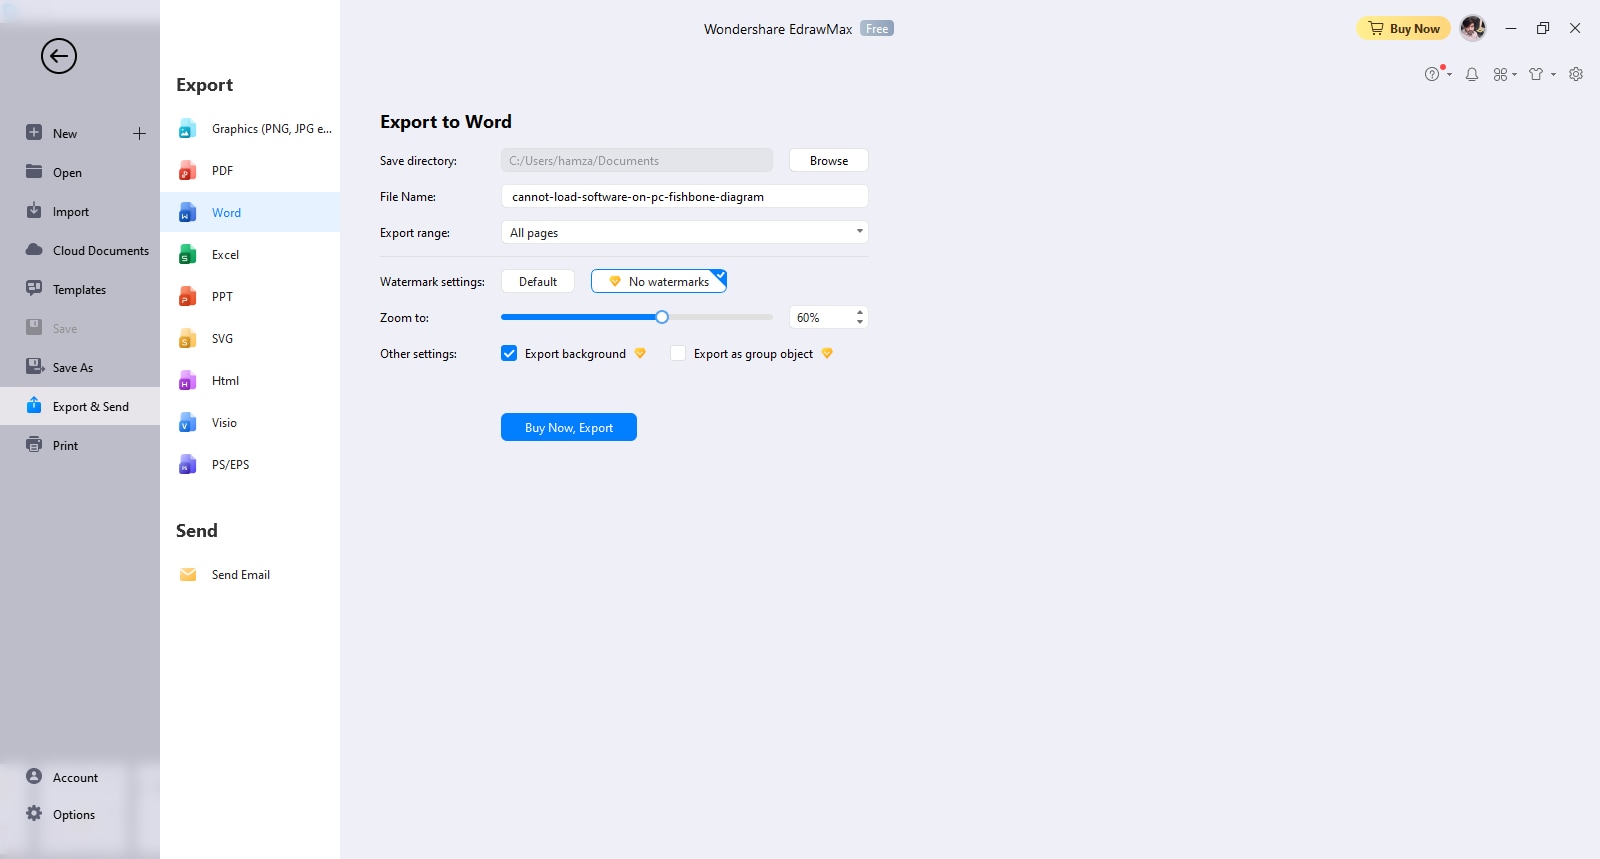
Step 4: Last but not least, tap on the “File” menu and hit the “Export & Send” option. Here, you can choose any file format you want to export or save your fishbone diagram. This way, you can save your Ishikawa diagram template in Word or Excel.
Part 4: Final Words
The Ishikawa diagram makes it easy for you to get to the roots of the problem. The above discussion has presented a couple of Ishikawa diagram examples to make this subject easily understandable for you. If you want to create a fishbone diagram, look no further than EdrawMax.
AI Diagram Generator
Enter your prompt. Upload files if needed. Generate diagrams, charts, or slides instantly.


