


A scatter graph is a type of data visualization that is used to show the relationship between two numerical variables. It consists of multiple data points that are plotted on the graph, with each point representing the values of both variables for a single observation. Here, we will discuss the advantages of making a scatter graph online and more.
In this article
Part 1: Advantages of Making a Scatter Graph Online
There are several advantages of making a scatter graph online. These advantages are the reason why making scatter graphs online is common practice.
- Accessibility: Creating a scatter graph online provides the advantage of accessibility, as it allows users to access and work on their graphs from any location with an internet connection.
- Collaboration: Online scatter graph tools often come with collaborative features that enable multiple users to work on the same graph simultaneously.
- Data Integration: Online scatter graph tools may offer integration with various data sources, such as spreadsheets, databases, or cloud storage services.
Part 2: Useful Tips to Make a Scatter Chart Online
Following some essential tips when making a scatter chart online can be very useful. These tips help in making scatter charts online that are effective.
- Data Preparation: Before creating a scatter chart online, it is important to ensure that the data is properly formatted and organized. This may involve cleaning the data, removing any outliers or errors, and arranging the data into the appropriate columns or fields for the scatter chart.
- Choosing the Right Tool: It is essential to select the right scatter plot maker that aligns with the specific requirements of the data and analysis. Consider factors such as the tool's features, compatibility with data sources, ease of use, and availability of support or tutorials.
- Selecting Variables: Carefully choose the variables to be plotted on the scatter chart, ensuring that they are relevant to the analysis and effectively represent the relationship being examined. It is important to consider the independent and dependent variables and how they will be depicted on the chart.
- Customizing Appearance: Many online scatter chart tools offer options for customizing the appearance of the chart, including colors, markers, labels, and axis scales. Take advantage of these customization features to ensure that the scatter chart is visually appealing and effectively communicates the data.
- 3D Scatter Plots: If there are three variables in your dataset, consider making a 3D scatter plot. The steps are basically the same as a 2D one.
Part 3: Importance of Customizing a Scatter Diagram
The importance of customizing a scatter diagram online cannot be understated. Therefore, it is crucial to customize scatter diagrams.
- Clarity and Communication: Customizing a scatter diagram is important for enhancing the clarity and communication of the data being presented. By adjusting the appearance, labels, and other visual elements, the scatter diagram can effectively convey the relationships and patterns within the data to the audience.
- Emphasis on Key Findings: Customization allows for the emphasis of key findings or specific data points within the scatter diagram. By highlighting important elements through color, size, or annotations, the audience's attention can be directed to the most significant aspects of the data, aiding in the communication of insights and conclusions.
- Tailoring to Audience: Customizing the scatter diagram can help tailor the presentation to the specific audience, whether it is a technical audience requiring detailed data or a general audience needing a more simplified and visually appealing representation.
Part 4: Advanced Techniques for Analysis in Online Scatter Graphs
Some advanced techniques for analysis in online scatter graphs exist. These techniques help in the efficient analysis of online scatter graphs.
- Trend Lines and Regression Analysis: Many online scatter graph tools offer the capability to add trend lines and perform regression analysis, allowing users to identify and analyze trends, correlations, and predictive relationships within the data.
- Interactive Data Filtering: Advanced online scatter graph tools may include interactive data filtering options, enabling users to dynamically adjust the displayed data based on specific criteria or conditions.
- Statistical Analysis Integration: Some online scatter graph tools integrate with statistical analysis software or libraries, allowing users to perform advanced statistical tests, hypothesis testing, and significance analysis directly within the graphing tool.
Part 5: Creating a Scatter Graph Using Wondershare EdrawMax
Wondershare EdrawMax is the best tool for creating a scatter graph because of its user-friendly interface, advanced features, and wide range of templates.
With just a few clicks, users can easily create professional-looking scatter graphs to represent their data. It also offers customization options, such as adding labels and changing the appearance of the graph, making it the perfect tool for any data visualization needs. Follow these steps to create a scatter graph using the tool:
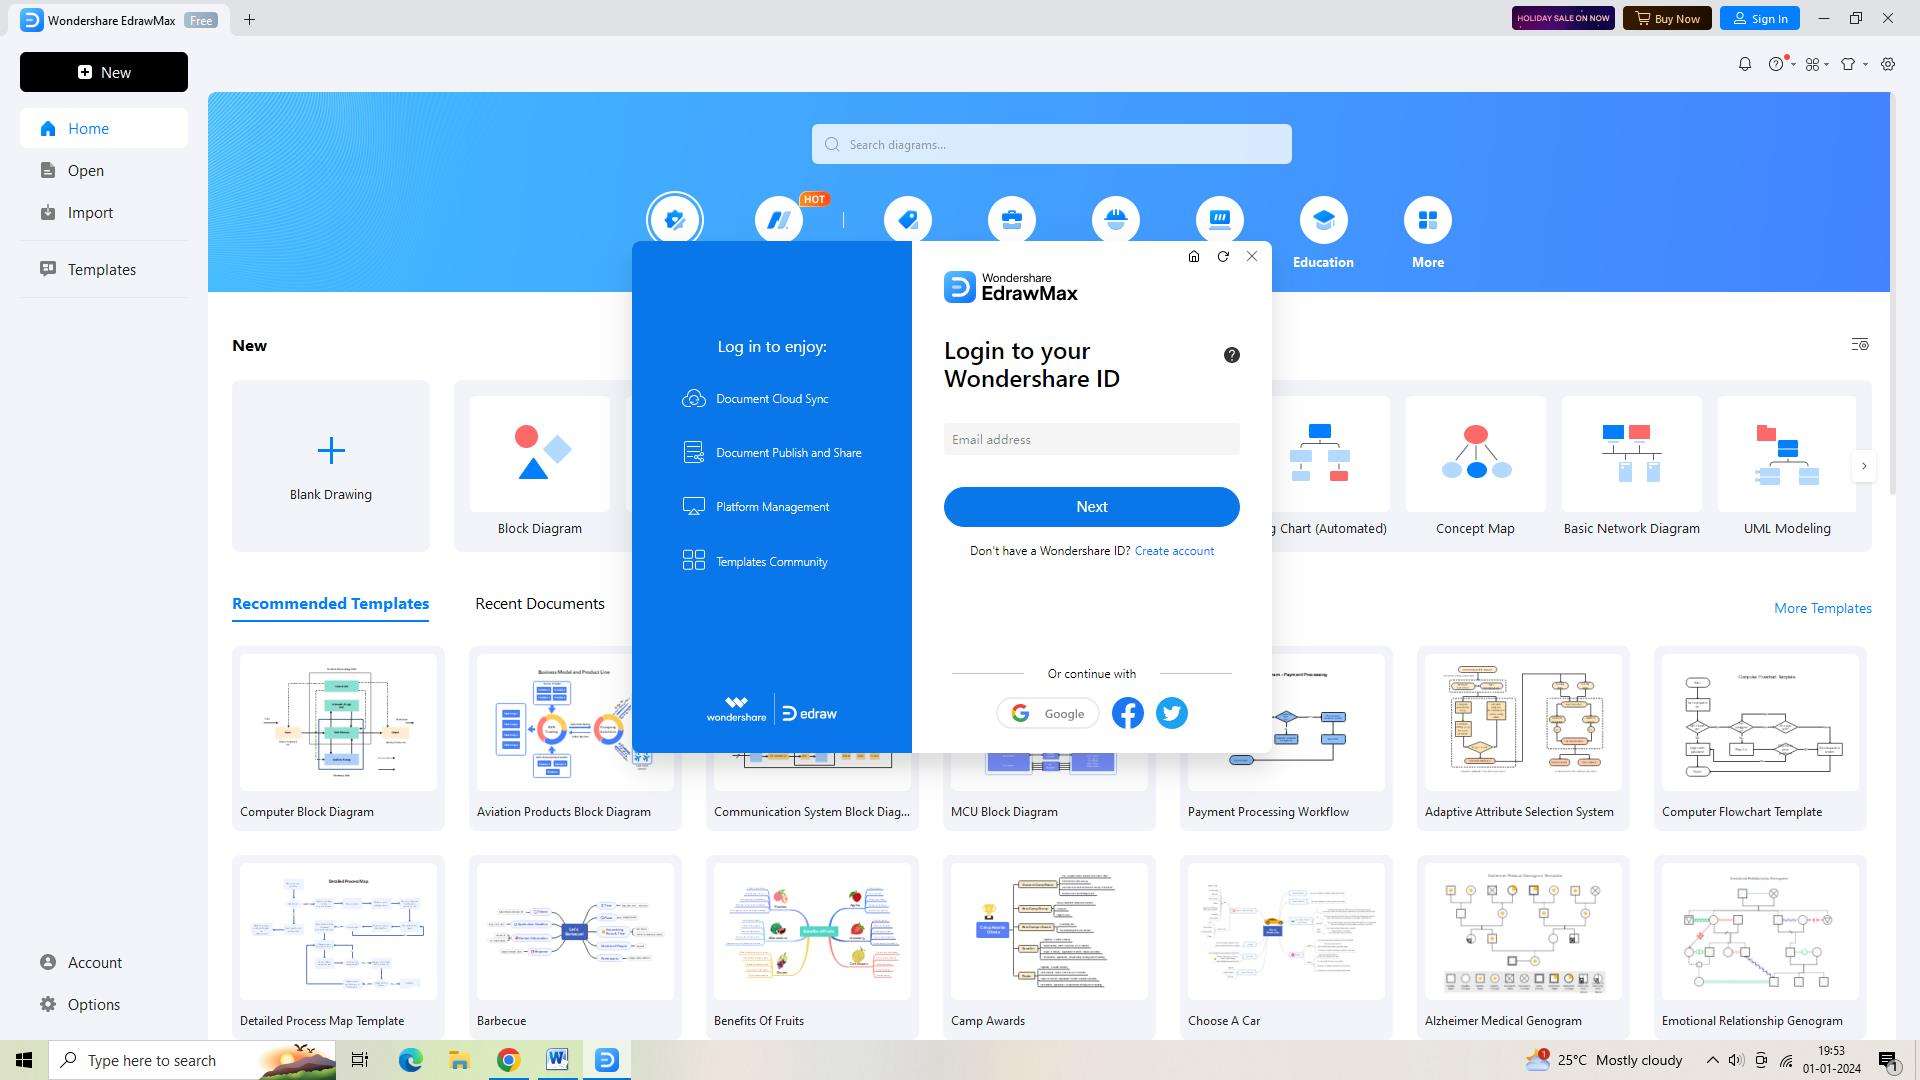
Step 1:
Begin by launching Wondershare EdrawMax and logging in with your credentials. Ensure that you enter your login information accurately.
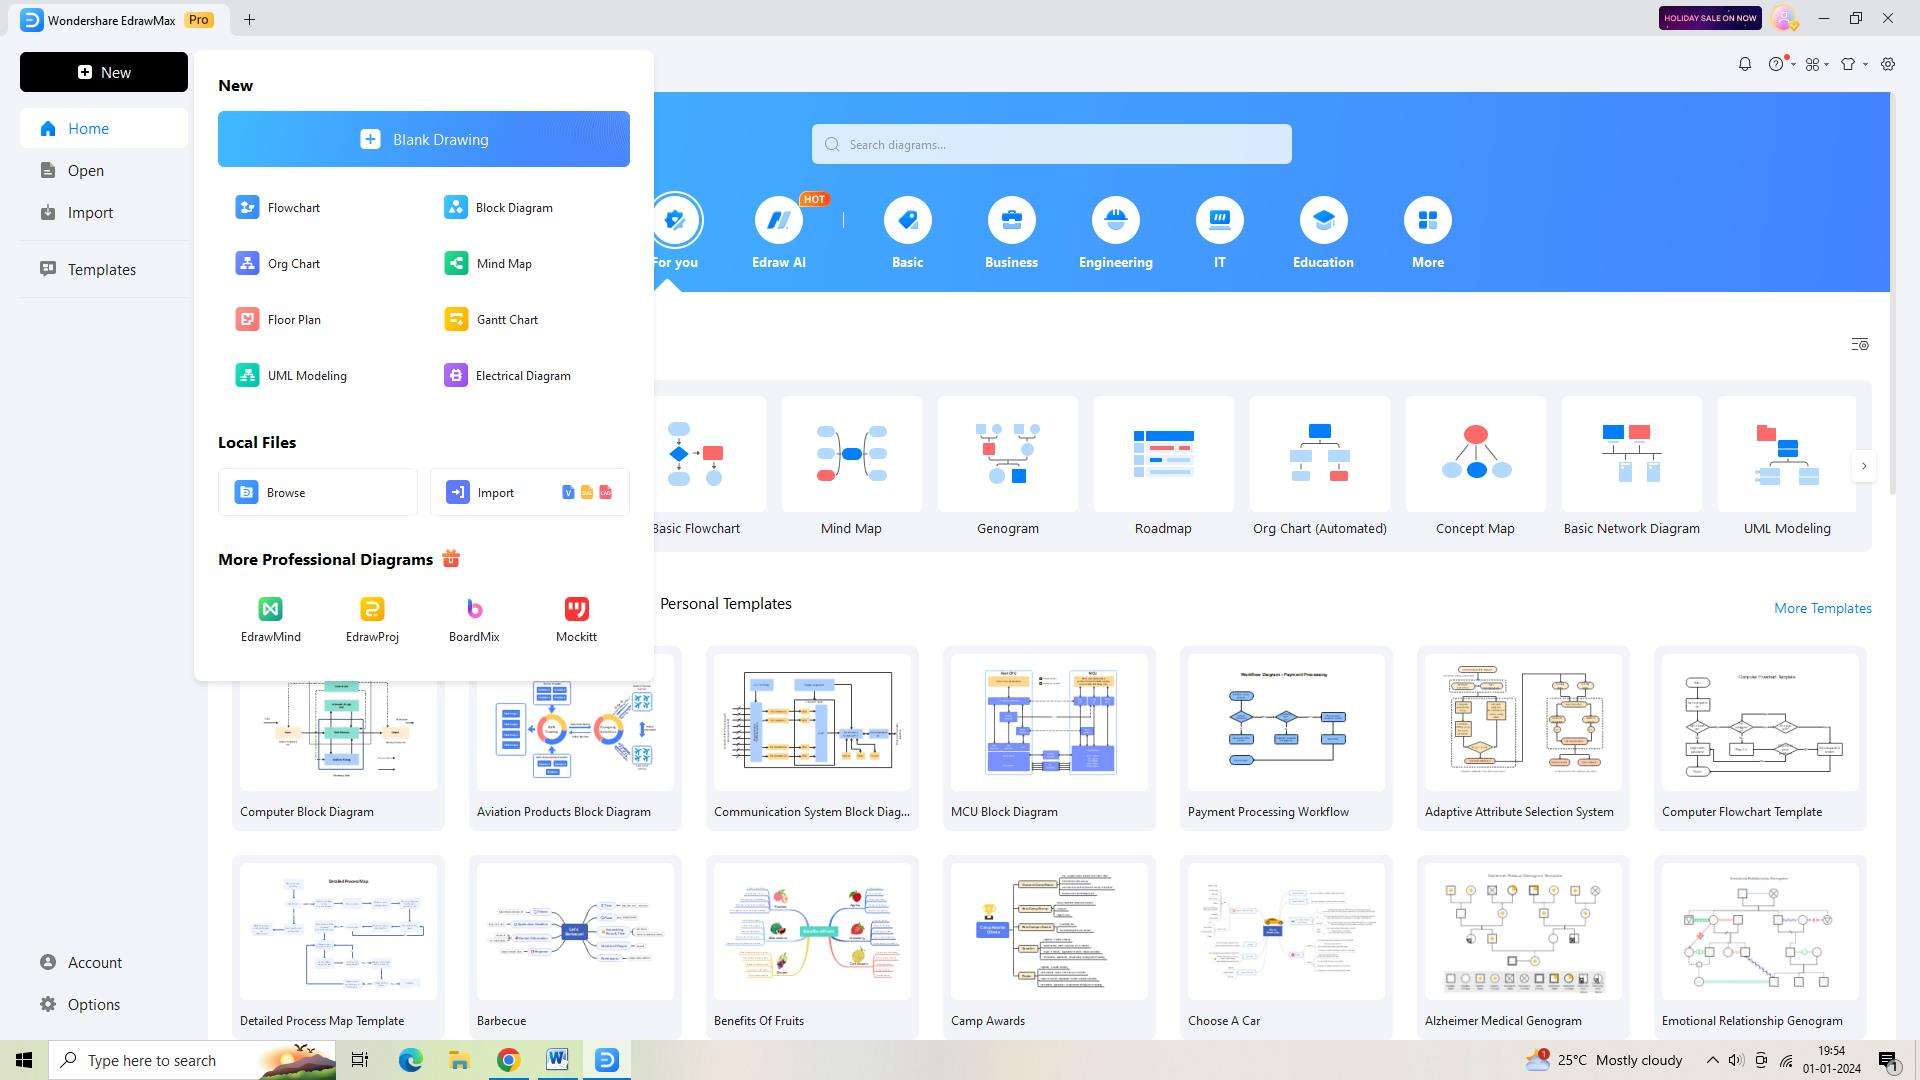
Step 2:
Once logged in, create a new document by clicking on the "+" symbol next to the "New Document" button located at the top left of the interface.
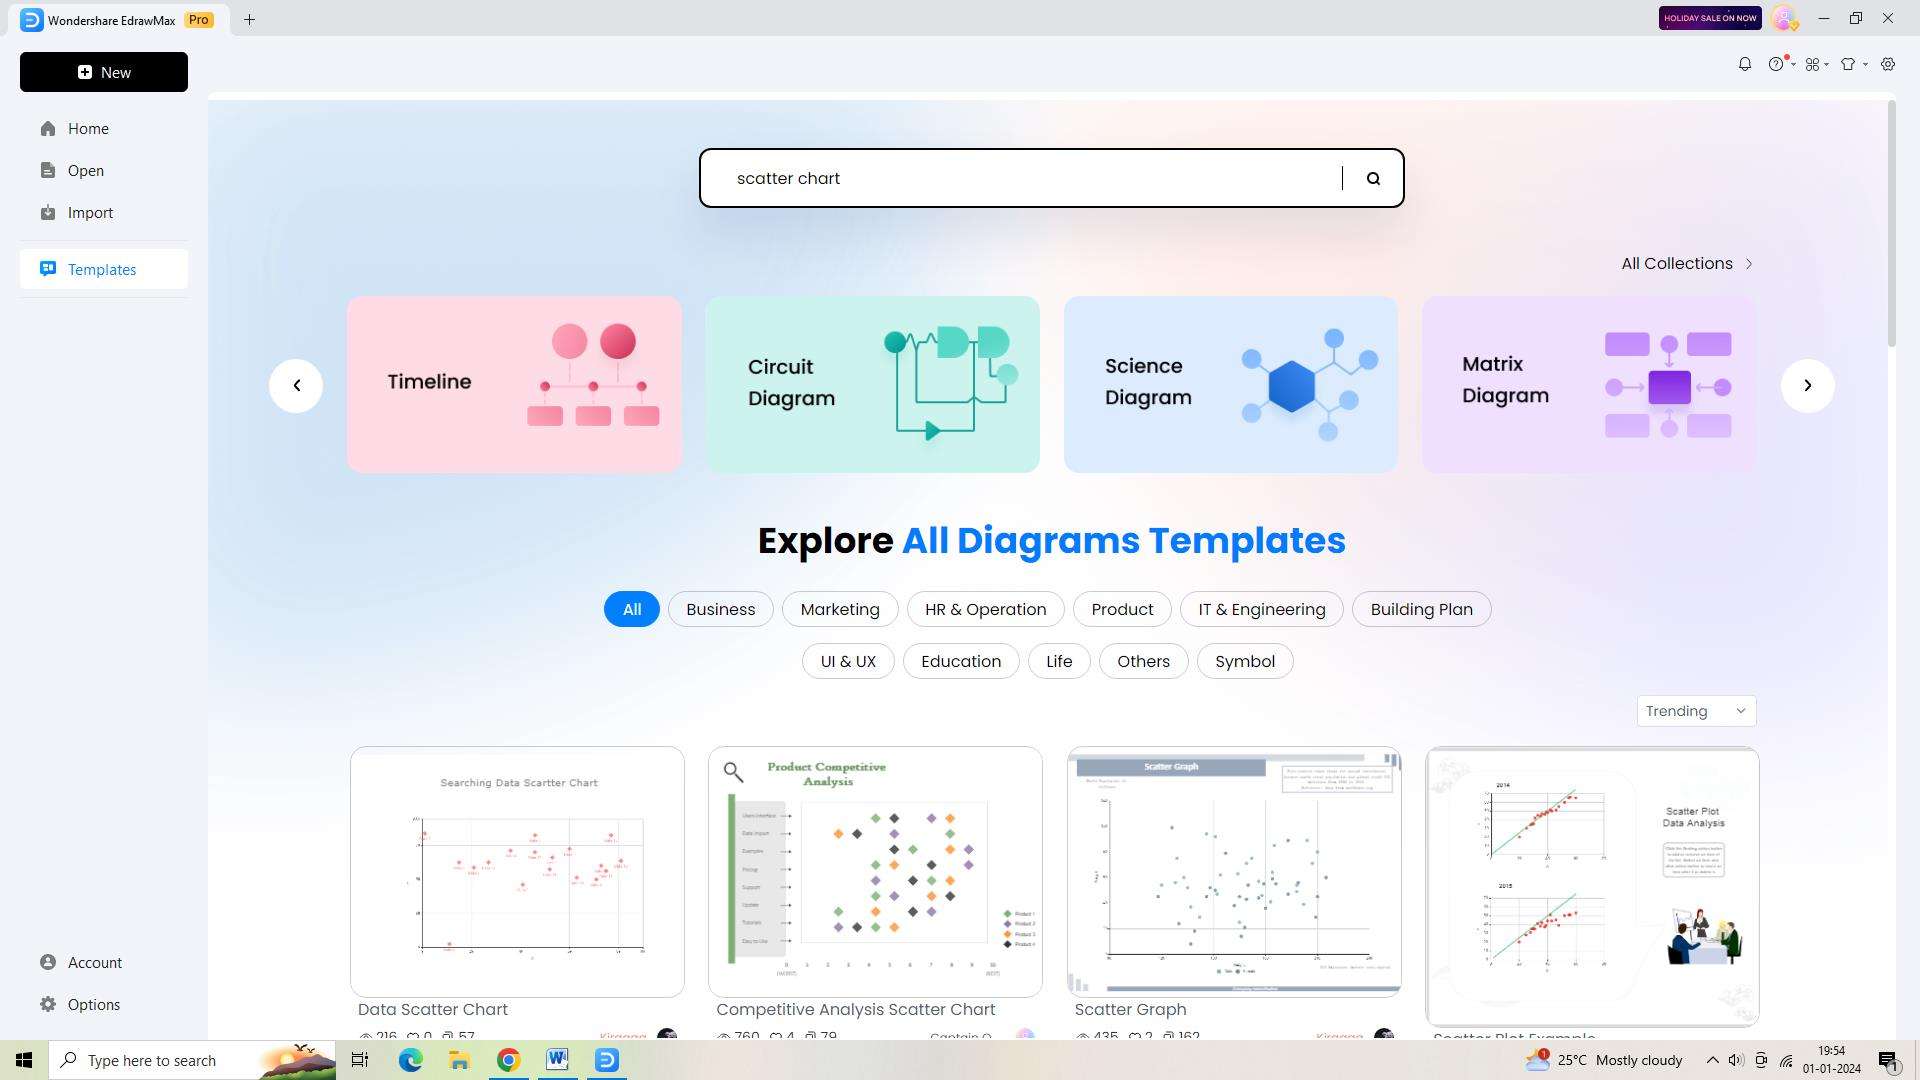
Step 3:
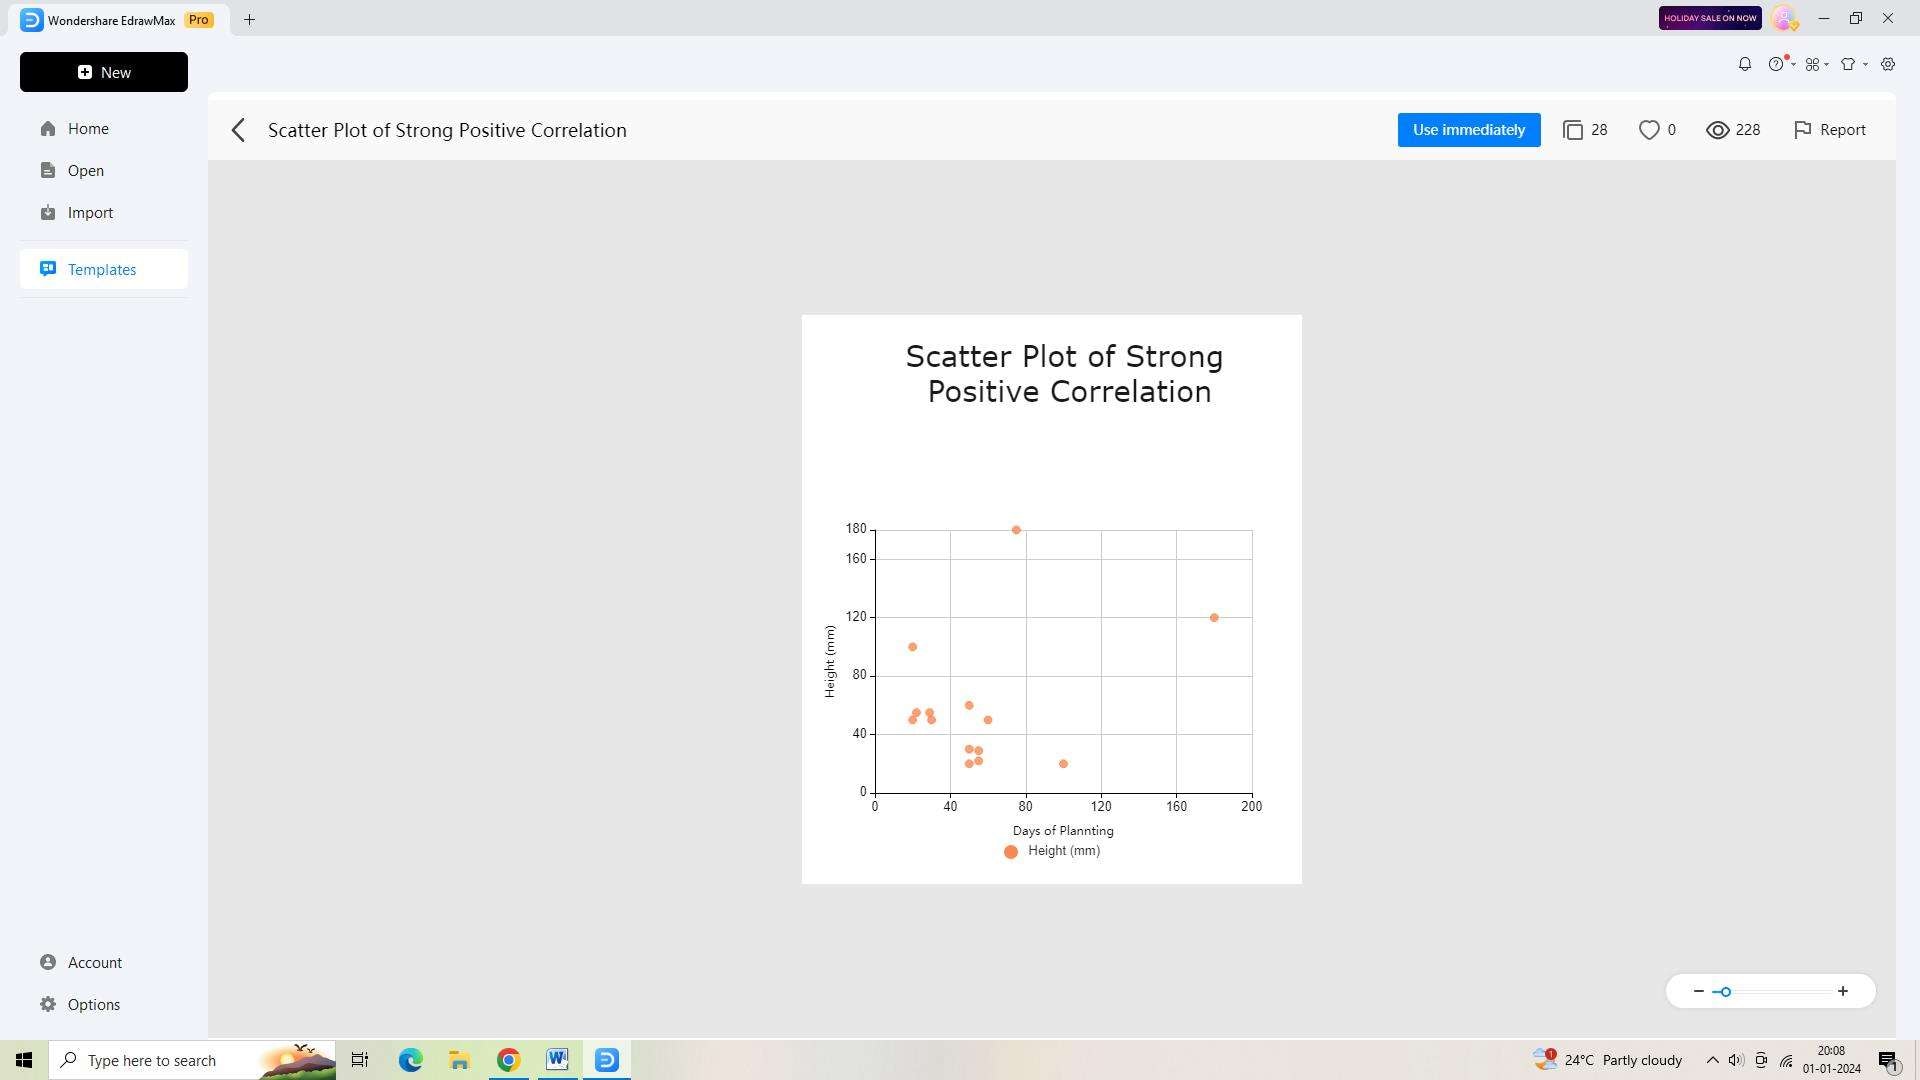
Choose a suitable template from the available options that best suits your scatter chart needs. Each template offers a different layout and visual style.
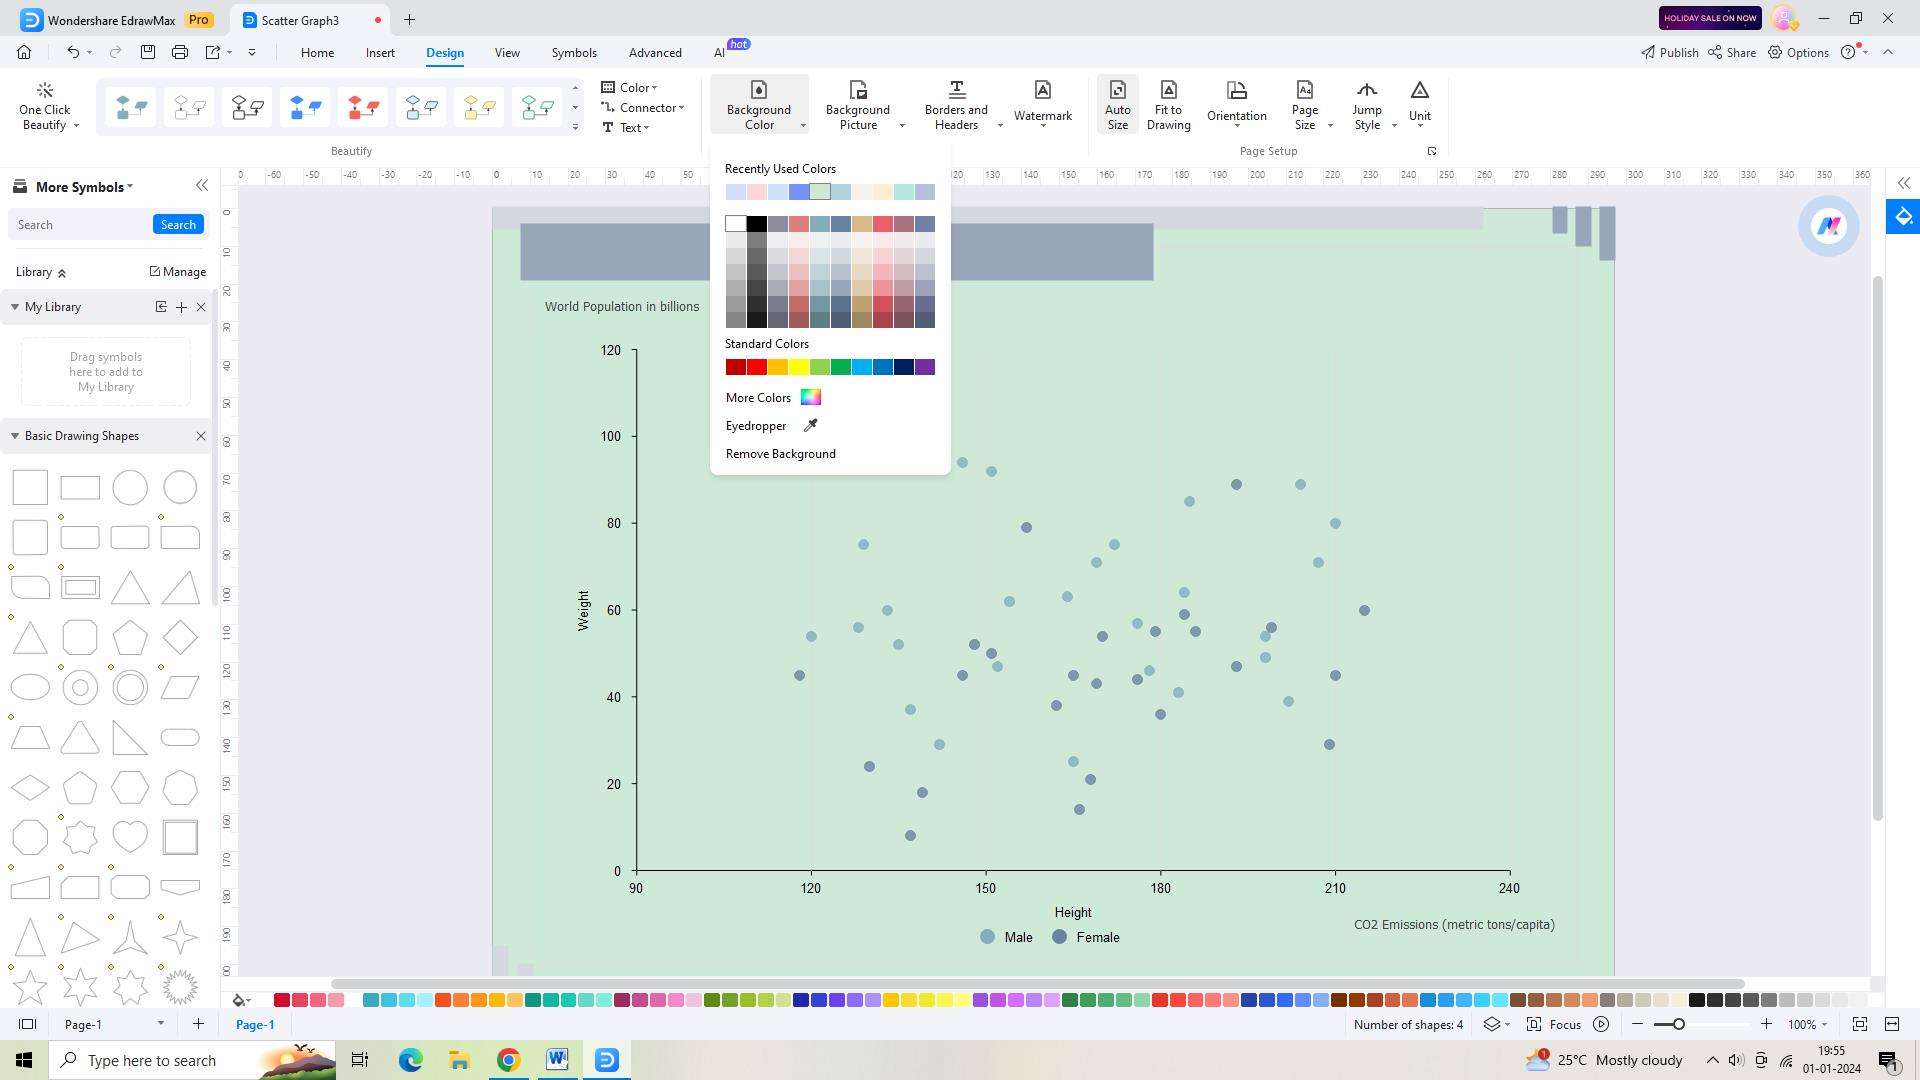
Step 4:
Customize the selected template according to your specific requirements. You can modify elements such as font, color, and more to achieve the desired design for your scatter chart.
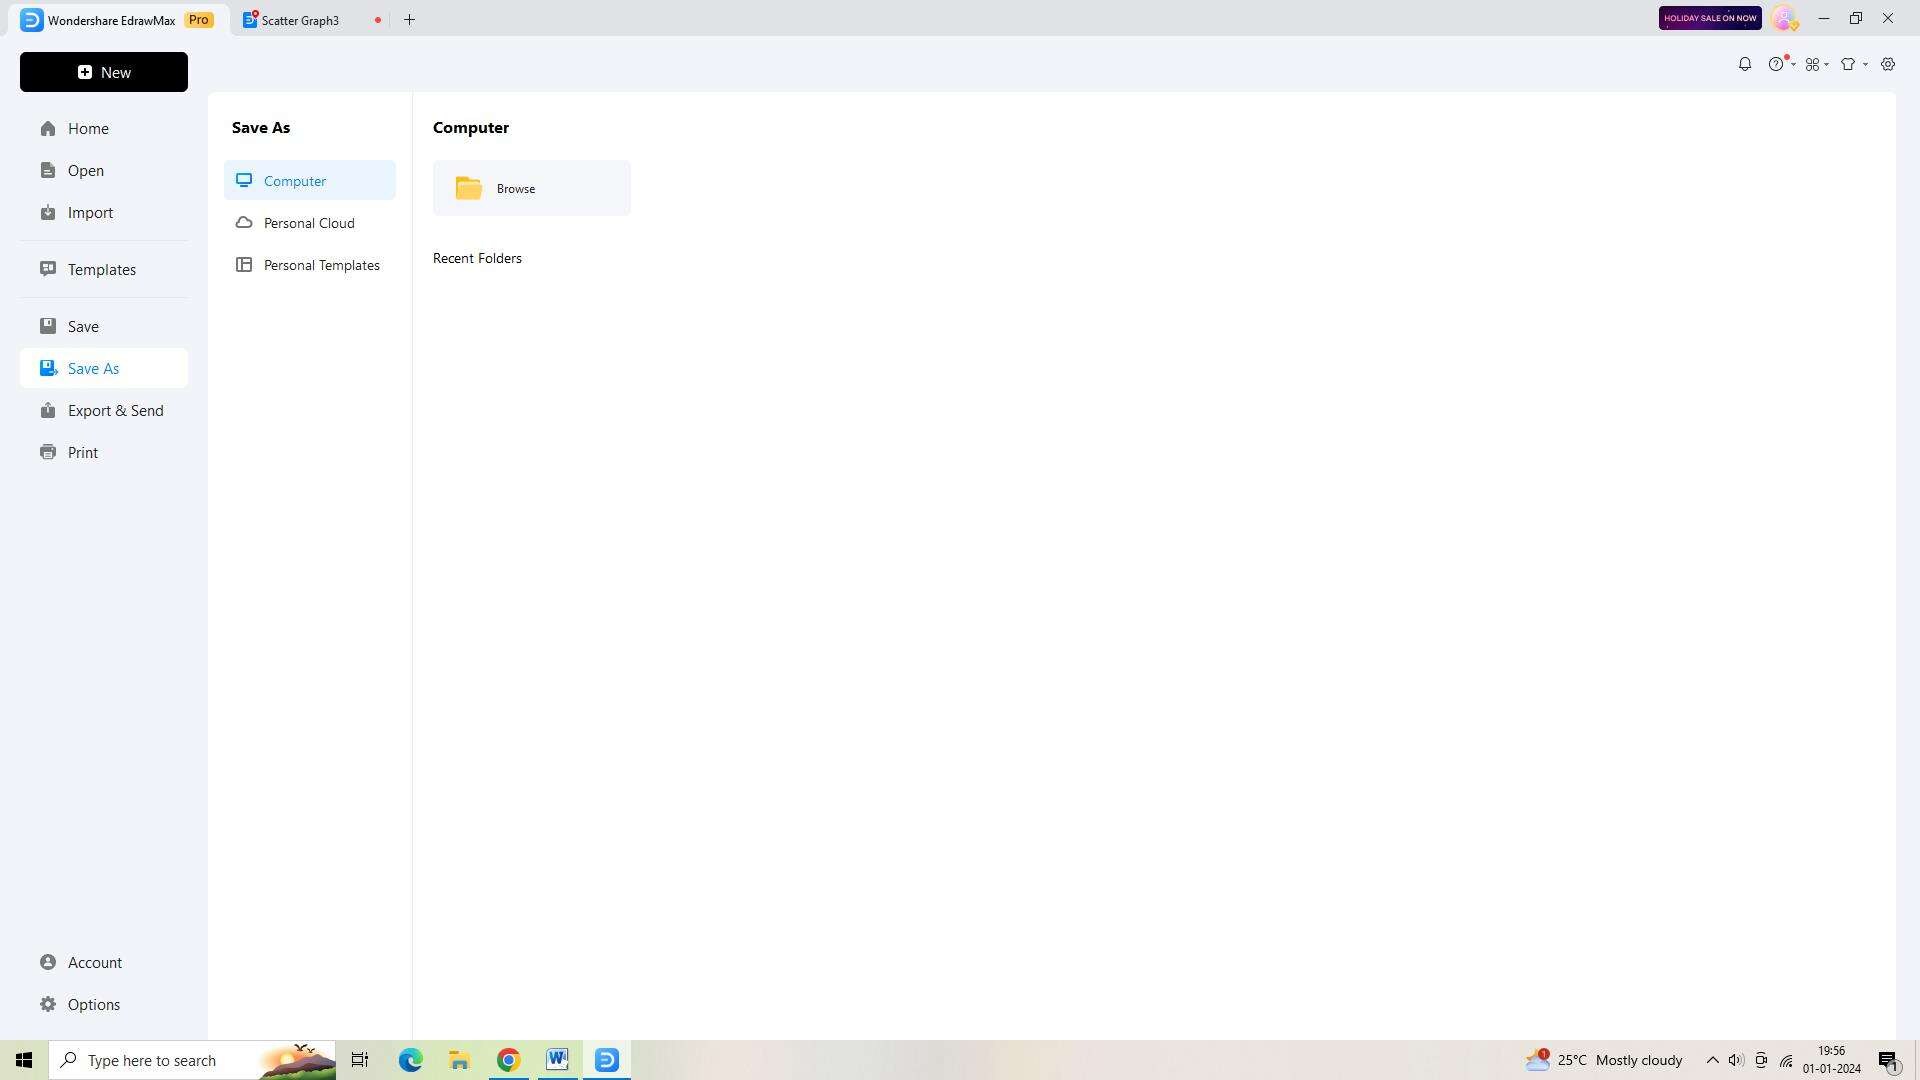
Step 5:
When you are satisfied with the design, save your scatter chart by clicking on "Save As" in the left-side navigation window.
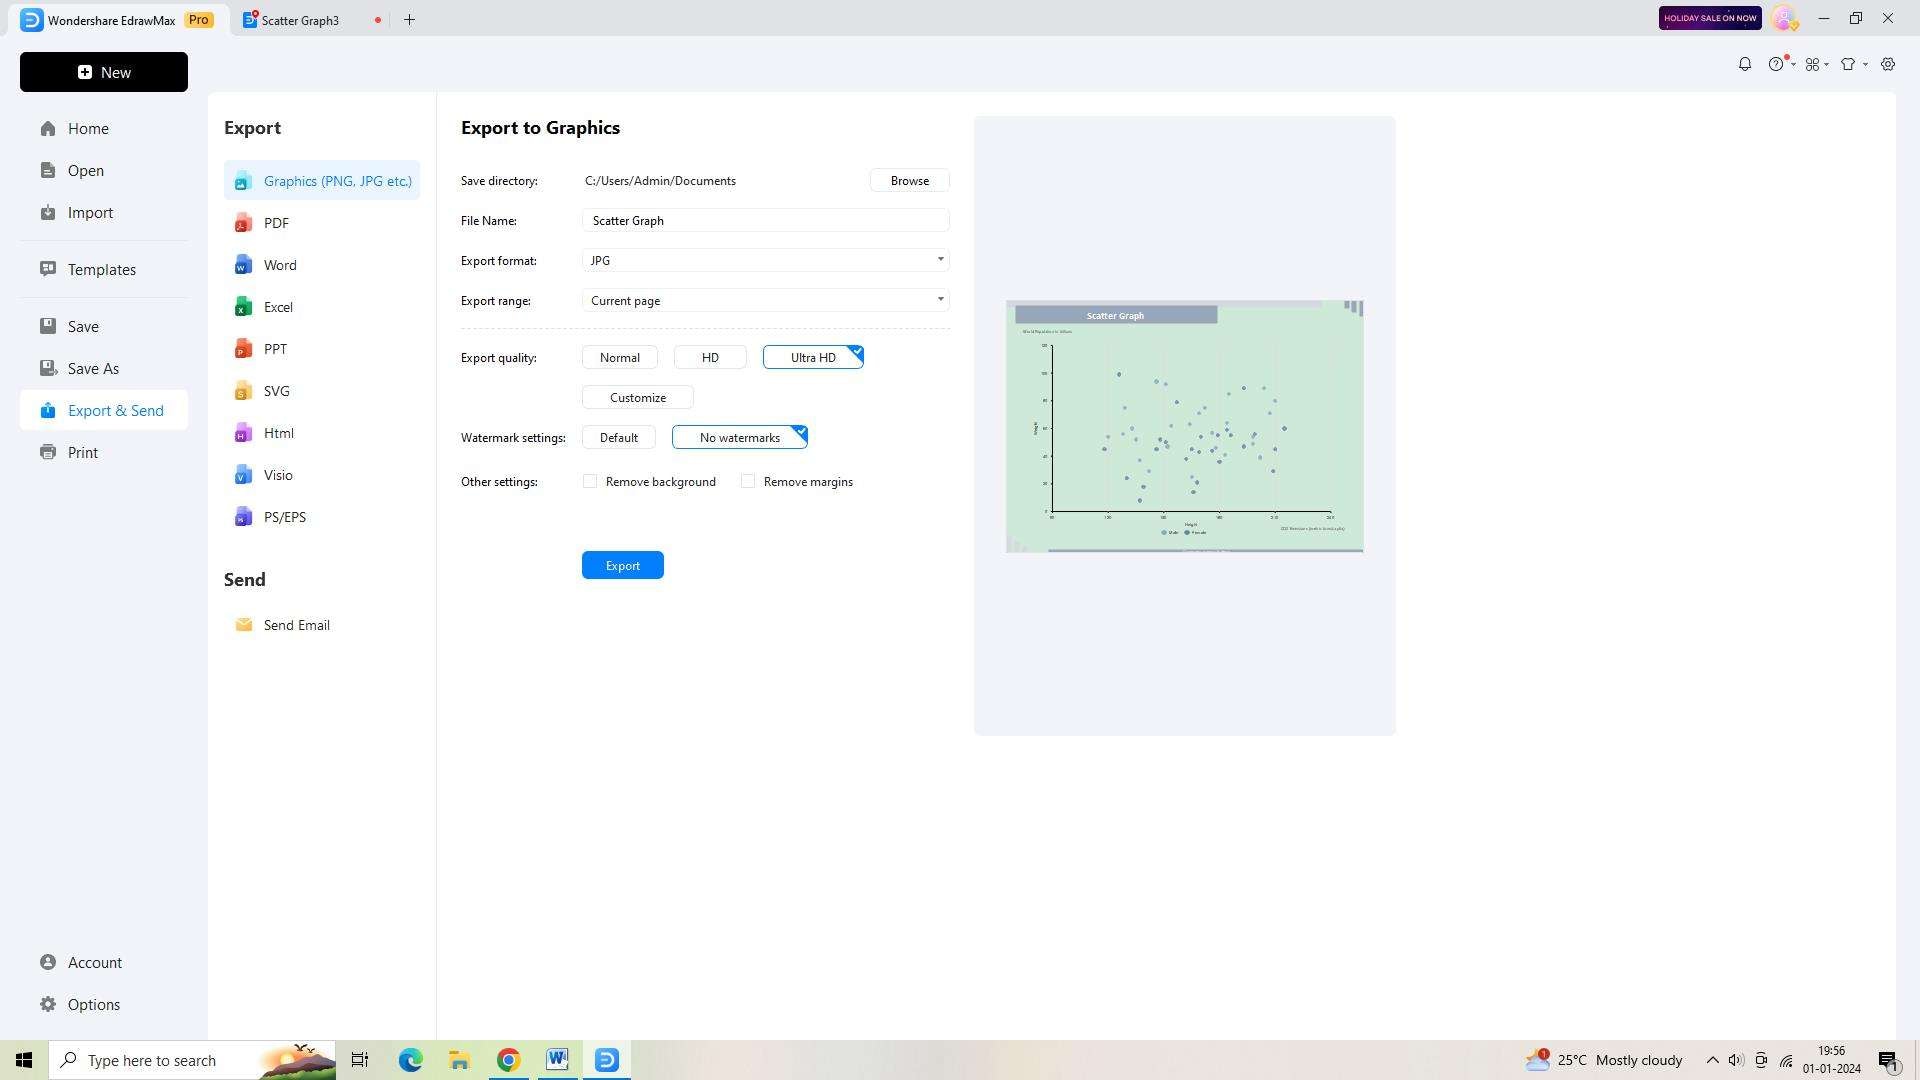
Step 6:
Finally, export your scatter chart by selecting "Export" in the navigation pane on the left and choosing the desired export format.
Conclusion
Creating scatter graphs online offers numerous advantages. When making a scatter chart online, it is important to keep in mind some important considerations. Customizing a scatter diagram is crucial for a variety of reasons. Advanced techniques for analysis in online scatter graphs encompass trend lines, regression analysis, and interactive data filtering.
AI Diagram Generator
Enter your prompt. Upload files if needed. Generate diagrams, charts, or slides instantly.


