Think Bigger From EdrawMax User Guide
How to Create AI Line Charts in EdrawMax Mobile
The AI Line Chart tool allows you to instantly generate a line chart by simply describing your data. It's perfect for showing trends over time or comparing performance. This tool saves you time and effort.
Step ❶ Launch EdrawMax AI Tools
- Open EdrawMax mobile app on your phone
- Log in or register a Wondershare account
- Tap the AI button on the main screen

EdrawMax mobile home screen
Step ❷ Select Line Chart Option
- From the AI tools menu, select Line Chart
- View example prompts for inspiration
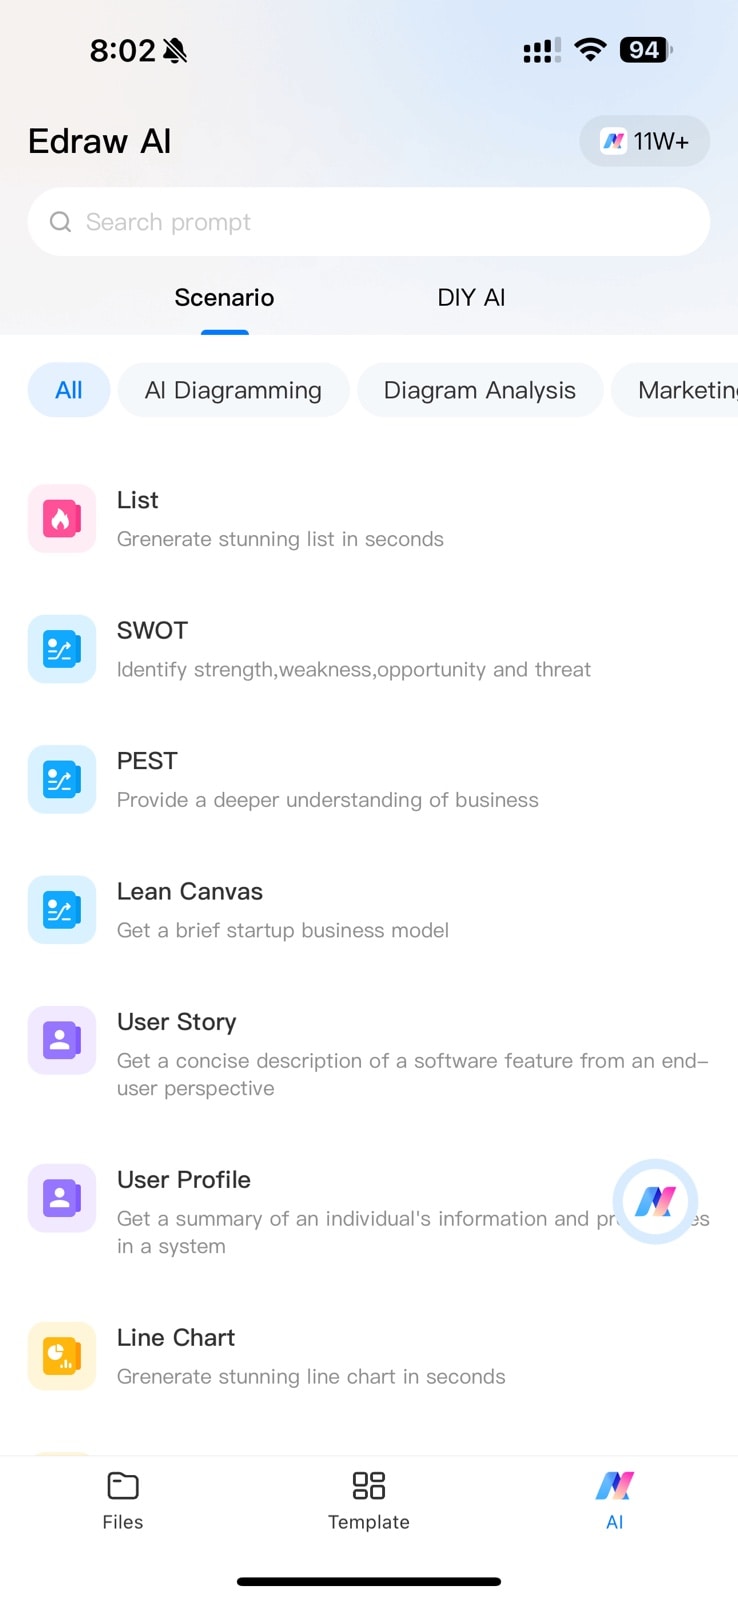
AI chart type selection
Step ❸ Describe Your Chart Data
- Provide a clear description of your data, such as:
- "Monthly sales growth from January to December"
- "Temperature changes by season for 2023"
- Include specific data points if available
- Wait while AI processes your request
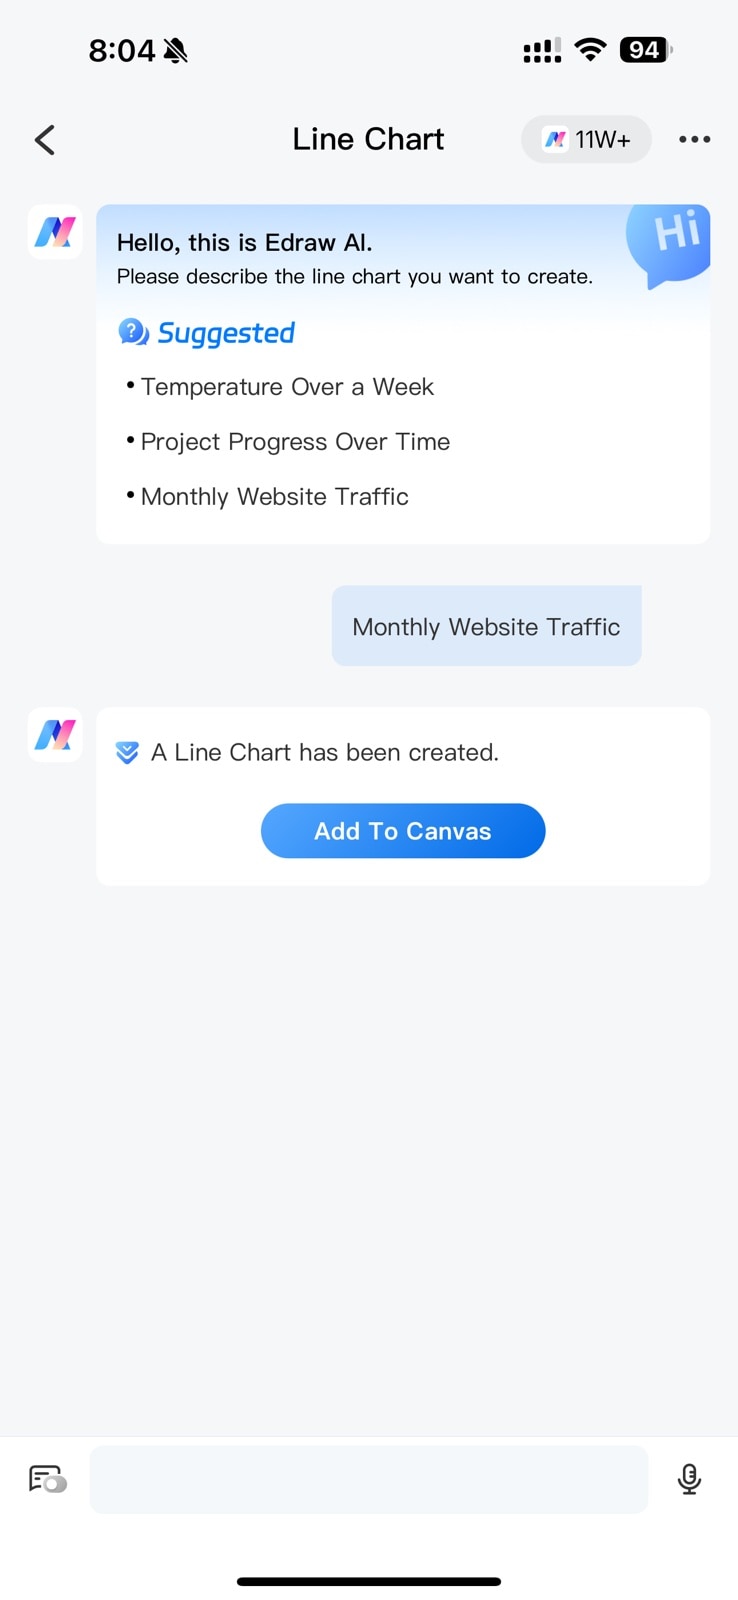
Data input screen with prompt examples
Step ❹ Customize Your Line Chart
- Tap Add To Canvas to generate your chart
- Edit any element of the chart:
- Adjust line colors and styles
- Modify axis labels and titles
- Change data point markers
- Use the formatting tools to enhance visual appeal
- Export or share when finished
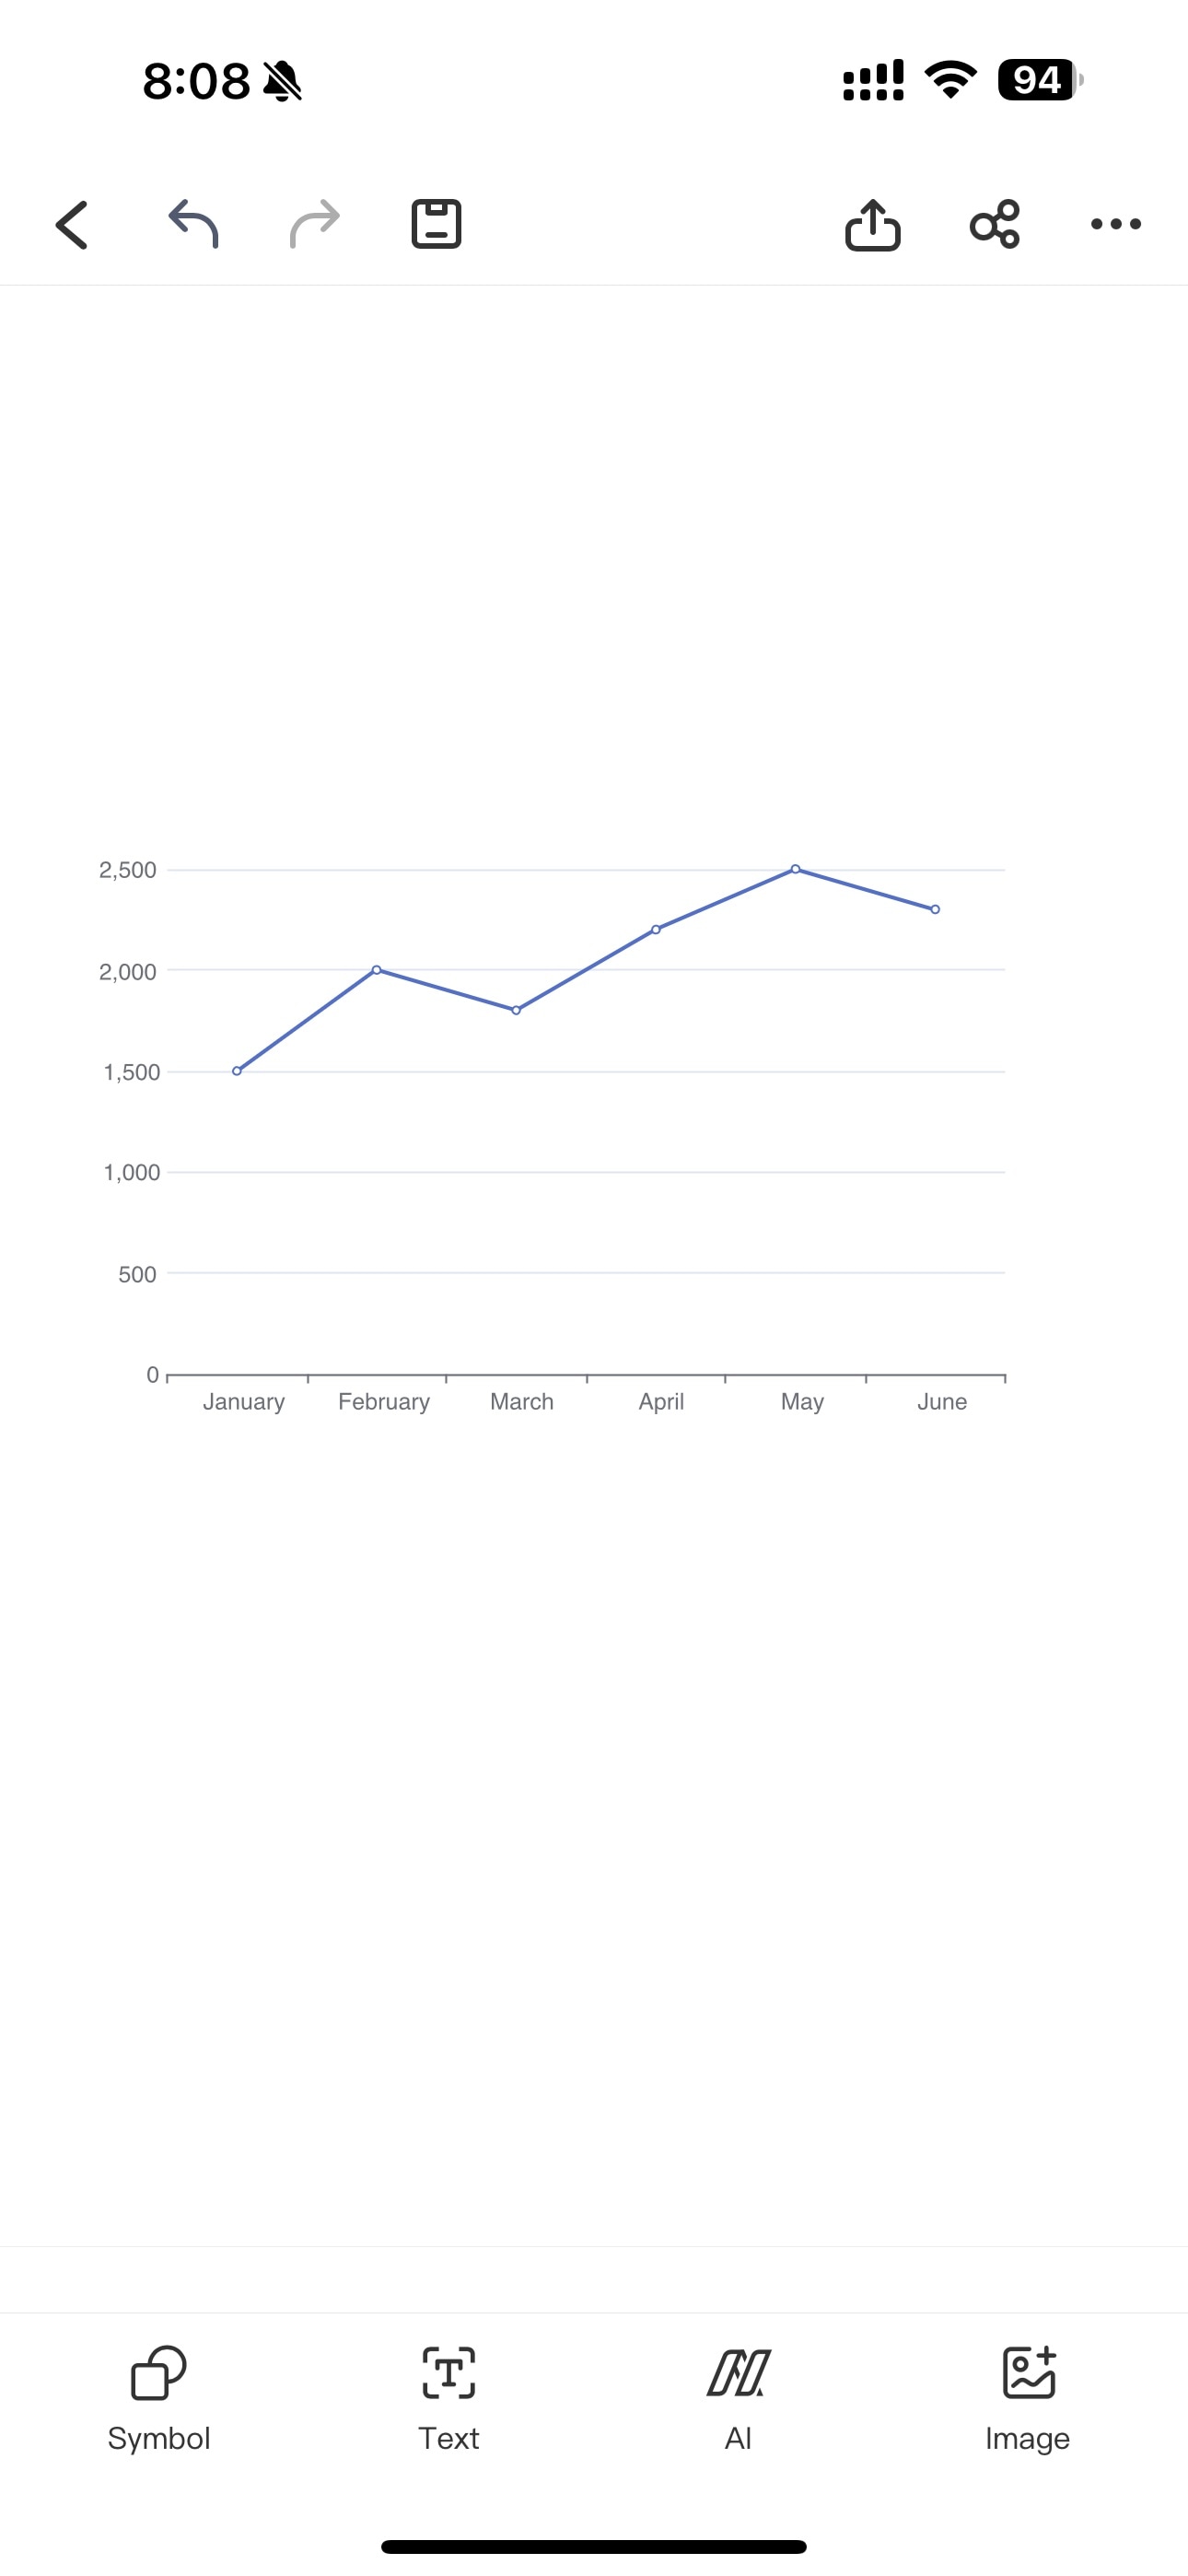
Final AI-generated line chart
Pro Tip:
For best results, structure your description with: [What's being measured] over [time period] with [specific data points if known]. Example: "Website traffic growth from Q1 to Q4 showing 15%, 22%, 35%, and 40% increase respectively."