Organizational charts are crucial for understanding the structure of an organization. They visually represent reporting relationships, lines of communication, and levels of authority within a company. There are different types of organizational charts, including hierarchical, matrix, and flat charts. To make these charts more visually appealing and engaging, various techniques can be used. This article will discuss organizational charts in detail and also teach you how to create an effective company org chart.
Contents of this article
Part 1. Types of Organizational Charts
When it comes to visualizing the structure of an organization, there are numerous types of org charts to choose from. These charts provide a clear representation of the formal reporting relationships, lines of communication, and levels of authority within a company.
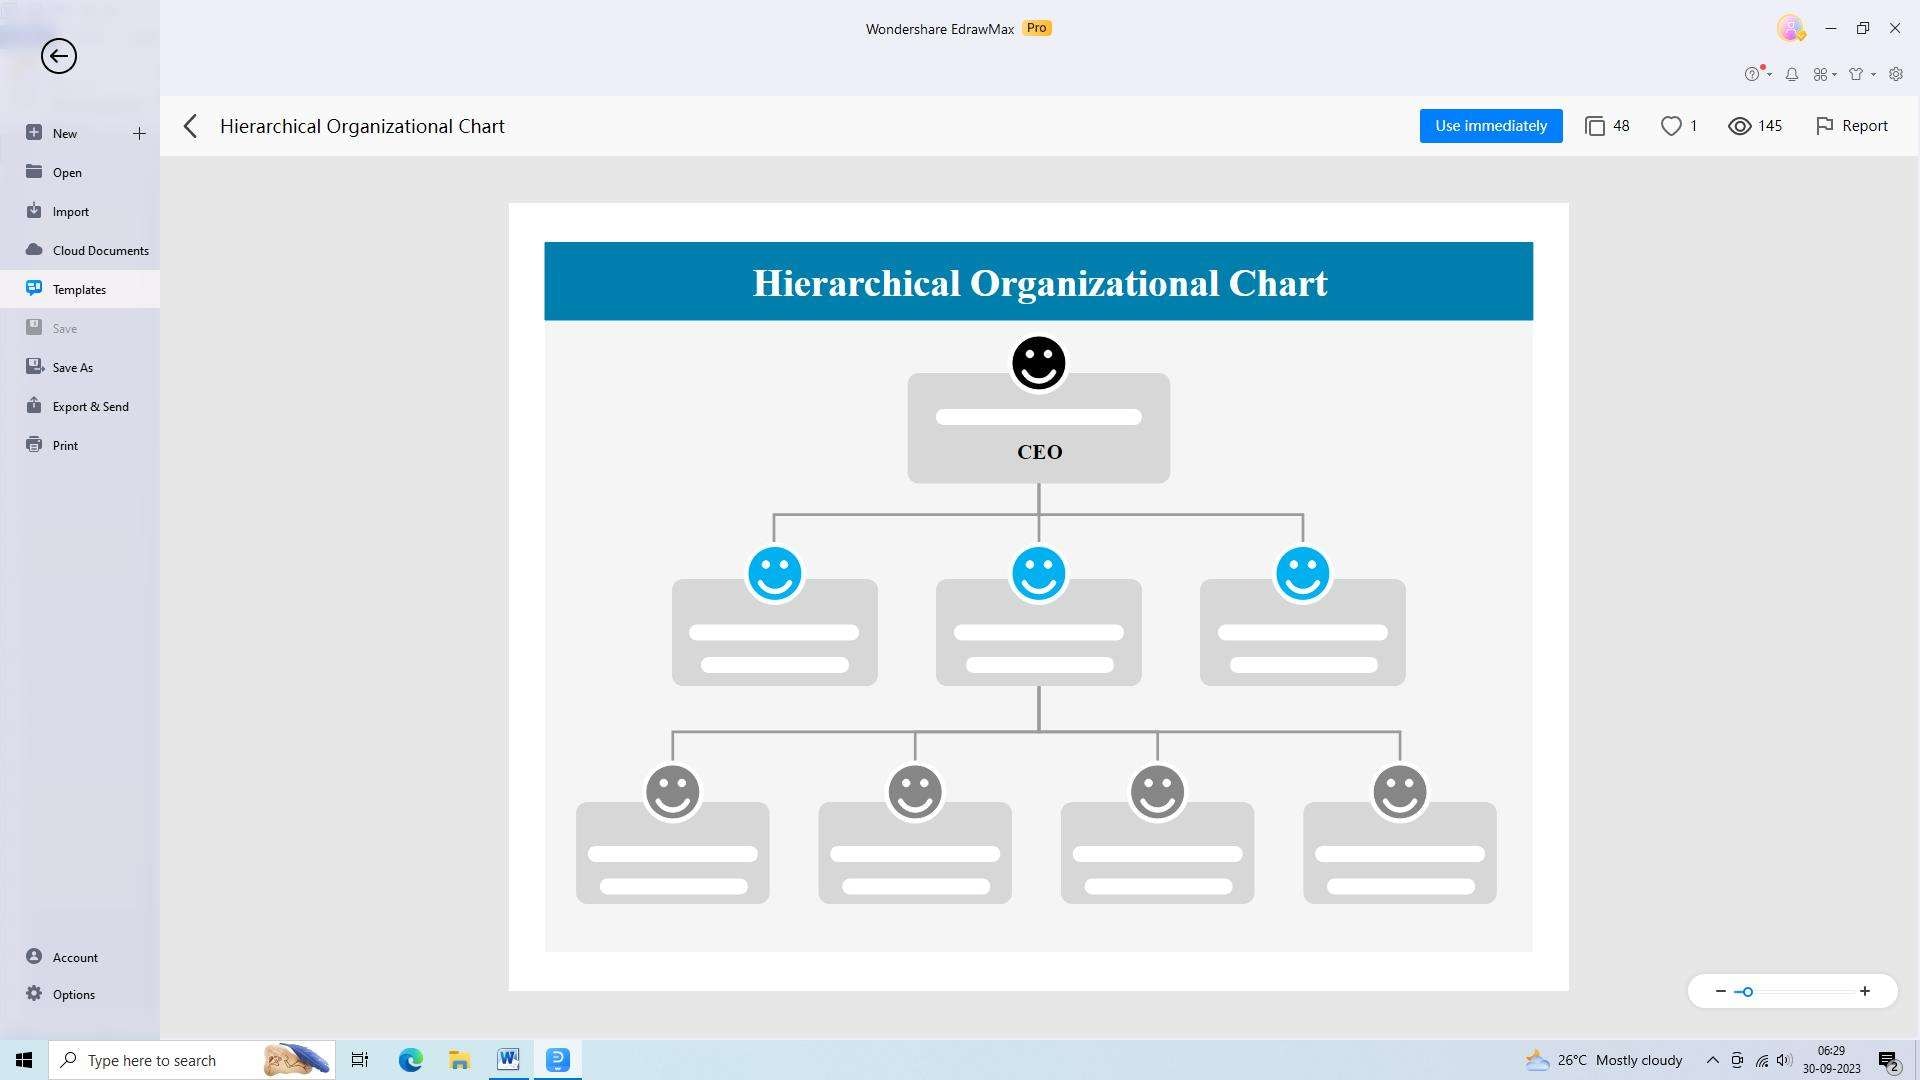
- Hierarchical Org Chart
This organizational chart is one of the most commonly used models across various organizations. Primarily, an organizational hierarchy chart outlines the formal reporting relationships, typically represented by vertical lines and boxes.
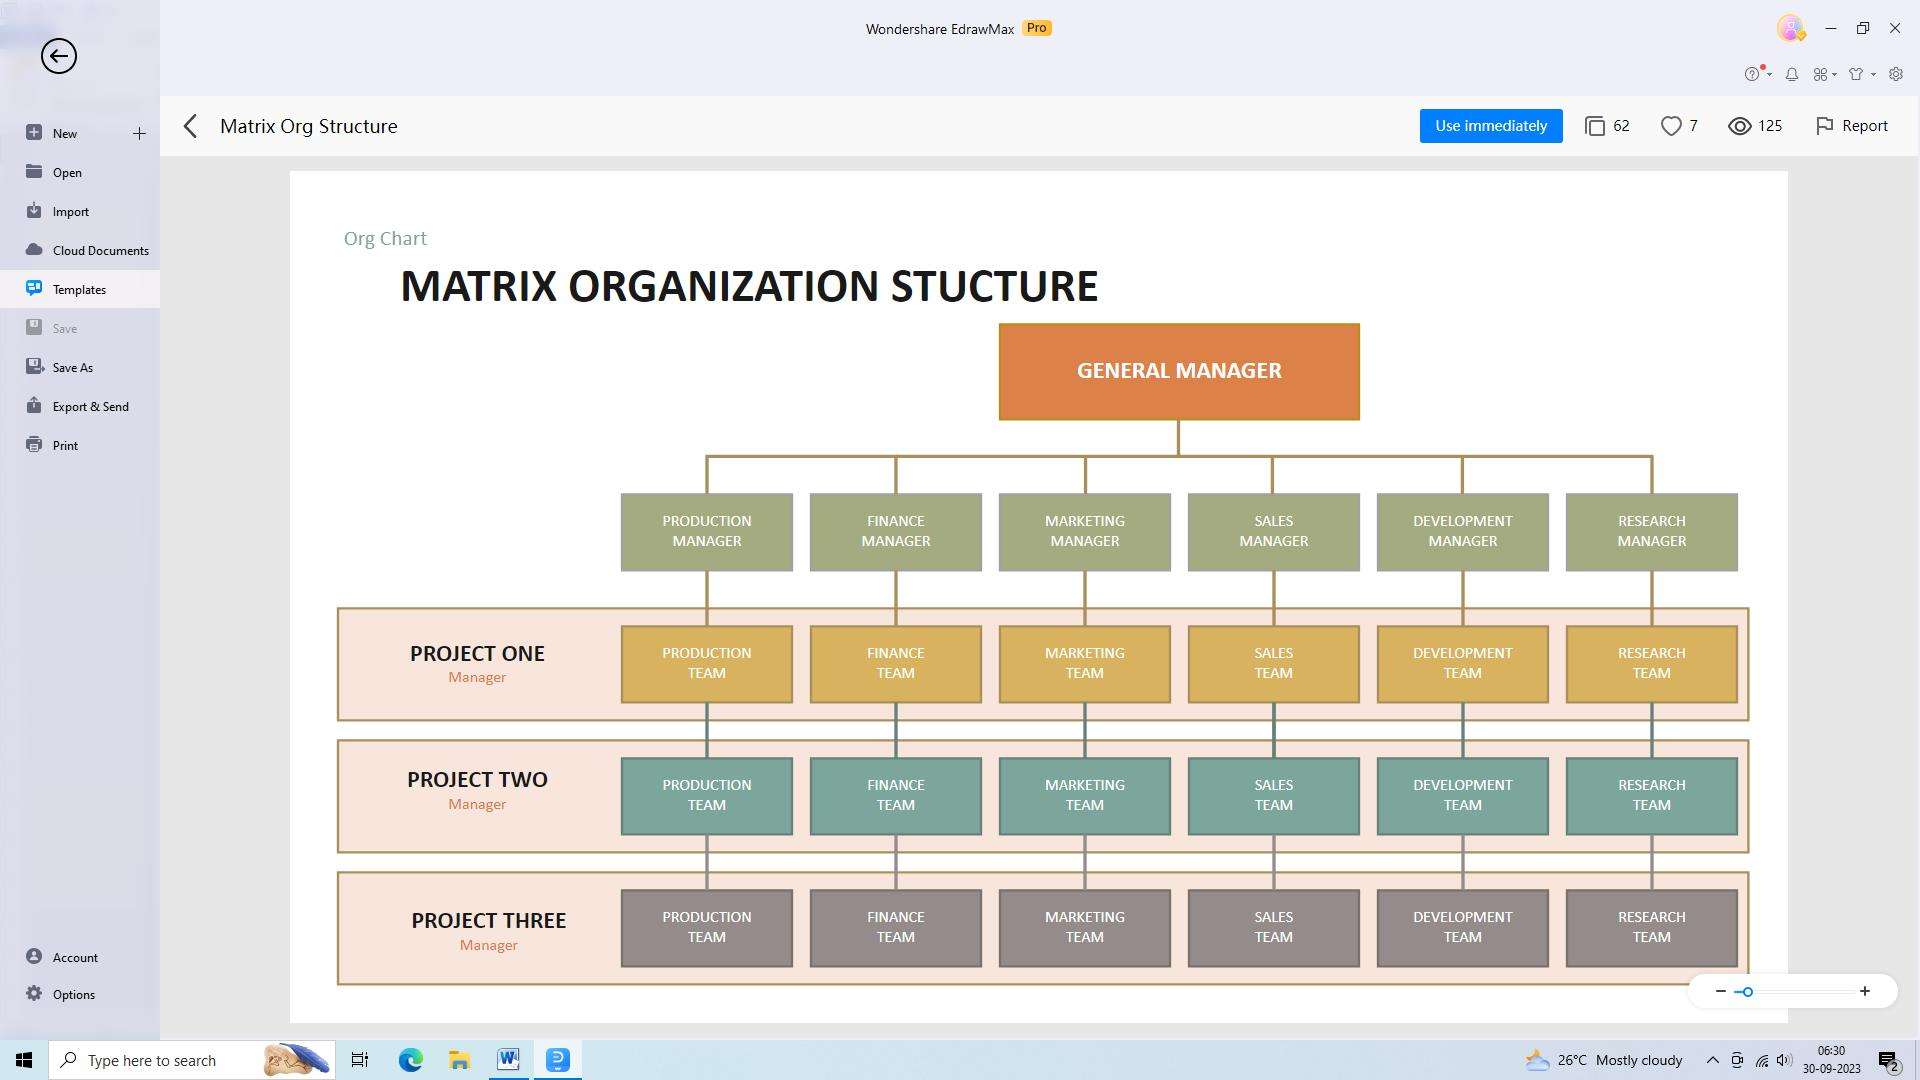
- Matrix Org Chart
The matrix organizational chart is particularly useful for organizations with complex projects or cross-functional teams. Unlike the traditional hierarchical chart, the matrix chart exhibits both vertical and horizontal reporting relationships. It illustrates the overlapping responsibilities and lines of communication between different departments or functional areas.
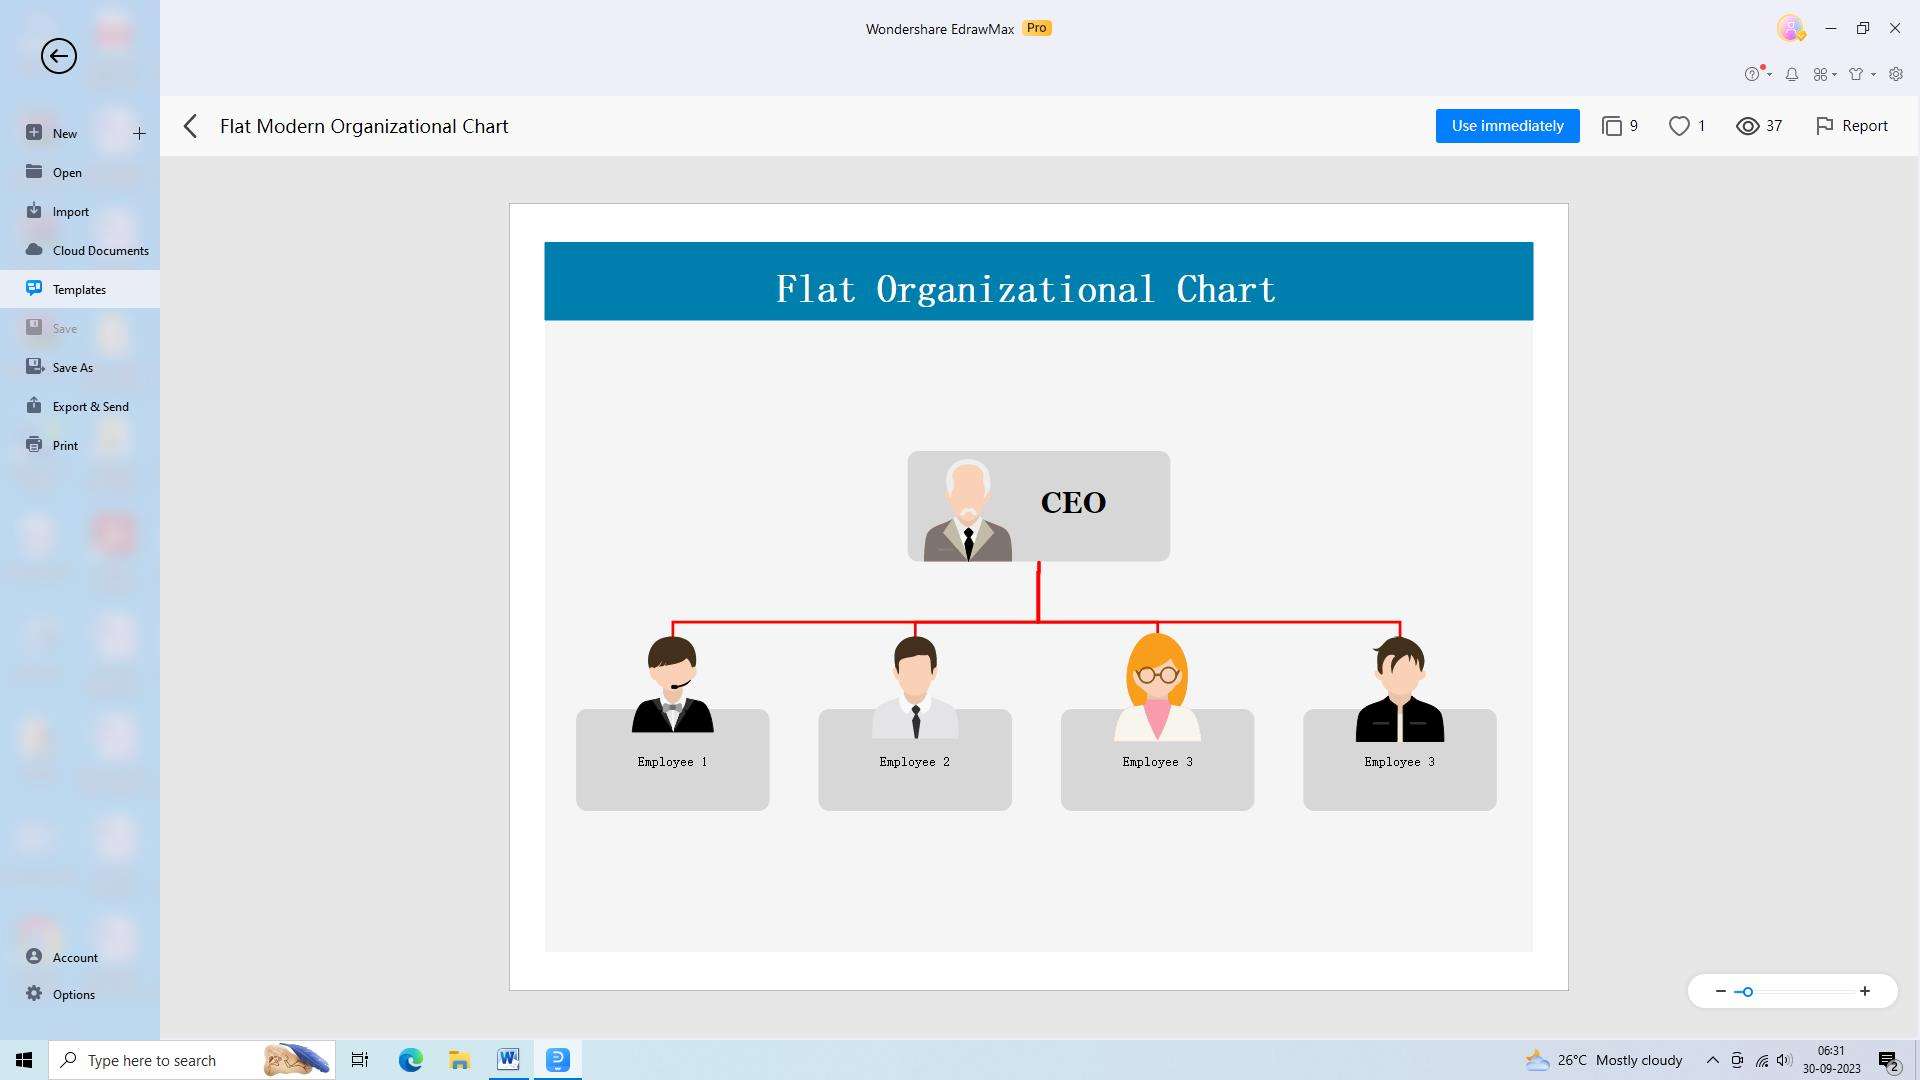
- Flat Org Chart
The flat organizational chart, also known as a horizontal org chart, showcases a more decentralized structure. Contrary to the hierarchical chart, the flat chart minimizes hierarchical layers and emphasizes collaboration, empowerment, and employee involvement.
Part 2. How to Get More Visual with Organizational Charts?
For creating an organizational structure chart, there are various visual elements and techniques that can be employed to enhance its effectiveness and impact. Implementing these can make an organizational chart easier to understand and connect with.
- Using Photos
Incorporating photographs in an organizational chart adds a human touch by assigning faces to names. This is particularly useful in large organizations where employees may not be familiar with everyone across different departments. It fosters a sense of connection and makes the chart more relatable and engaging.
- Using Different Shapes and/or Colors
Utilizing various shapes and colors can significantly enhance visual appeal and aid comprehension. For instance, squares may represent managerial positions, circles may represent team members, and triangles may signify temporary or advisory roles. Assigning specific colors to different departments or functions can provide visual cues for easier identification.
- Using Company Logos or Icons
Integrating company logos or icons in the company organizational chart lends a sense of brand identity and reinforces the visual representation of the organization. Logos can be strategically placed within the chart to represent each department, promoting a sense of unity and pride.
- Using Animations in PowerPoint
PowerPoint presentations offer dynamic ways to present organizational charts. Employing animations can bring organizational charts to life, making them more engaging and memorable.
- Using 3D Shapes
Introducing three-dimensional shapes can add depth and visual appeal to organizational charts. The utilization of three dimensions provides a realistic representation, making the chart visually striking.
Part 3. How to Plan and Draw a Basic Organizational Chart?
Making an effective company org chart requires careful consideration and planning. With proper planning, one can create an organizational chart that serves its purpose to the fullest potential.
- Define Your Purpose and Scope
Before embarking on the organizational chart creation journey, it is crucial to define the purpose and scope of the chart. Consider the objectives you wish to achieve through visual representation. Are you seeking to showcase the reporting hierarchy, depict interdepartmental relationships, or identify key stakeholders? Clearly defining these elements will act as a guiding force throughout the chart-building process.
- Gather the Information
A successful organizational chart relies on accurate and up-to-date information. Begin by collecting relevant data such as employee names, positions, and reporting lines. Engage with team members, supervisors, and stakeholders to ensure that the information you gather is comprehensive and precise.
- Determine What Platform You Plan to Use to Build Your Chart, and How You Plan to Display It
Once armed with the necessary data, the next step is to choose a suitable platform and determine how you plan to display your organizational chart. You can use an online tool to create organizational charts.
- Plan for Ongoing Updates to the Chart
A company organizational structure chart is a living document that should evolve as your organization grows and changes. It is crucial to plan for ongoing updates to the chart to maintain its relevance and effectiveness.
Part 4. How to Make an Org Chart with Edrawmax?
Creating a company organizational chart does not involve much difficulty if you use an efficient tool.Wondershare EdrawMax is the best tool out there for creating organizational charts. The tool has exceptional features that make it easy to create effective organizational charts. Here are the steps to create an organizational chart using the tool:
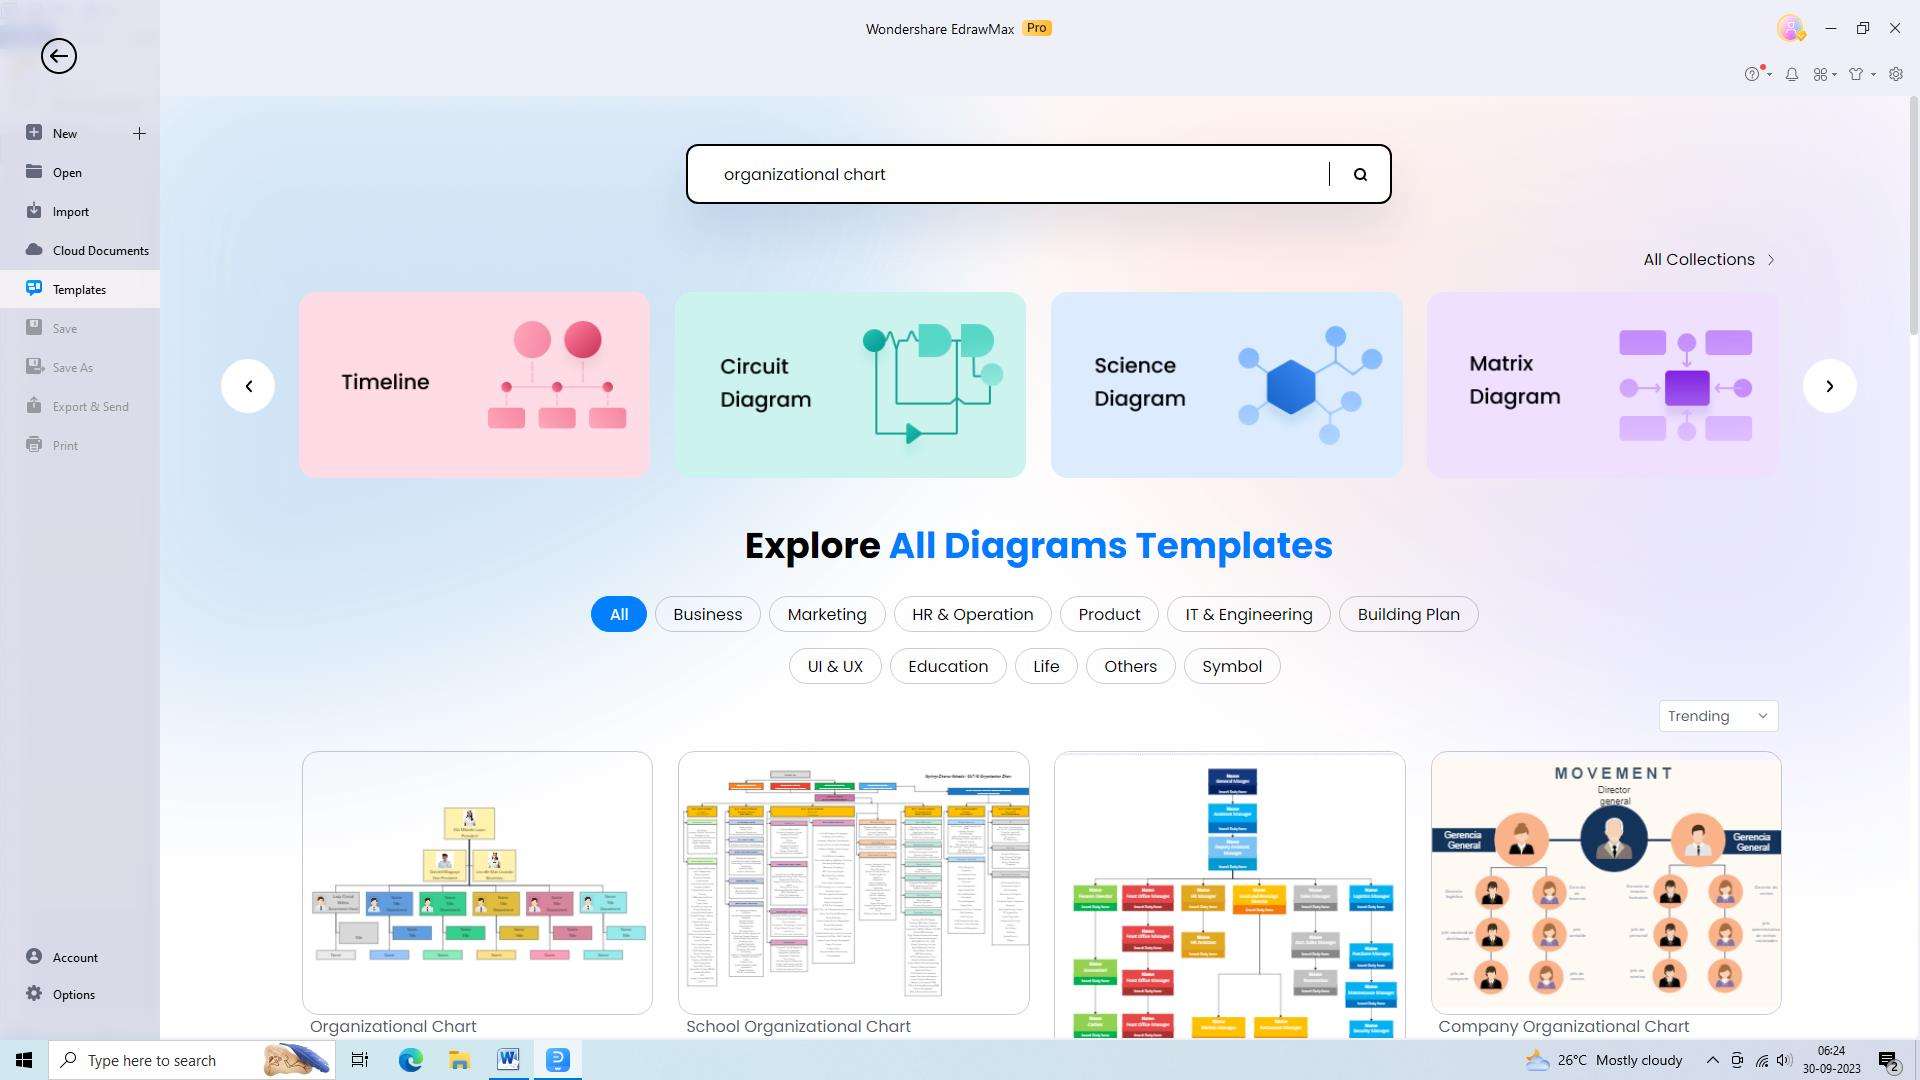
Step 1: Start with a Template
The first step is to start with a template. There are several pre-made organizational chart templates available in EdrawMax. All you need to do is select the template that best fits your needs and customize it to suit your company's structure.
Step 2: Add Structure Elements
The next step is to add the structural elements. This includes adding the company's name, departments, positions, and other details to the company org chart. You can also add pictures of employees to make the chart more visually appealing.
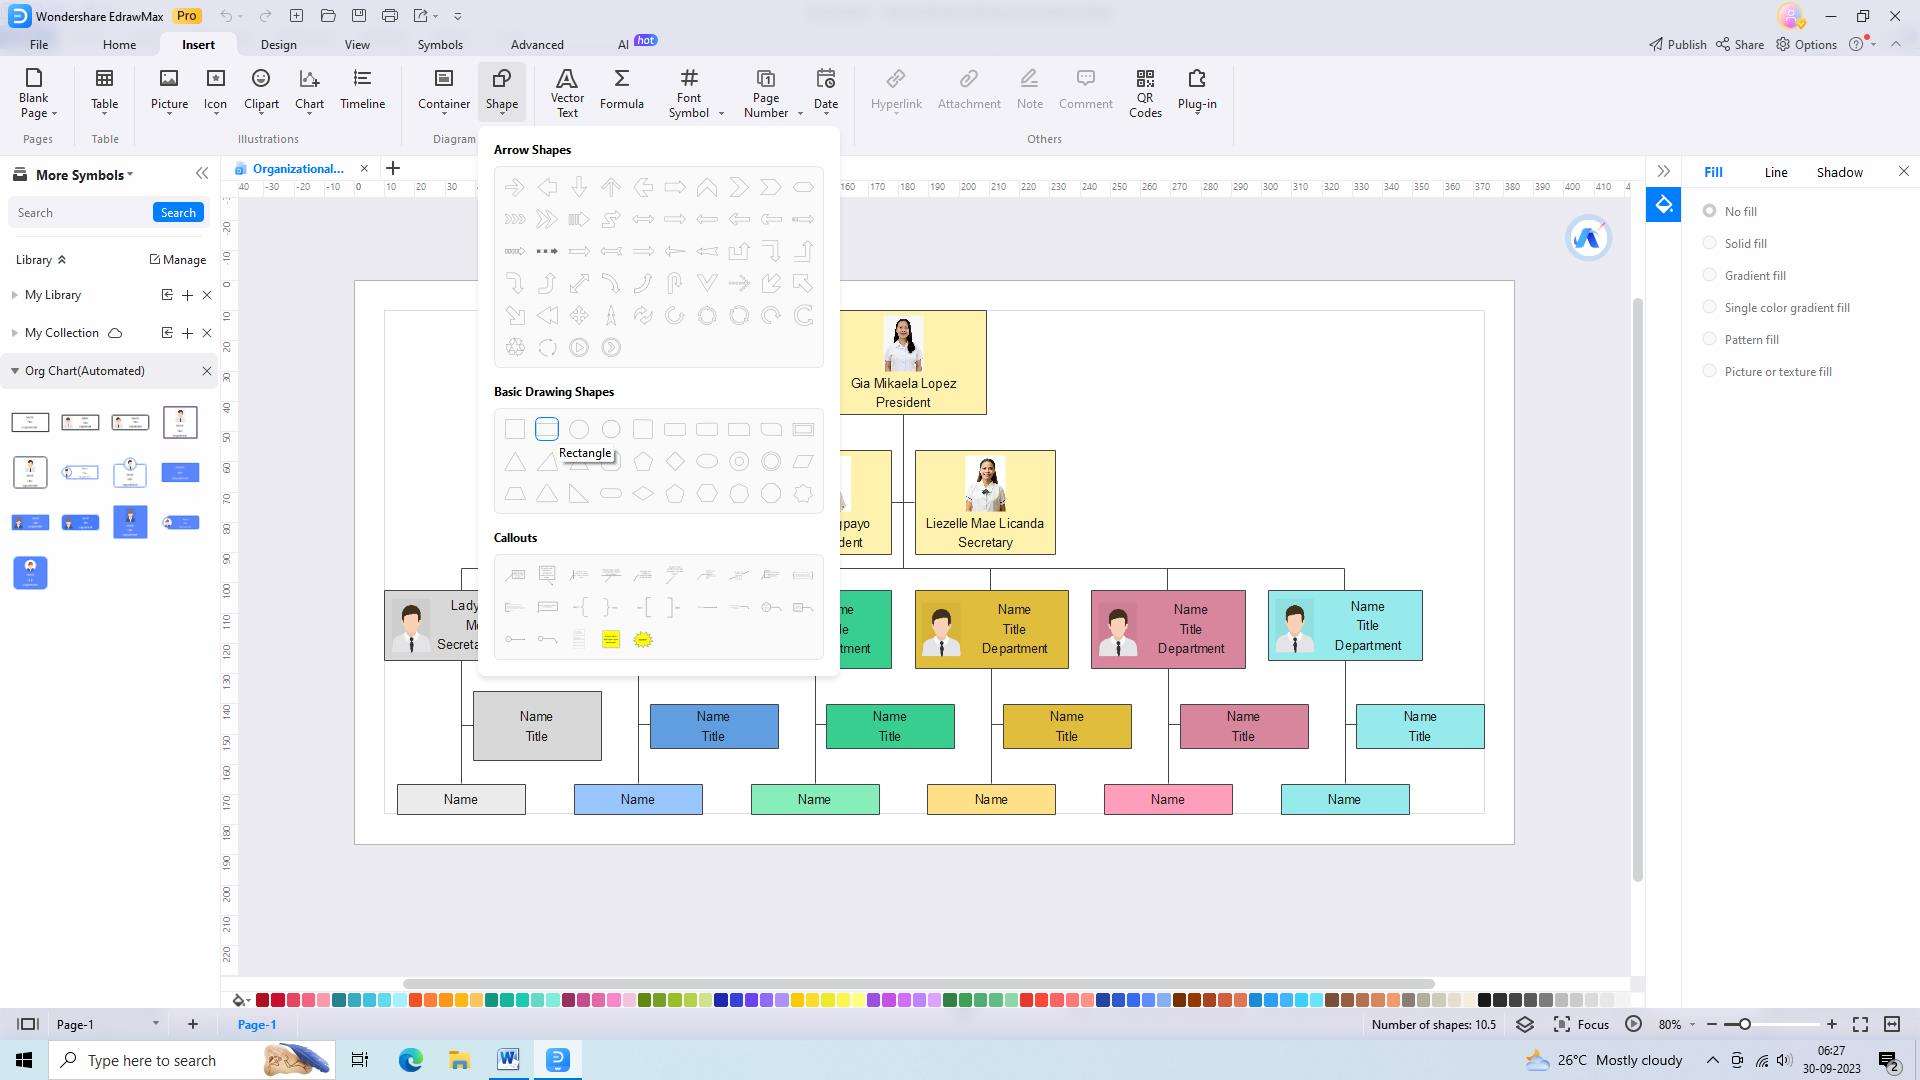
Step 3: Add Connectors
Once the structural elements have been added, you can add connectors to show the relationships between different elements. This helps to show how the different parts of the organization are connected and how they work together.
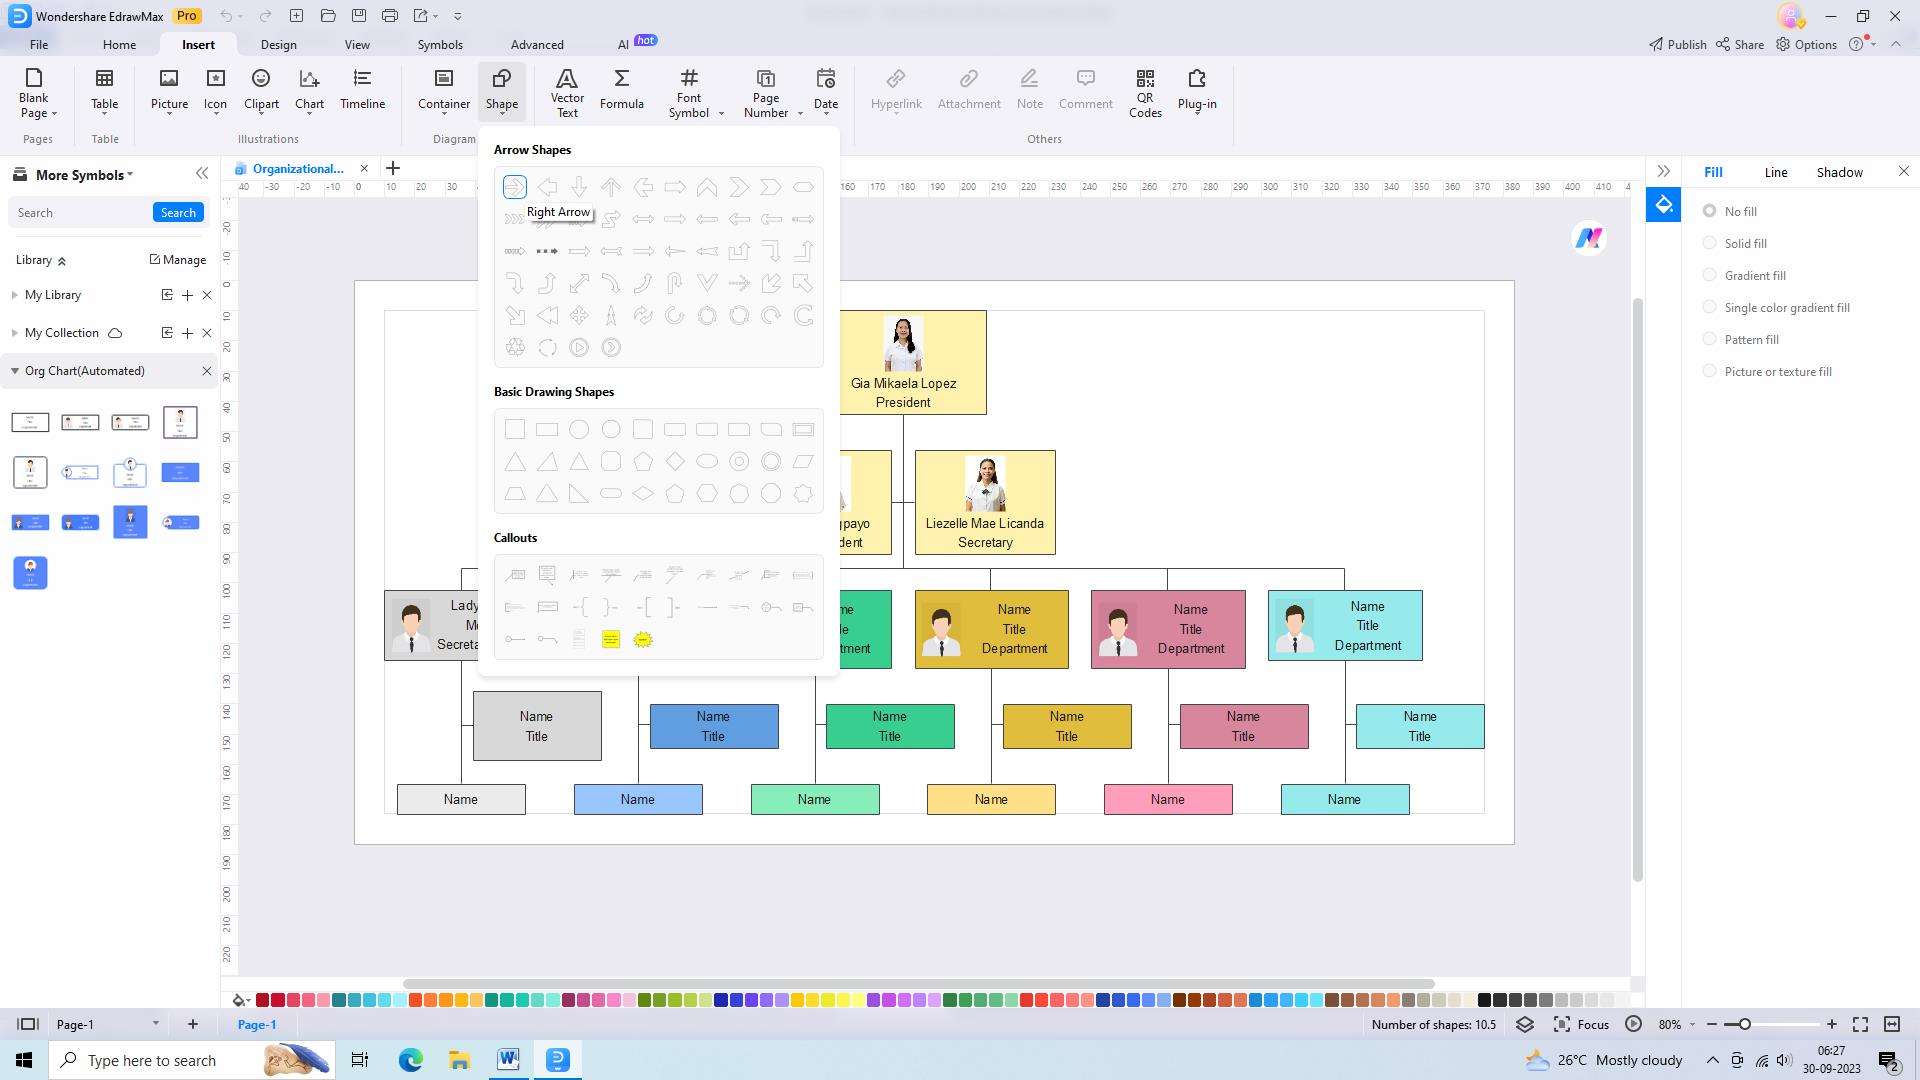
Step 4: Customize the Chart
The last step is to customize the chart. You can add colors, borders, and other design elements to make the chart more visually appealing. You can also add text, symbols, and other elements to make the chart more informative.
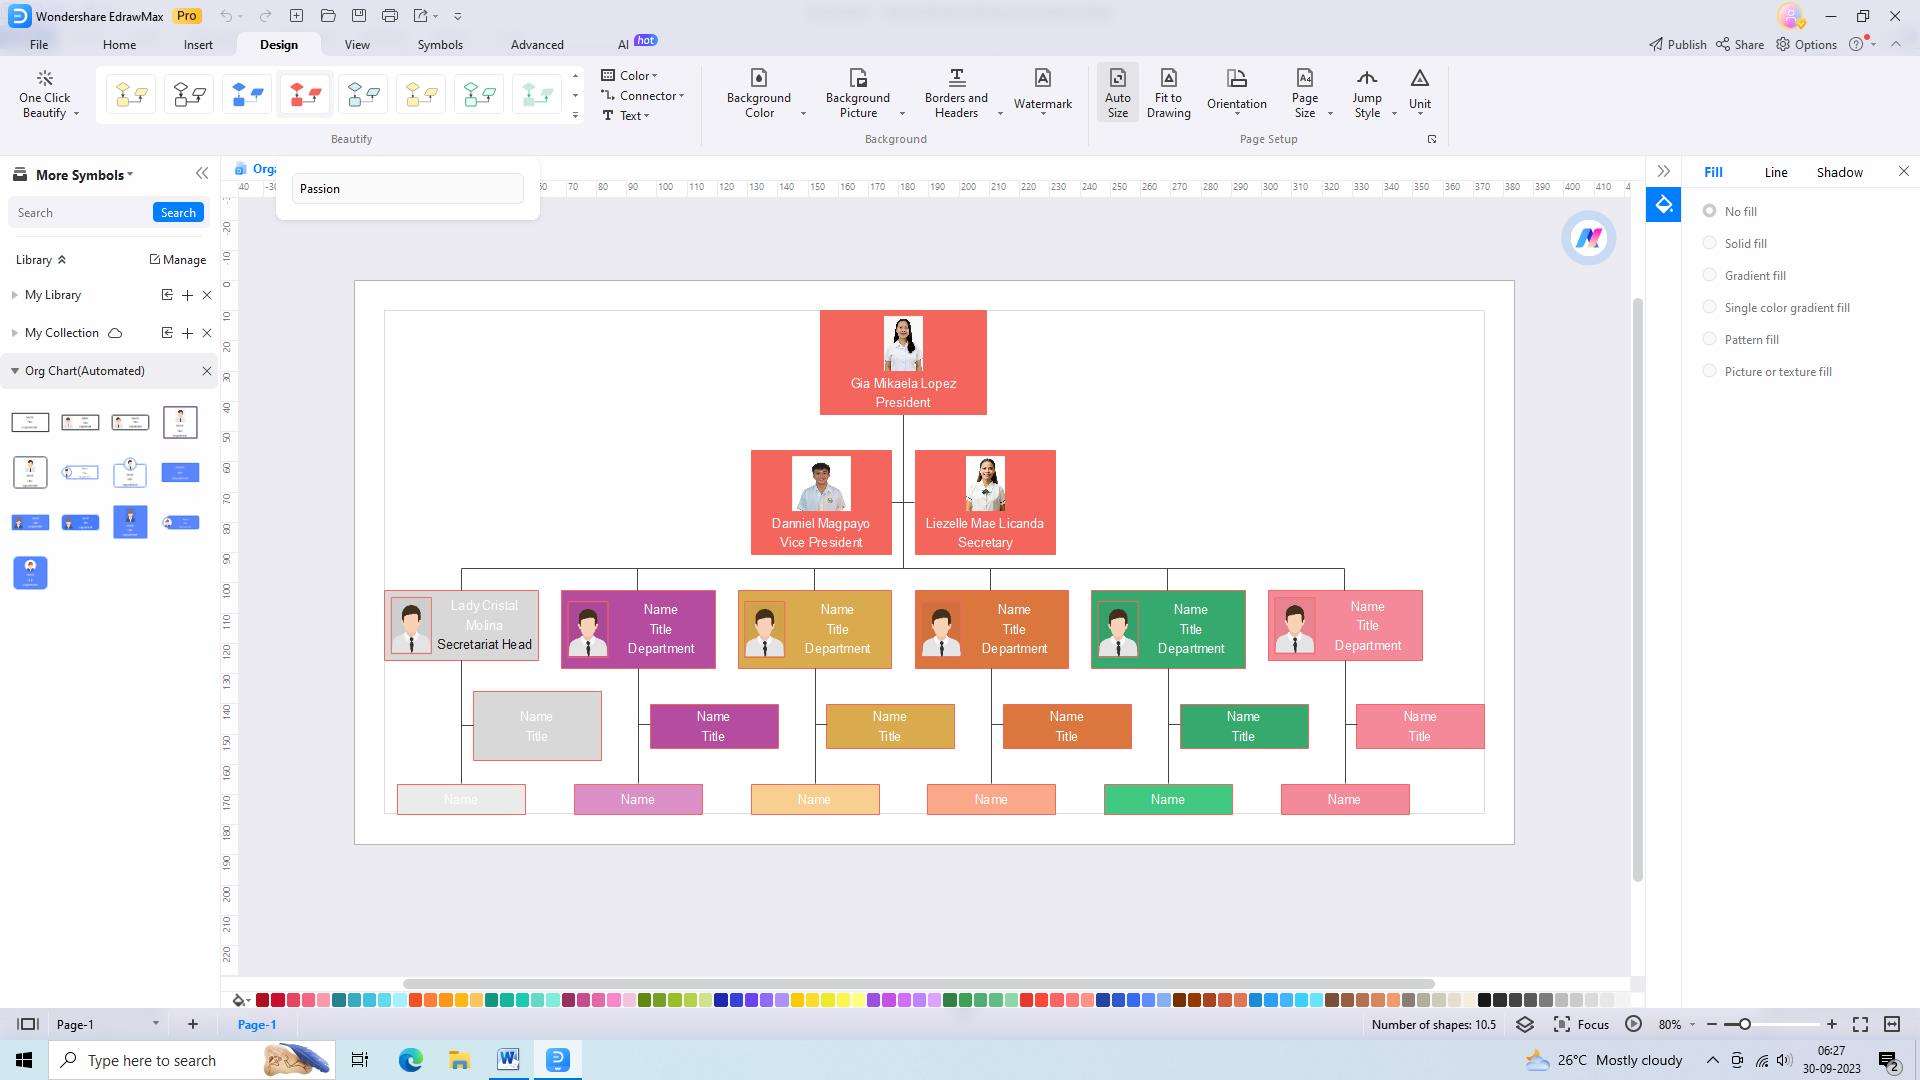
Step 5: Save and Export the chart
Once you have completed the previous steps, you will have an organizational chart that is easy to read and understand. You can save the chart in your desired format and also export the company organizational chart.
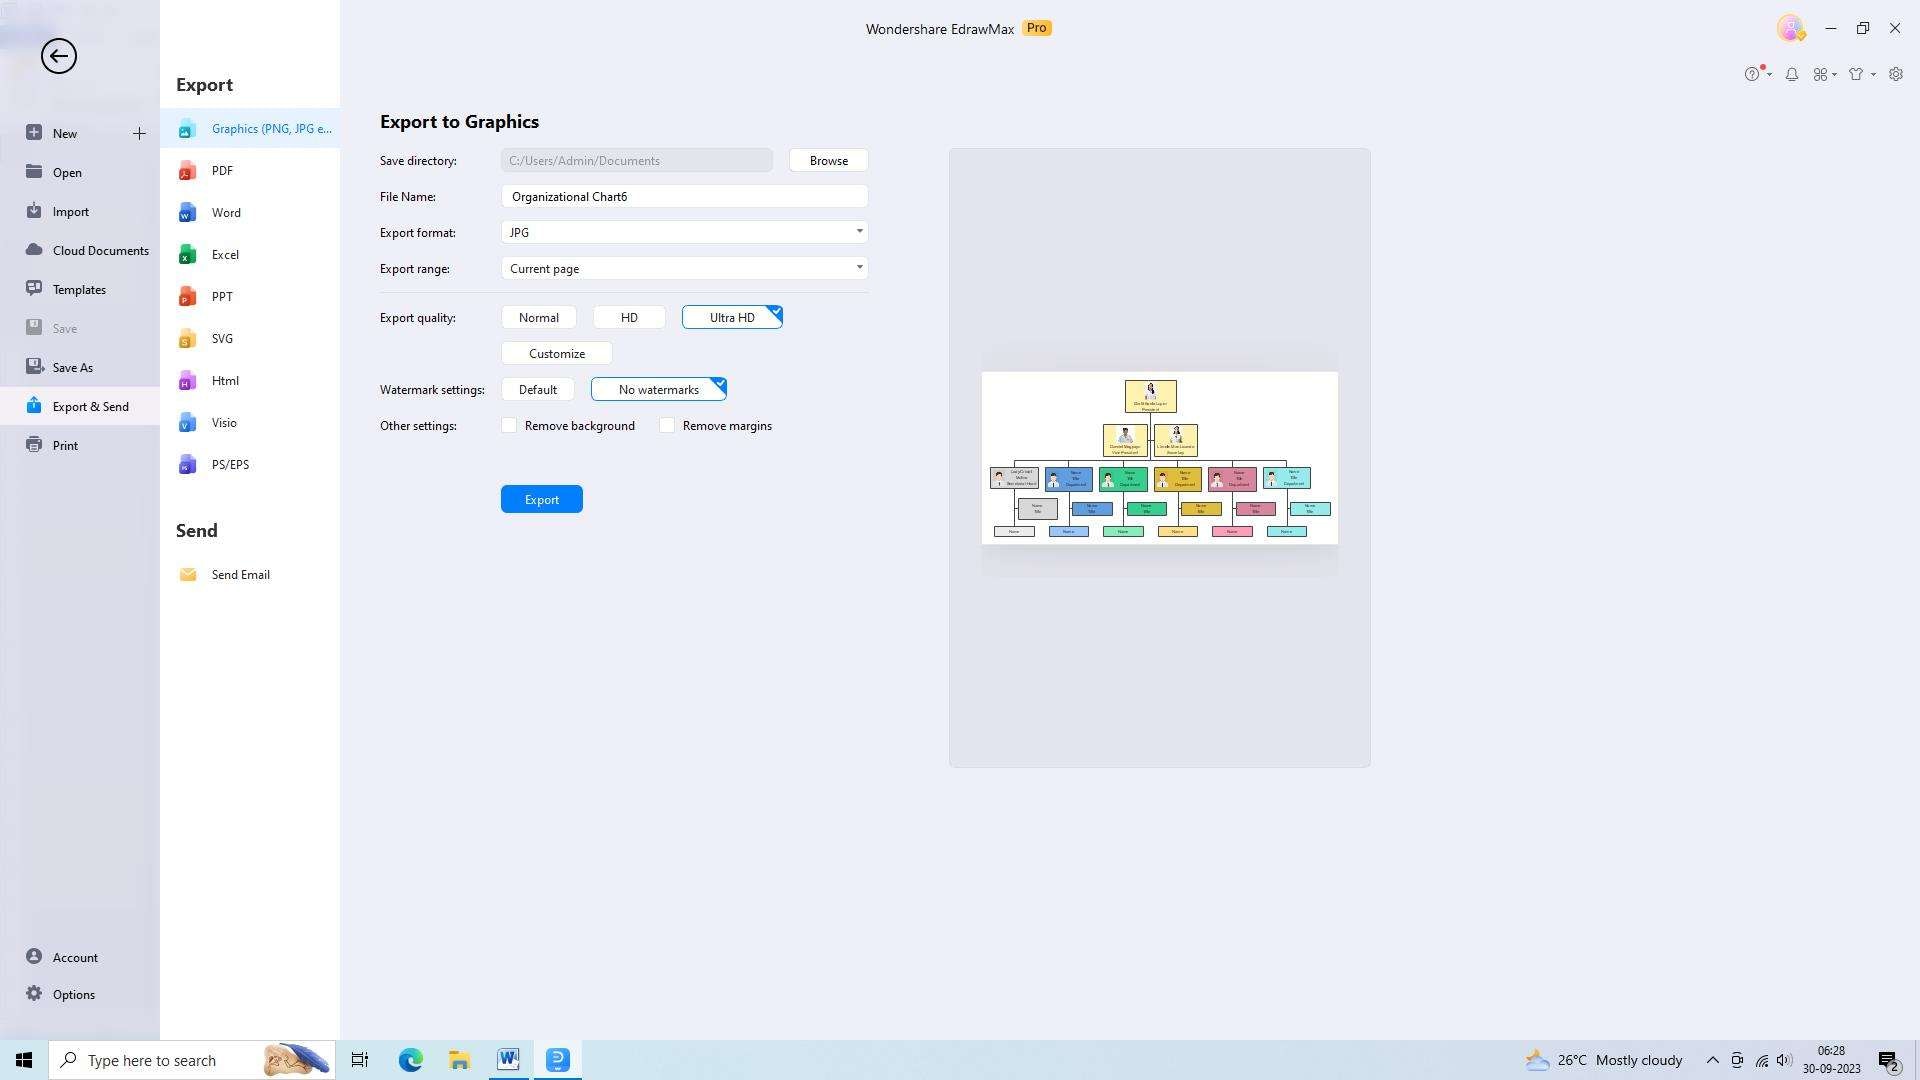
Conclusion
Organizational charts are crucial for understanding the formal reporting relationships and lines of authority within a company. By incorporating visual elements such as photos, shapes, colors, logos, and animations, these charts can become more engaging and easier to comprehend. Planning and gathering accurate information are essential for creating an effective company organizational structure chart, and ongoing updates ensure its relevance as the organization evolves.


