


A bar chart, or bar graph, represents data in the form of horizontal or vertical bars. It serves the purpose of visually depicting and comparing categorical or discrete data values. Understanding bar charts is important as these help in data analysis and effectively communicate trends, comparisons, and proportions within datasets.
This article discusses the bar charts in detail, along with their components. It will also provide some insights into the types of bar charts you can use for data visualization, the use cases, interpretation techniques, and some tips and tricks to create the charts effectively with some amazing tools.
In this article
Part I. Components of Bar Chart
A bar chart is usually composed of the following components:
Axes, Bars, and Labels
A bar chart has a vertical axis (Y-axis) and a horizontal axis (X-axis). Parallel to this axis are arranged the graphical elements of the chart (either horizontally or vertically), known as bars.
With each bar, labels are associated. These are the categories or variables placed beneath the bars on the X-axis and to the left or right of the bars on the Y-axis. These labels make it easy to interpret the chart.
Bar Width and Spacing
Accuracy in bar width and spacing helps maintain consistency in the chart and makes it more visually appealing and easy to understand.
The width of the bars can vary depending on the chart's design. In some cases, bars may be relatively thin, while in others, they may be wider. However, the spacing between bars should be uniform, and the bars should not overlap.
Value Scale and Axis Intervals
The range of values represented on the Y-axis is known as the value scale and provides the reference for understanding the height or length of each bar. Depending on the data and the chart's purpose, it may start from zero or a specific minimum value.
Axis intervals are the divisions or markings added alongside the Y-axis that help the users to read and interpret the values accurately. These are marked with numbers or labels to indicate the values corresponding to specific points on the axis.
Part II. Types of Bar Charts
Bar charts have four types: vertical, horizontal, stacked, and grouped. Each chart type is explained below, along with an image to give you better insights.
Vertical Bar Charts
Vertical bar charts are graphical representations of grouped data using vertical bars. These bars are aligned along the y-axis of the graph, and their heights represent the values associated with the data.

 below.
  below.
Horizontal Bar Charts
Horizontal bar charts, on the other hand, present grouped data using horizontal bars. The bars are placed along the x-axis of the graph, and the value of the data is represented through their length.
Horizontal bar charts can help deal with longer labels or when you want to emphasize horizontal comparisons.

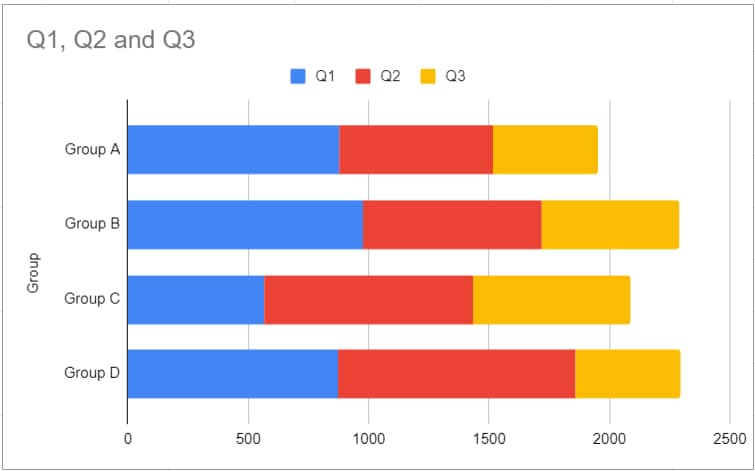
Stacked Bar Charts
A stacked bar graph, or composite bar chart, divides a whole into various components through segments. Different colors are used to visually distinguish each segment, which helps identify different categories within the data.

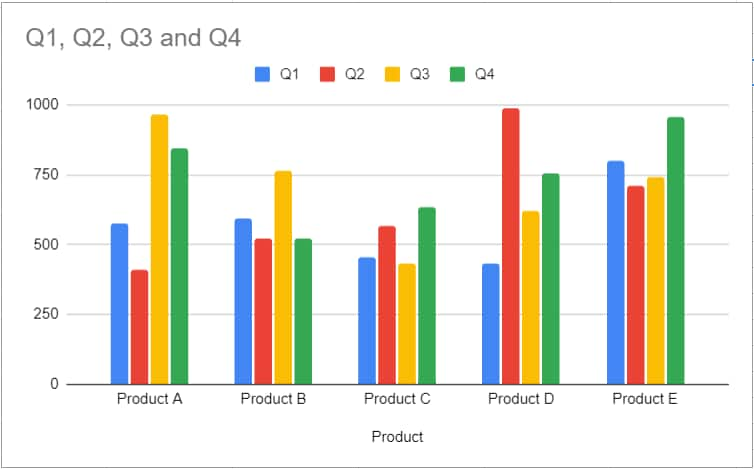
Grouped Bar Charts
Grouped or clustered bar charts represent discrete values for multiple objects with a common category.
These are one of the bar chart examples that can be created vertically or horizontally. The total number of instances is combined into a single bar that helps compare different datasets.

Part III. Use Cases of Bar Charts
Bar charts are useful tools for data visualization, interpretation, research, etc., for many industries like business, marketing, education, research, and at the individual level.
Business and Marketing Applications
Data charts are an effective tool for data visualization. It helps businesses assess the performance of different products, regions, or sales teams, identify trends, and allocate resources effectively.
Moreover, marketers create bar charts to segment their customer base based on demographics, purchasing behavior, or preferences, aiding in targeted marketing efforts.
Educational and Research Purposes
Bar charts are also useful in educational settings to teach students data interpretation and presentation skills. Not only this, but researchers in biology, economics, psychology, and others use bar charts to represent their experimental results.
Real-world Examples
The use of bar charts has been effective in some real-world scenarios, for example:
- COVID-19 Data Visualization: During the COVID-19 pandemic, the Centers for Disease Control and Prevention (CDC) used bar charts to represent infection rates, vaccination progress, and mortality rates to get better insights into the situation.
- Retail Sales Optimization: Retail giants like Amazon employ bar charts to analyze sales data and optimize inventory management.
- Election Polling: News organizations and pollsters use bar charts to display election results, allowing the public to grasp the distribution of votes among candidates and parties easily.
- Financial Market Analysis: Investors and financial analysts rely on bar charts to track stock prices, compare company performance, and make investment decisions.
Part IV. How to Create a Bar Charts
Creating bar charts is easy if you follow the right steps, and for your convenience, we’ve listed all the steps below so you don’t have to look for these anywhere else:
- Collect the Data: Data collection is the foremost step in creating a bar graph. Since the bar graph is a comparative study, ensure you collect enough data for all the categories you want to include in your chart.
- Draw and Label the Axis: Draw and label the X and Y axes after collecting all the data. This important step helps you sort your data for a better comparison.
- Draw the Bars: The next step in creating a bar graph is drawing the bars. These are not continuous or connected and depend on the base value and corresponding frequency, making the data representation and comparison clearer.
- Interpret the Data: Once you’ve completed the bar graph, interpret the data, find out the most and least preferred choices, and identify missing or incomplete data.
Part V. Popular Software and Tools for Bar Chart Creation
There are many tools and software that you can use to create bar charts easily. However, EdrawMax, Microsoft Excel, and Google Sheets are top-rated. Here’s the detail for each software and the description for their usage:
EdrawMax
EdrawMax is an AI-powered diagram maker with advanced bar graph creation capabilities. Unlike Microsoft Excel or Google Sheets, it is designed specifically for diagramming and data visualization.
The dedicated diagram maker offers a collection of over 15,000 ready-made templates and 26,000 symbols and allows users to export the diagram in a dozen of formats. You can choose a desired template from its Templates Community or draw a bar graph from scratch. It provides various customization options, including chart styles, colors, and annotations that you can use to make your chart more interesting.

Google Sheets
Google Sheets is a cloud-based spreadsheet application with powerful charting capabilities. It allows you to create bar charts collaboratively, making it an excellent choice for teams working on data visualization projects. Google Sheets also integrates seamlessly with other Google Workspace apps, facilitating data sharing and collaboration.
Microsoft Excel
Excel is a widely used spreadsheet application with similar charting capabilities and steps to Google Sheets. Its user-friendly interface is accessible to many users, making it a popular choice for creating basic bar charts.
Part VI. Tips for Making Bar Charts
Creating effective bar charts is essential for visually representing data. Here are some tips that you can keep in mind while creating bar charts:
Choose the Correct Baseline
A zero-valued baseline is correct to use when creating a bar chart. It helps to maintain the truthfulness of your data visualization. On the other hand, a non-zero baseline can lead to misrepresentation of the data.
Keep it Simple
A simple bar chart is always effective and impactful!
Keep the bars in the chart in their original rectangular form for simplicity. Avoid using rounded bar caps or 3D effects excessively, making it difficult for the reader to interpret actual values and complicating length measurement and alignment of baselines.
Choose Appropriate Colors and Styles
Use visually appealing colors to convey your message effectively. Consider using a color palette that aligns with your data or branding. Use different bar styles, like solid bars, gradient bars, or bars with borders, to highlight specific data points or create visual interest.
However, you must avoid overusing the colors, gradients, or patterns that might clutter the chart.
Incorporating Visual Cues and Annotations
Use text annotations or arrows to highlight specific data points or trends. You can also add reference or target lines to show benchmarks or goals. These can help viewers understand how data compares to certain standards.
Draw your reader’s attention to your chart by adding markers like dots, small icons, or gridlines. Also, include a clear legend to explain your color codes.
Part VII. How To Interpret Bar Charts
Interpreting bar charts correctly is important to extract meaningful insights from the data. If you don’t know how to do it, below are ways you can do it:
Analyzing and Comparing Data Values
To analyze and compare data values correctly, know the following things:
Identifying Trends and Patterns: The data represented in the bar charts reveal the trend over time or across categories. Remember that an upward or downward trend indicates growth or decline.
Comparing Different Categories or Groups: Comparing bar heights allows for quick assessments of differences or similarities between categories. Longer bars represent larger values.
Understanding Proportions and Percentages: The length of each bar represents its proportion with the whole. You can easily identify the percentage of each category by comparing it to the total bar length.
Avoiding Common Misinterpretations
While following the Dos of bar graph interpretation is important, avoiding the Don’ts to get the most reliable interpretation results is also crucial.
Below are some points that you need to consider:
Misleading Scaling and Axis Manipulation: Ensure that the y-axis scaling is consistent and starts from zero to prevent exaggeration of differences. Manipulating the axis can distort the perceived significance of data points.
Overlapping or Cluttered Bars: Avoid overcrowding the chart with too many bars because it makes it challenging to distinguish between the bars. Use grouping, color coding, or smaller intervals to alleviate the clutter.
Choosing the Appropriate Chart Type for the Data: Be careful when choosing the type of bar chart for data representation; it may not be the best choice for all data types. For example, use a stacked bar graph when displaying parts of a whole, and consider other chart types like line charts for time-series data.
Part VIII. Pros and Cons of Bar Charts
While bar charts are prized for their simplicity and effectiveness in data representation, they're not a one-size-fits-all solution and have limitations regarding certain data sets. Understanding the strengths and weaknesses of bar charts is essential for effective data communication and analysis.
Conclusion
Bar charts are versatile tools that you can use for data visualization and comparison within categories. They simplify complex information, making it accessible to a wide audience. It's important to remember that while bar charts excel in certain scenarios, they may not be the best choice for all data types; gaining practical knowledge in data visualization can help you create more effective charts.
Tools like Google Sheets and Microsoft Excel can help create an effective bar chart. But if you’re just starting with data visualization, EdrawMax can be a great choice. It is beginner-friendly, offers multiple premade templates, and has AI-powered charting functionality, which makes it even more desirable.
[没有发现file]AI Diagram Generator
Enter your prompt. Upload files if needed. Generate diagrams, charts, or slides instantly.


