Welcome to the world of project management and visual organization with Google Sheets. Google Sheets offers many features as one of the most widely used spreadsheet apps. However, not everyone knows its potential to create Gantt charts.
These visual tools are essential for effectively visualizing timelines, tasks, and resources. In this article, you'll dive into crafting Gantt charts using Google Sheets. This will surely empower you to plan and track your projects efficiently.
And if you need to make professional tool to visually impactful Gantt charts, read the second half of the article to learn about how to make a Gantt Chart on EdrawMax within minutes for free.
In this article
Part I. How To Create Gantt Charts in Google Sheets
Google Sheets, a versatile online spreadsheet tool, isn't just for calculations and data management. It can also be a powerful ally in visual project planning with Gantt charts. These charts provide a clear and comprehensive overview of project schedules, tasks, and dependencies.
Explore the step-by-step process of crafting Gantt charts in Google Sheets to streamline project management tasks.
Step1
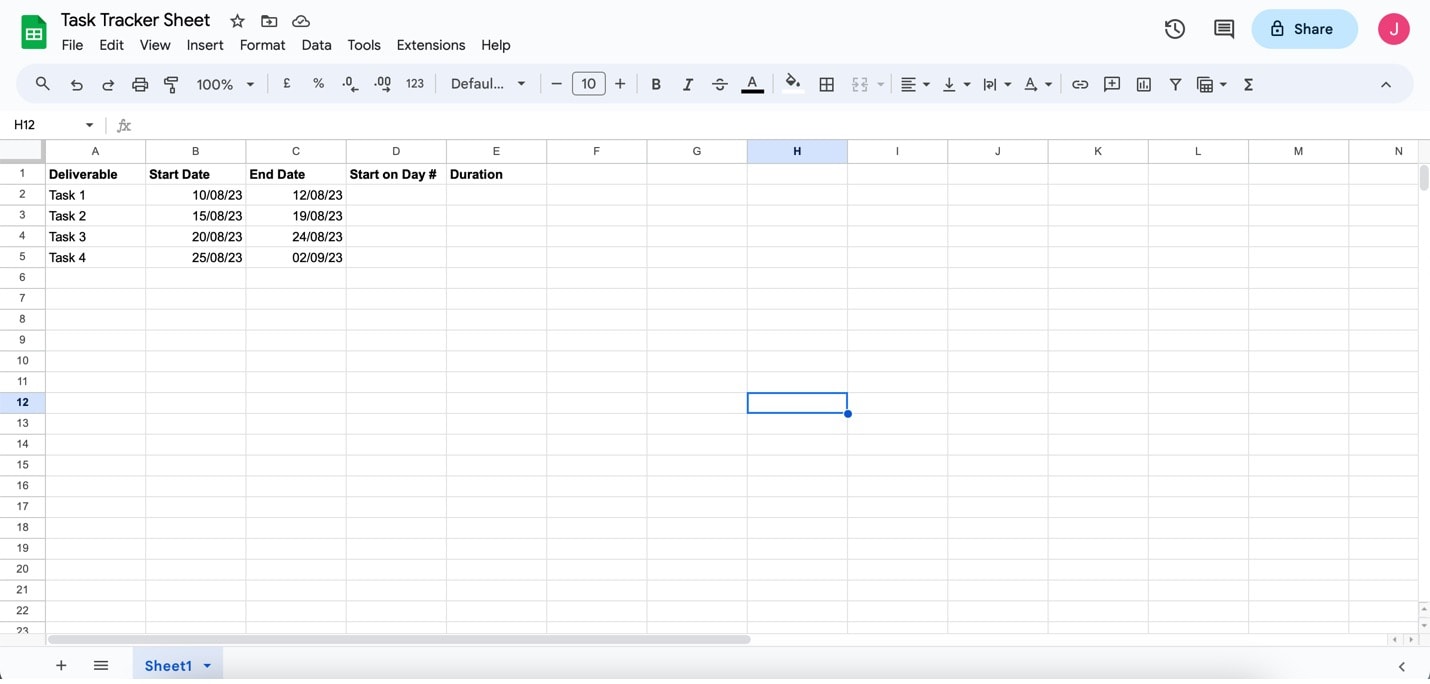
Load up a new spreadsheet in Google Sheets. Label 5 columns like below. Make one for Deliverable, Start Date, End Date, Start on Day #, and Duration. Fill in the projected goal dates on Start Date and End Date.
Step2
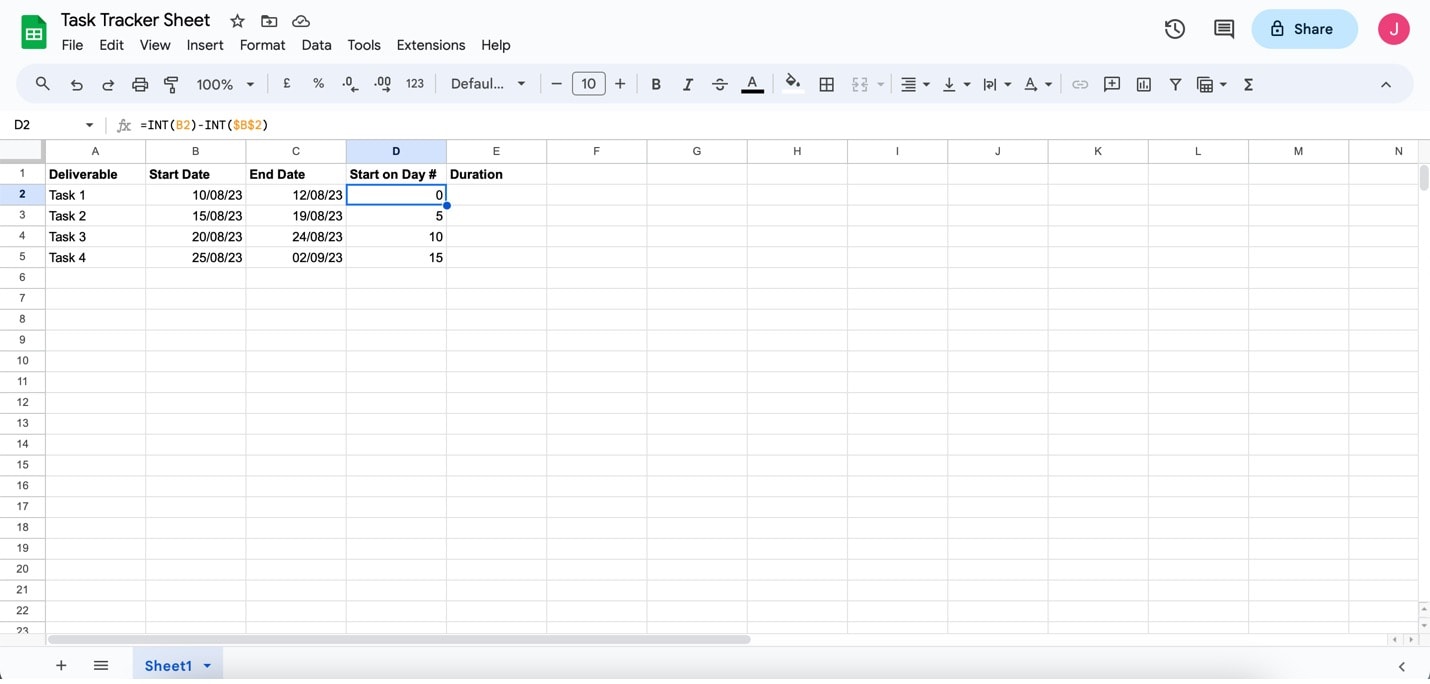
Input this formula under the Start on Day # column: =INT(B2)-($B$2). Change the values accordingly for each task. For example, Task 2's Start on Day # column would have the formula =INT(B3)-($B$3).
- Pro Tip: When selecting the first row, you can drag the blue circle to automatically copy the formula to the succeeding rows (Autofill feature).
Step3
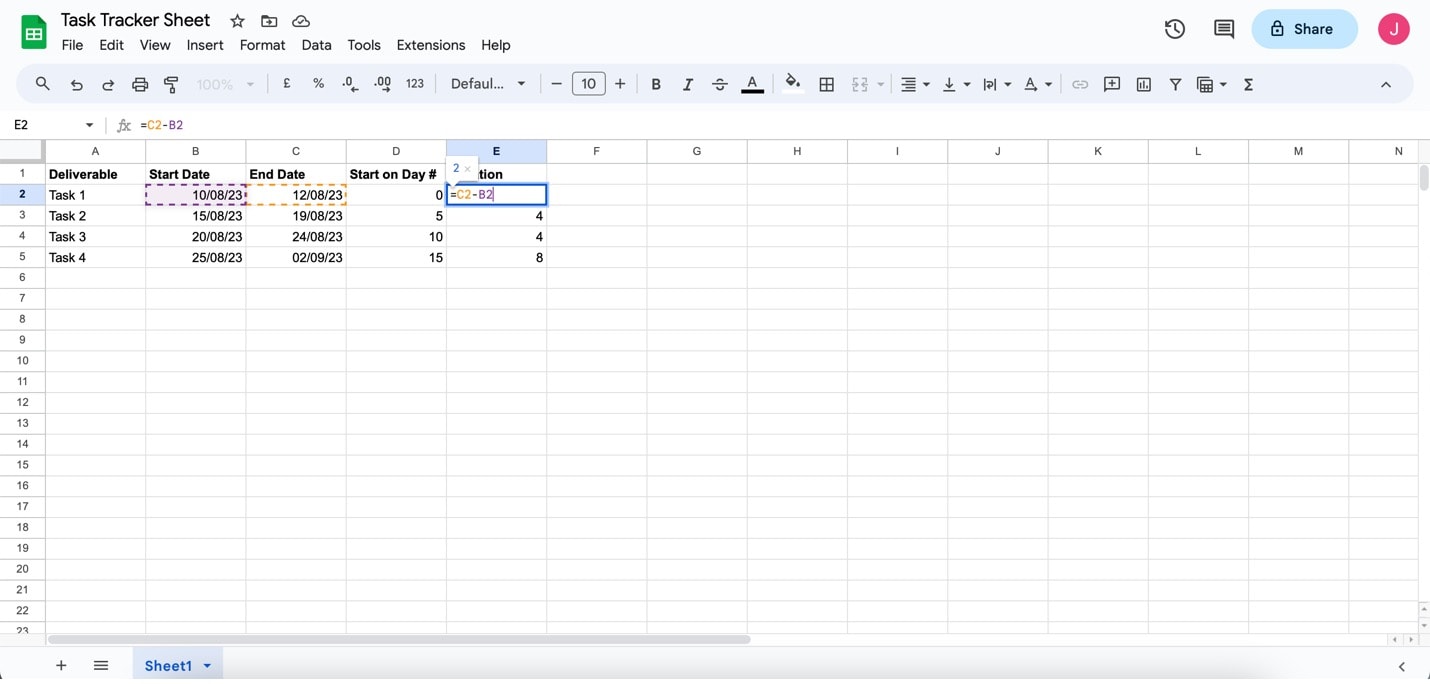
Now, it's time to input the formula for the Duration column. The operation will calculate the projected time for the tasks to finish. To do this, input this formula for the first row: =C2-B2. Then, use the Autofill feature to input the same formula for the other rows accordingly.
Step4
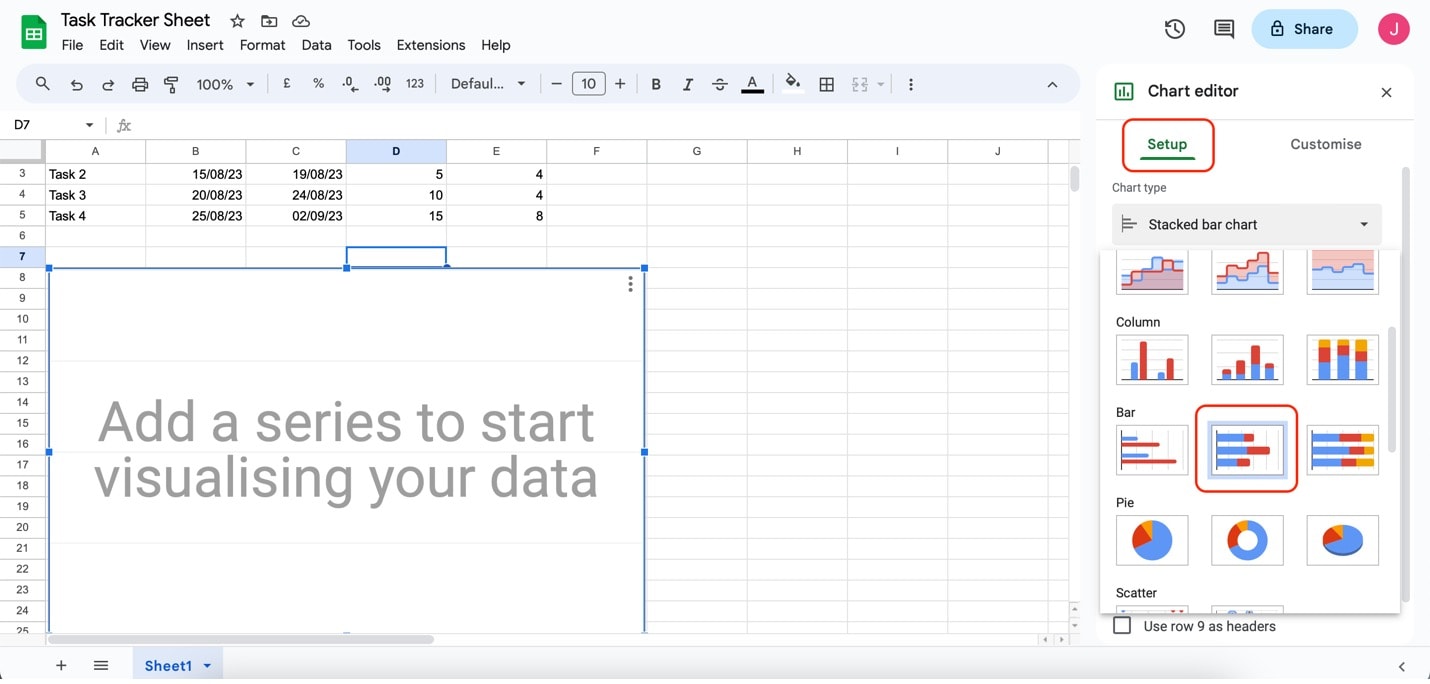
Now, it's time to make the chart. Click Insert on the menu bar, then click Chart. On the appearing Chart editor menu, change the chart type to the Stacked bar chart.
Step5
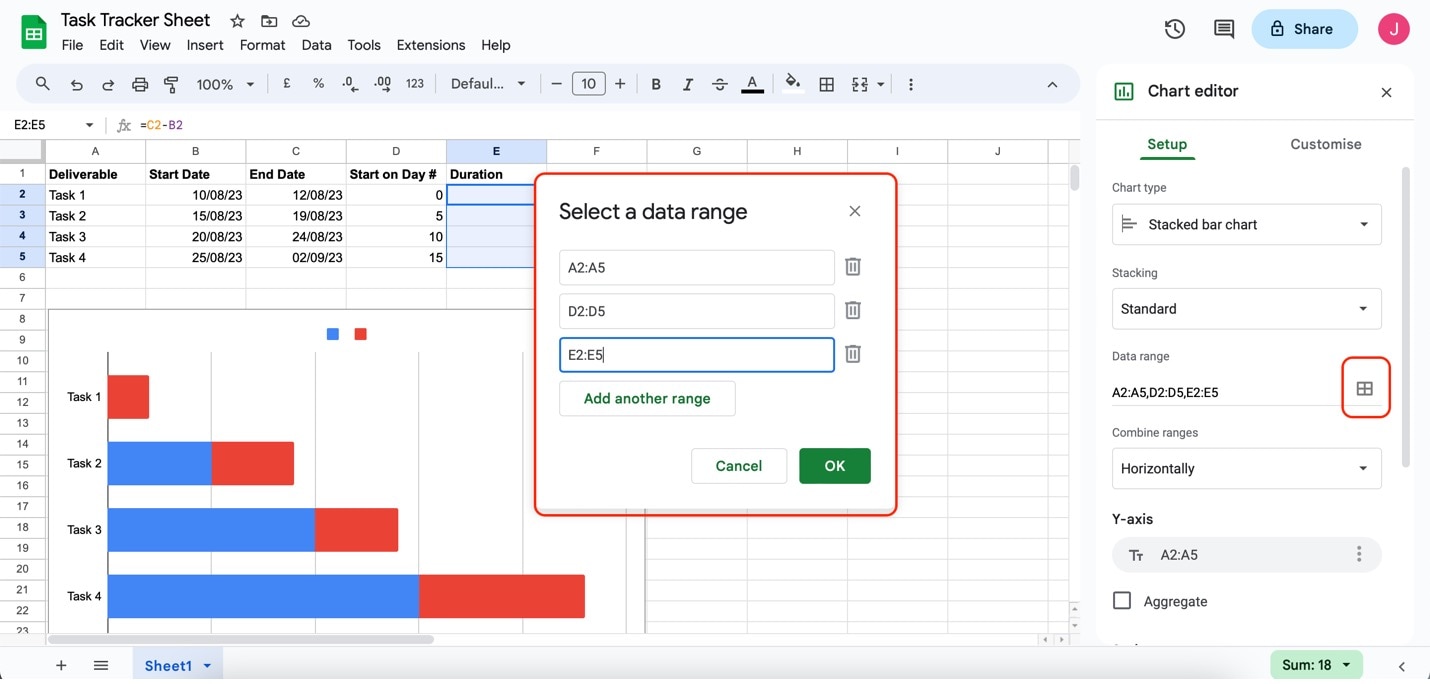
Add in your data. Click the Select data range button. Then, input the data ranges of Deliverable (A2:A5), Start on Day # (D2:D5), and Duration (E2:E5) accordingly.
Step6
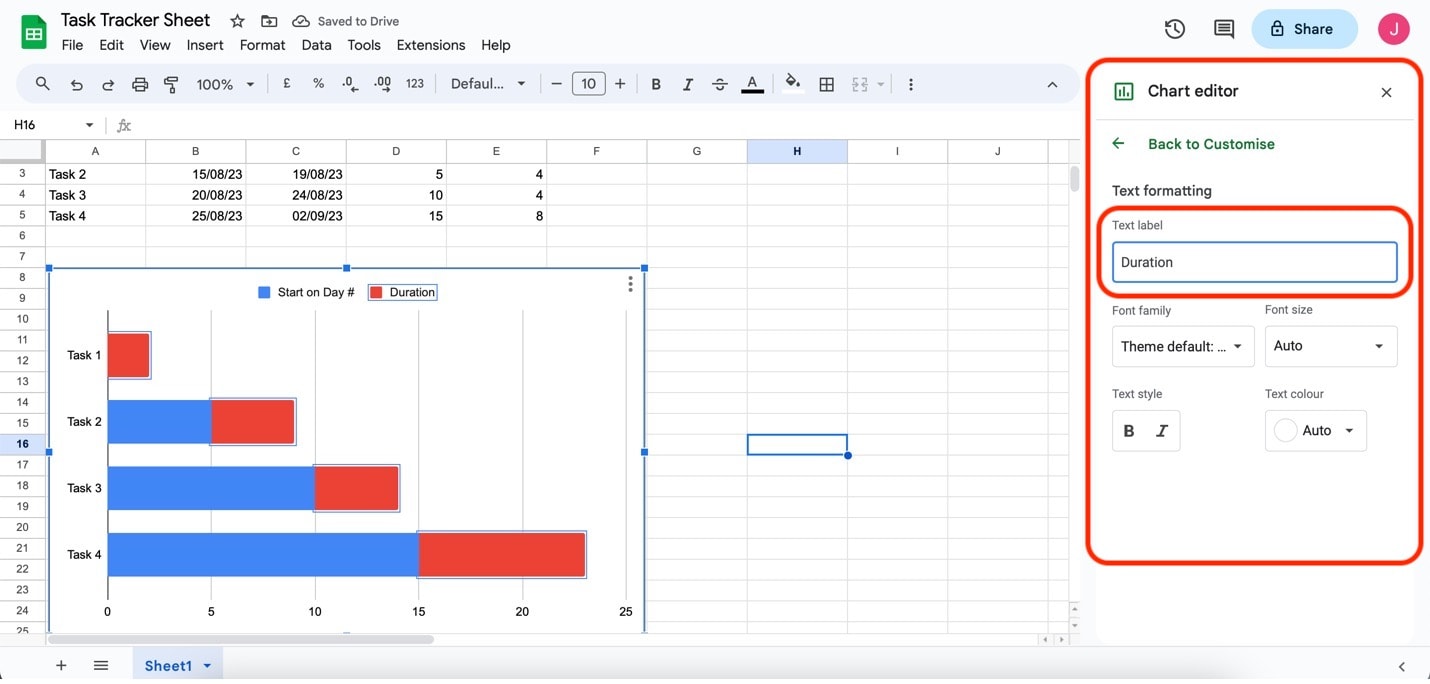
Edit the Legend by clicking on the colorful bars found on the chart. It will bring up the Customize menu. Add the name of the label under Text labels.
Step7
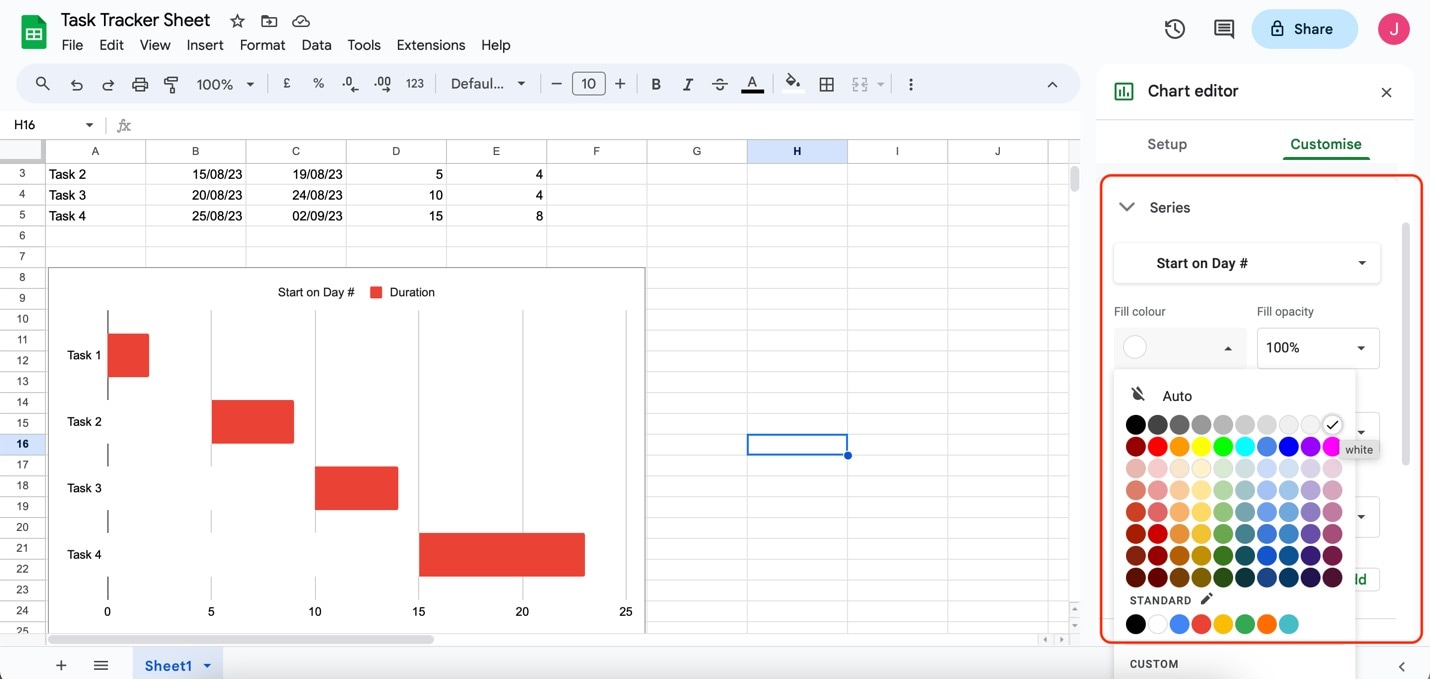
Transform your stacked bar chart into a Gantt chart by going to the Customise panel. Then, under Series, choose "Start on Day #." Change the color to white to make it disappear from the chart.
Part II. Make a Gantt Chart With Wondershare EdrawMax – Easier and Better
While creating Gantt charts in Google Sheets can be effective, Wondershare EdrawMax offers a more robust and efficient solution. As a professional diagramming software, EdrawMax empowers users to craft intricate visual representations easily. If you're seeking a smoother and more feature-rich experience in creating Gantt charts, EdrawMax might be just what you need.
Why Choose EdrawMax for Gantt Charts
EdrawMax stands out for its user-friendly interface and advanced diagramming capabilities. With a wide array of templates and design tools at your disposal, creating Gantt charts becomes a breeze. Here are some key features that make EdrawMax an excellent alternative:
- Rich Template Library: EdrawMax provides a diverse collection of Gantt chart templates tailored to various industries and project types. This means you can kick-start your project planning process with a template that suits your needs.
- Flexible Customization: EdrawMax allows you to customize every element of your Gantt chart, from colors and fonts to task bars and milestones. This level of control ensures that your Gantt chart accurately represents your project's unique timeline.
- Collaboration and Sharing: Collaborative projects become seamless with EdrawMax's cloud-based platform. You can invite team members to collaborate, making project management collaborative.
While Google Sheets is a versatile tool, EdrawMax has more powerful diagramming capabilities. Google Sheets' charting options might need more advanced features and customization potential that EdrawMax offers. Additionally, EdrawMax's direct export feature to several apps streamlines the integration of your Gantt chart into your project documentation.
Part III: How To Create Gantt Charts Using EdrawMax
Creating a Gantt chart on EdrawMax is simple. Here is how:
Step1
Download, install, and launch EdrawMax or try it online. Log in with your Wondershare ID or an account of Google, Facebook, or Twitter.
Step2
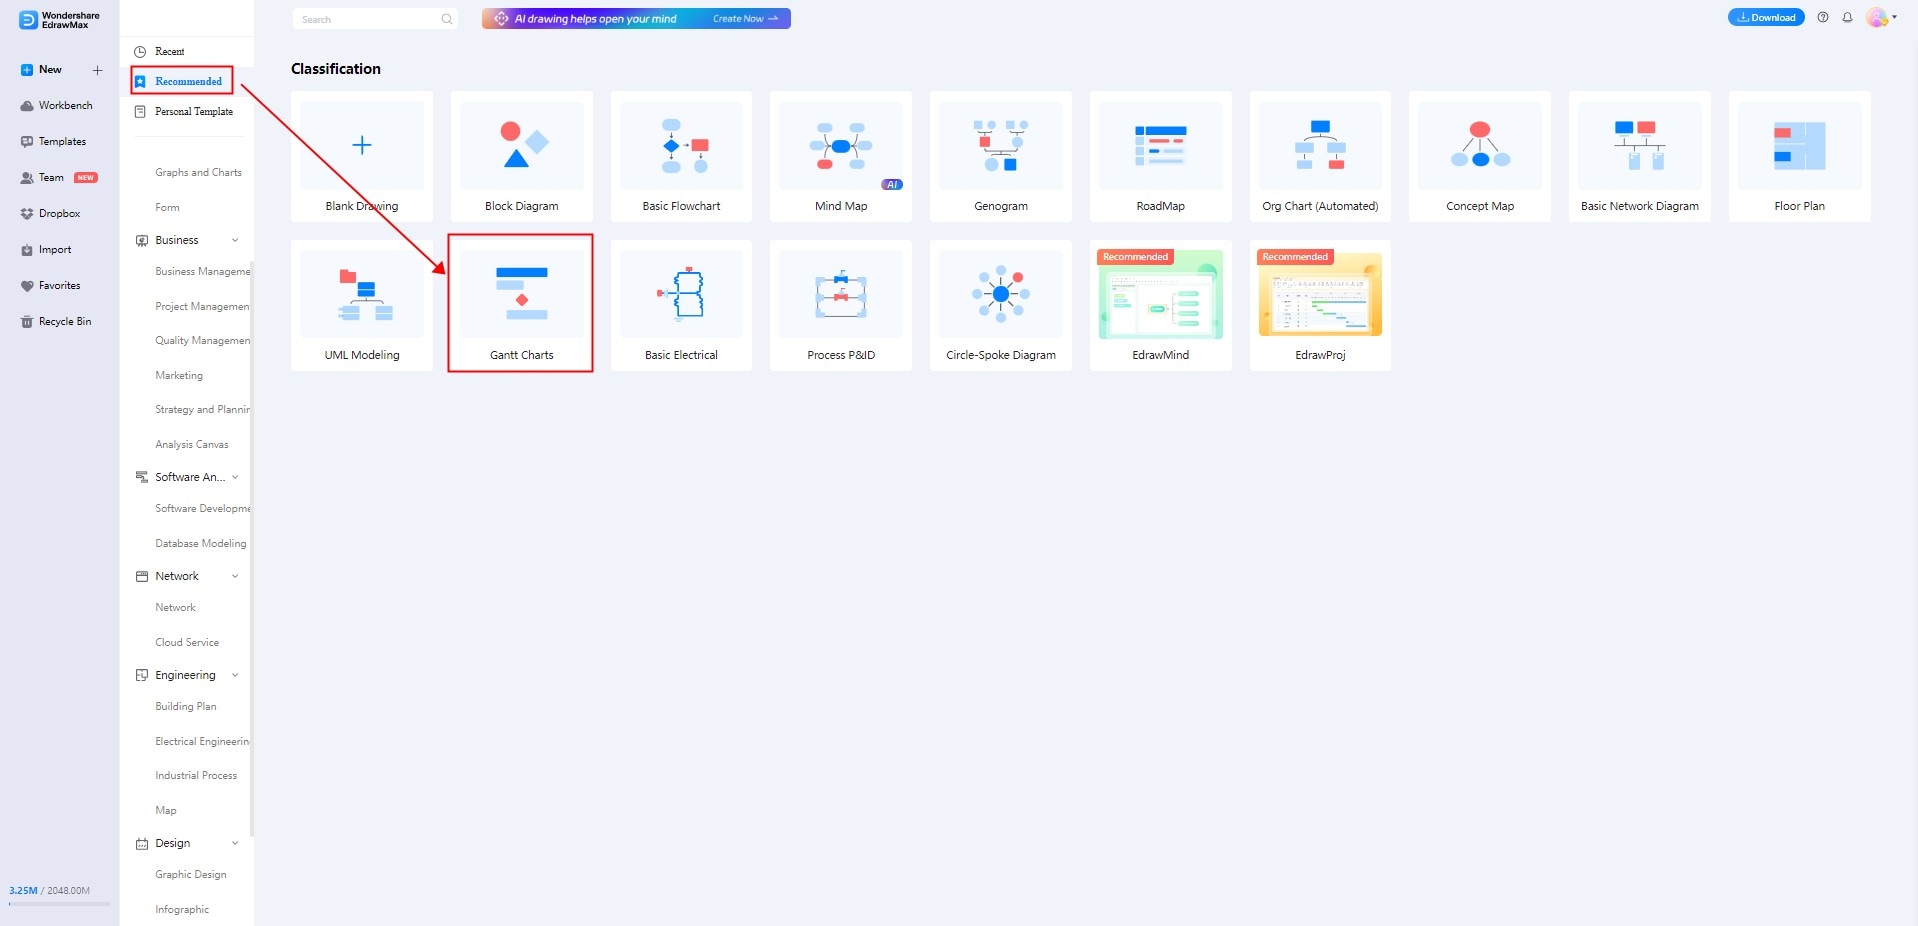
Go to Recommended in the New column. Select Gantt Charts and click Create New.
Step3
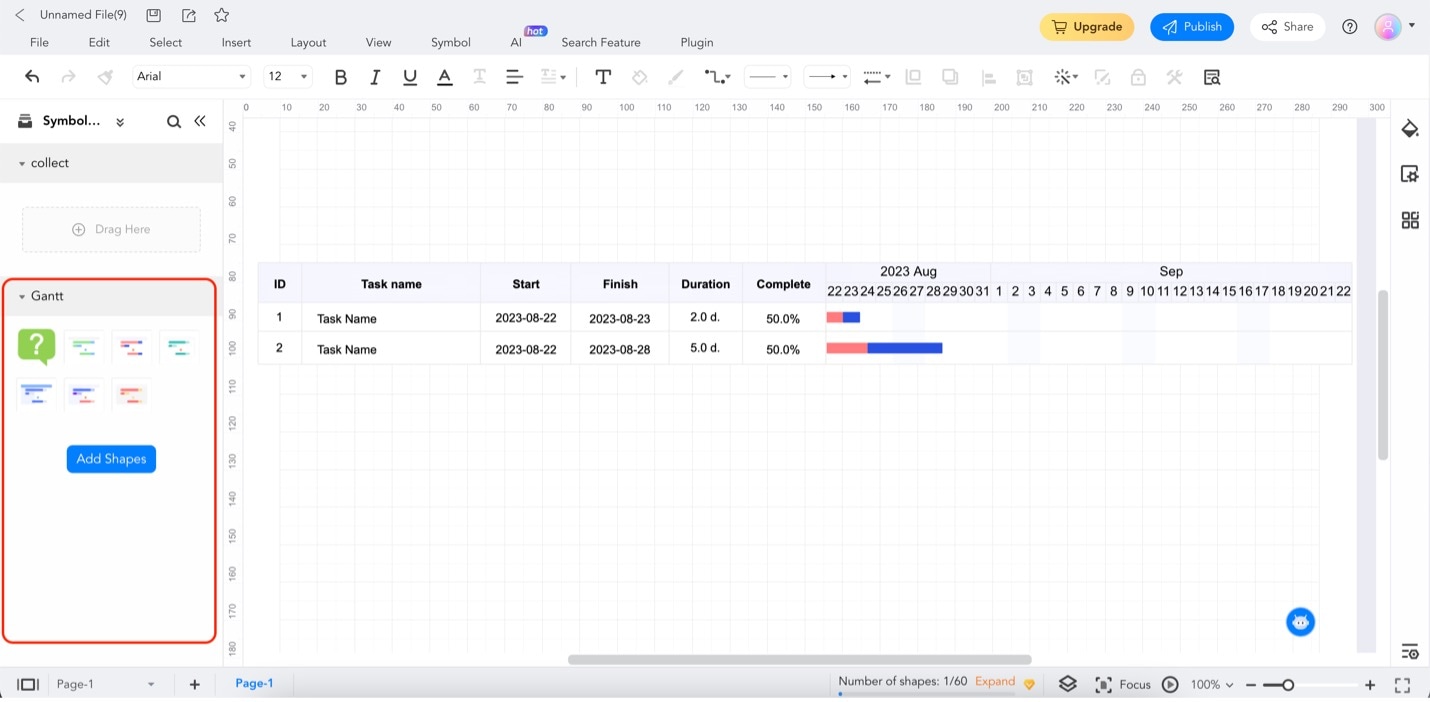
Use the drag-and-drop interface to choose any template under Gantt from the elements toolbar on the left.
Step4
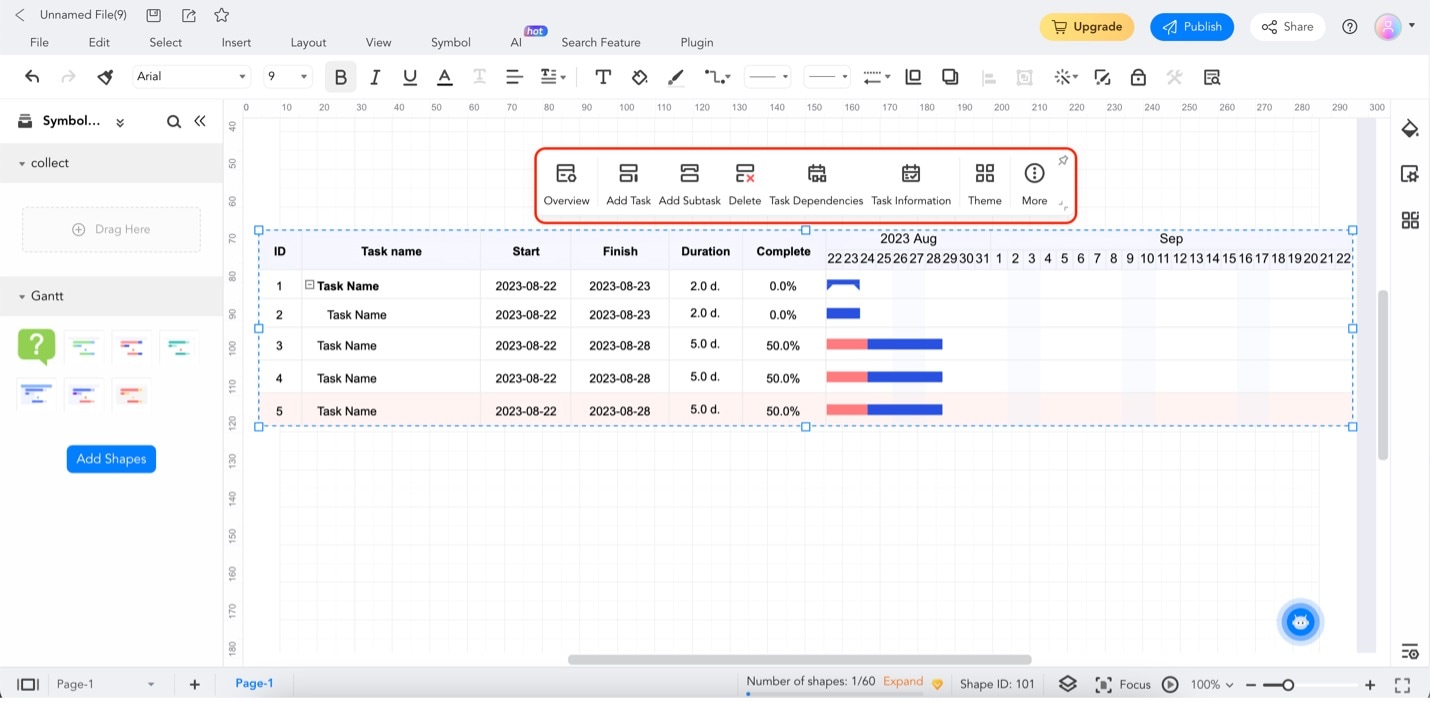
Add more tasks/subtasks to the chart by clicking on any task. Then, use the tools on the appearing menu bar. Click Add Task to add a new task. Click Add Subtask or Task Dependencies to add a new subtask to a specific job.
Step5
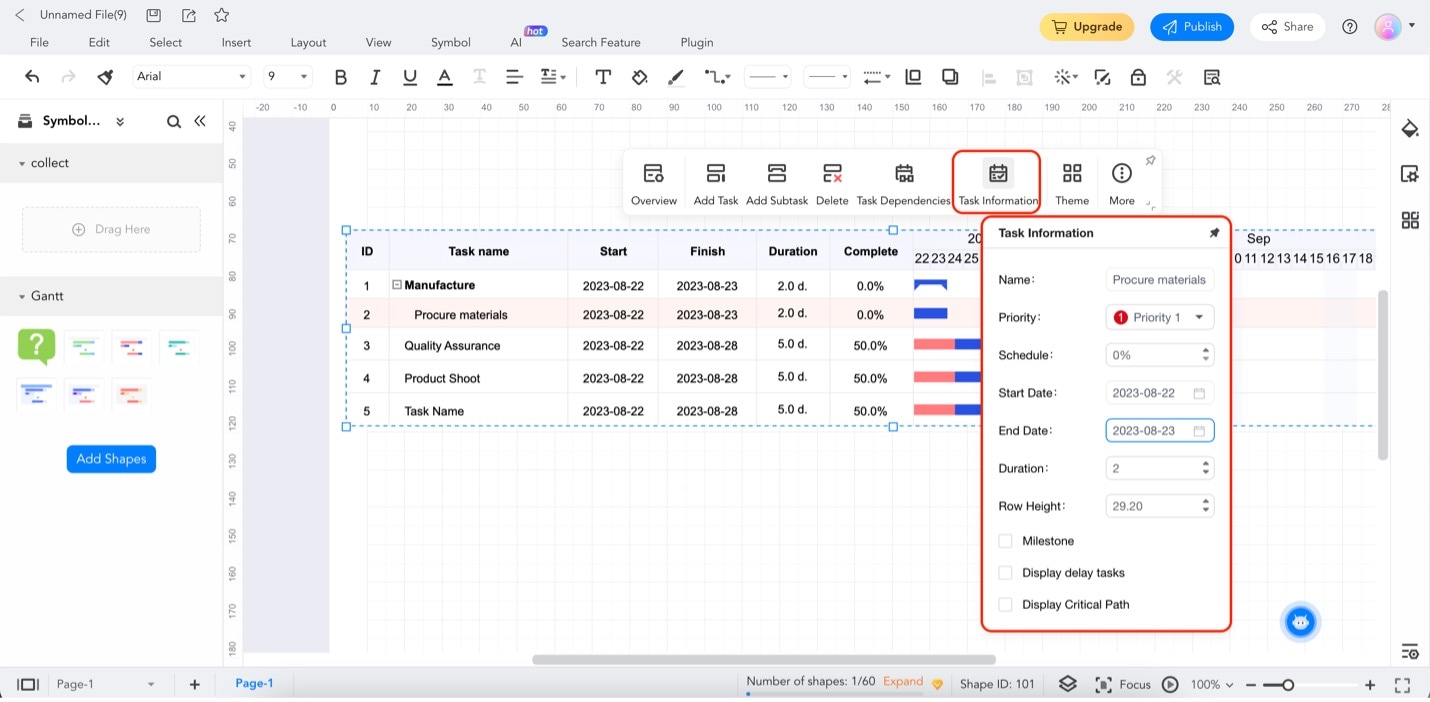
Edit each task's information using the Task information button on the same menu. You can edit the Name of the task. You can also set its Priority number. You can also edit the completion percentage under Schedule. You can edit the task's start and end dates/duration from this menu.
Part IV. Three Templates To Easily Get Started
Embrace the convenience and creativity that EdrawMax's Template Community brings to your Gantt charting journey. The Template Community offers a rich collection of pre-designed templates, ready to be customized according to your project's needs. These templates provide an excellent foundation for your Gantt charts, saving you time and effort while ensuring professional results.
Editing these templates is easy with EdrawMax's intuitive interface. You can modify colors, fonts, shapes, and task descriptions to align with your project's requirements. A Gantt chart that's initially a project timeline can quickly evolve into a marketing schedule or product launch plan.
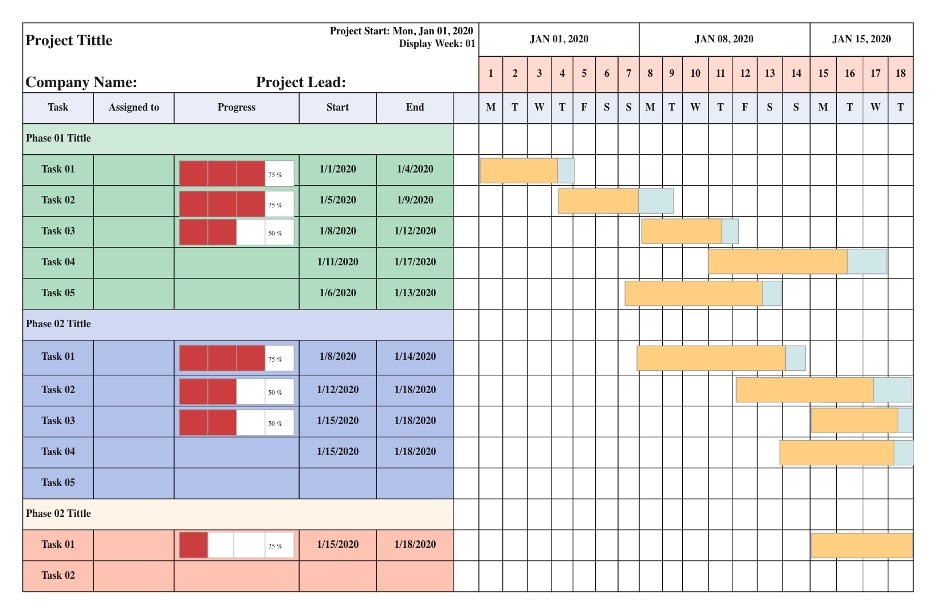
Gantt Chart With Calendar
Keep your project timeline in sync with real-world dates using this template. This Gantt chart layout integrates seamlessly with a calendar view, ensuring you effortlessly stay on top of tasks and deadlines.
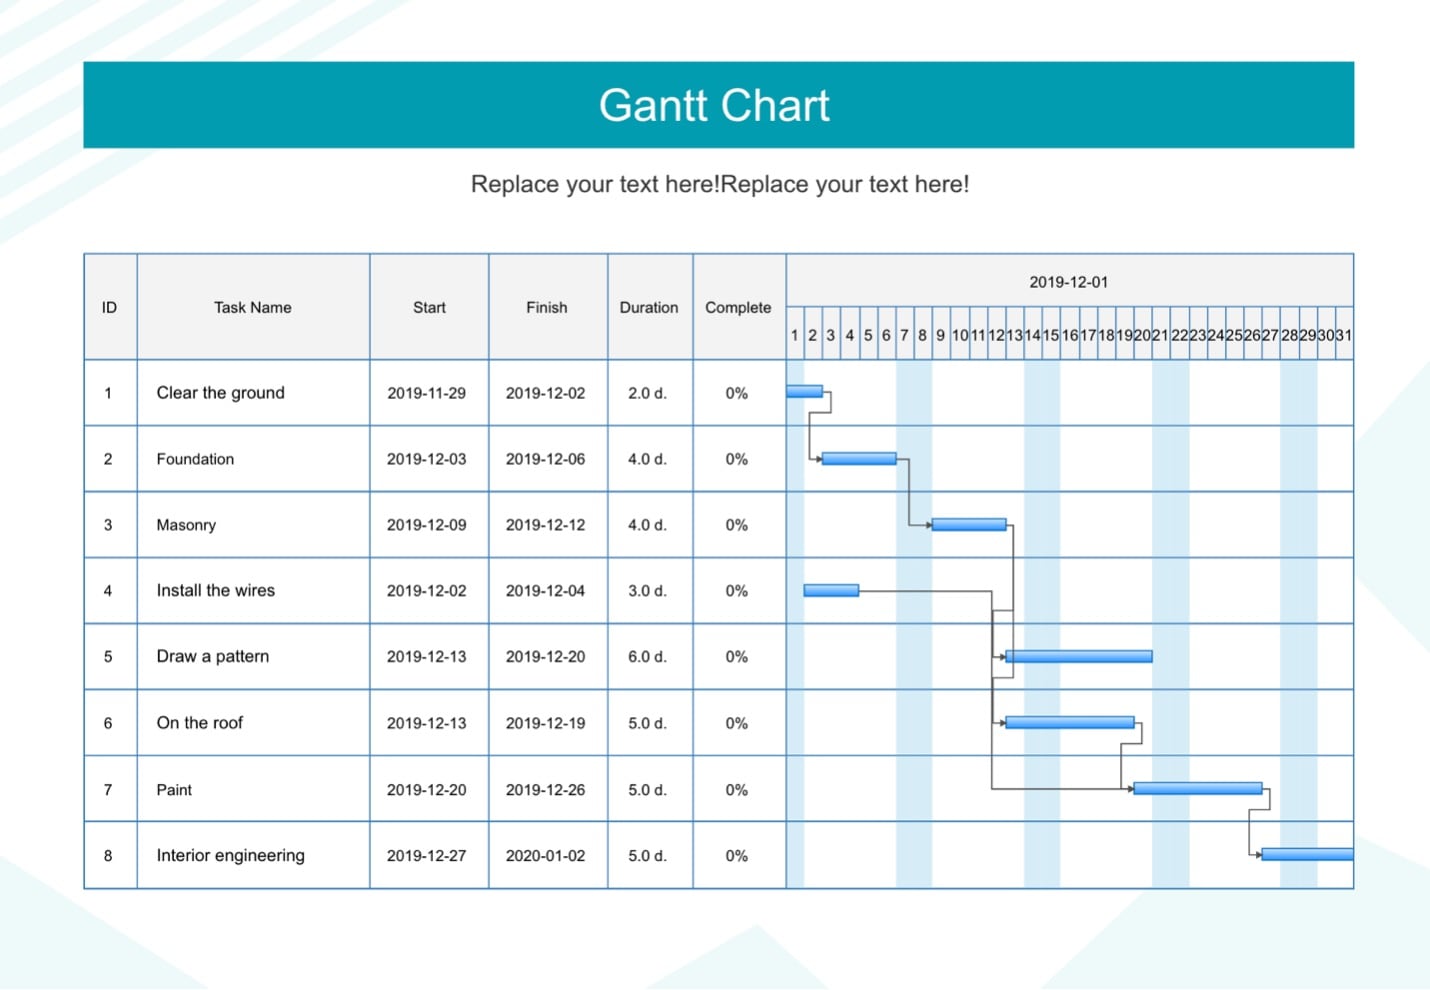
Gantt Chart for Building Construction
Embrace the simplicity of this classic Gantt chart template. It's ideal for project management across different industries. With its clear visual representation, you can efficiently track progress and manage tasks without unnecessary complexity.
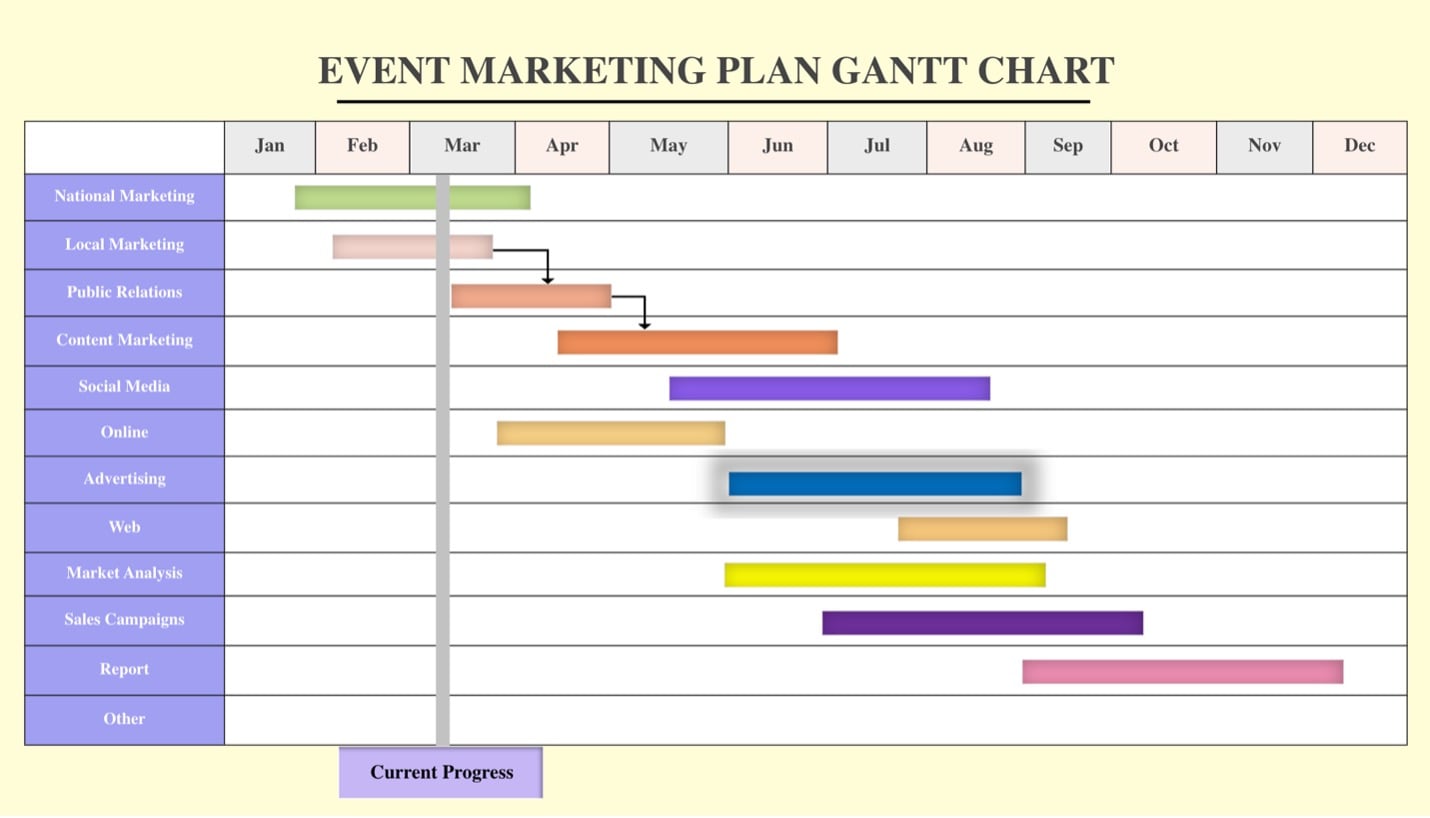
Gantt Chart for Event Marketing
Elevate your event planning game with the Event Marketing Gantt Chart template. This specialized layout is designed to streamline the intricate process of organizing and executing successful events.
Part V. FAQs About Creating Gantt Charts in Google Sheets
Navigating the world of Gantt charts in Google Sheets may raise a few questions. This section will address common queries to ensure your Gantt charting journey is smooth and productive.
Are Templates Available for Gantt Charts in Google Sheets?
While Google Sheets doesn't provide built-in Gantt chart templates, you can find downloadable templates online. These templates can help you jump-start your Gantt chart creation process.
Can I Add Labels or Additional Information to the Gantt Chart?
Absolutely. Google Sheets allows you to customize your Gantt chart by adding labels, descriptions, or notes to tasks. This enhances the clarity and comprehensiveness of your project timeline.
Can I Share the Gantt Chart and Collaborate With Others?
Certainly, Google Sheets makes collaboration easy. You can share your Gantt chart with team members, clients, or stakeholders. Multiple users can edit the chart simultaneously, fostering efficient collaboration and real-time updates.
EdrawMax also offers real-time collaboration features. Try it out and experience a more professional diagramming experience with your teammates.
Can I Use EdrawMax Templates for Google Sheets? And How?
Yes, EdrawMax offers a wide range of professionally designed Gantt chart templates that can be customized to fit your project needs. While EdrawMax is not directly integrated with Google Sheets, you can still create your Gantt chart in EdrawMax, export it as an image or PDF, and then insert it into your Google Sheets document.
Conclusion
As you wrap up your journey through Gantt chart creation in Google Sheets, remember that these visual tools are essential for project management. While Google Sheets offers a straightforward approach, EdrawMax takes your charting experience to the next level.
With its versatile templates and user-friendly interface, EdrawMax empowers you to create impressive Gantt charts that communicate your project timelines effectively. If you're looking for a professional diagramming tool, try EdrawMax. See how it can elevate your charting game today.
[没有发现file]


