


Diagrams are essential for science studies and research. In any branch of science, diagrams are commonly used to represent complex data and experiments visually. We use labeled science diagrams to show the shape, size, and features of objects and organisms. It also depicts chemical reactions and experiments in physics. Science drawings are only helpful when they are accurate and communicate precise data. For a scientist or a student, if the diagram is inaccurate, it will lead to poor results and failed experiments. When creating a science diagram, use diagramming software with the best customization tools, such as EdrawMax Online. You can draw illustrations, create charts and graphs, design science models, and make demographics using them. It helps you create your diagram quickly and effortlessly.
In this article
1. What is a Science Diagram?
Science Diagrams are copies of technical data that are typically drawn by scientists, based on their practical observations and studies, such as biological dissections, chemical experiments, geological analysis, or exploration of mechanics. It is all for visualization, which makes knowledge sharing so much easier and faster. Learn more about science symbols.
Science Diagrams carry a much different utility than imaginative or hypothetical artwork. While all forms of drawings and illustrations carry some kind of visual representation, that may be of an idea, message, or information, the prism of scientific diagrams is all about factual details, proffering a semblance of reality. Numerous types of science diagrams can be primarily categorized into the following types.
2. Types Of Science Diagram
1. Schematic Diagram
The objective of Schematic Diagramming is to interpret typically complex information and elements in an overtly simplified yet comprehensive manner. This sort of diagram uses symbolic and abstract lines, shapes, and text to convey information, instead of realistic pictures. Its common usages include electrical or circuit diagrams, mechanical and engineering components, or chemical diagrams denoting chemical symbiosis, molecular structures, equations, etc.

2. Graphs & Charts
There are many types of graphs and charts: line charts, bar charts, pyramid charts, funnel charts, etc. Charts can show data changes and detailed information visually. Find more chart templates.

3. Illustrations
Illustrations are the primitive form of scientific imagery, especially in the life sciences, that is perhaps as old as the parietal drawings from the Upper Paleolithic Era. There are many sub-categories to Science Illustration, signifying the different branches of Biology Diagrams, Technical Diagrams, and Ecological Diagrams, among others. Illustrations are the content of anatomical details, functions, behavior, symbiosis, and formation. Usually, illustrations have no use of graphs or charts; however, they might be combined with schematic details to complete a visual representation, with the definition of the function or point out different parts of a structure, for example, diagramming the microscopic animal cell.

As we learned about the main categories of science diagrams - schematics, charts, graphs, and illustrations, here’s more about the different domains in which they are utilized.
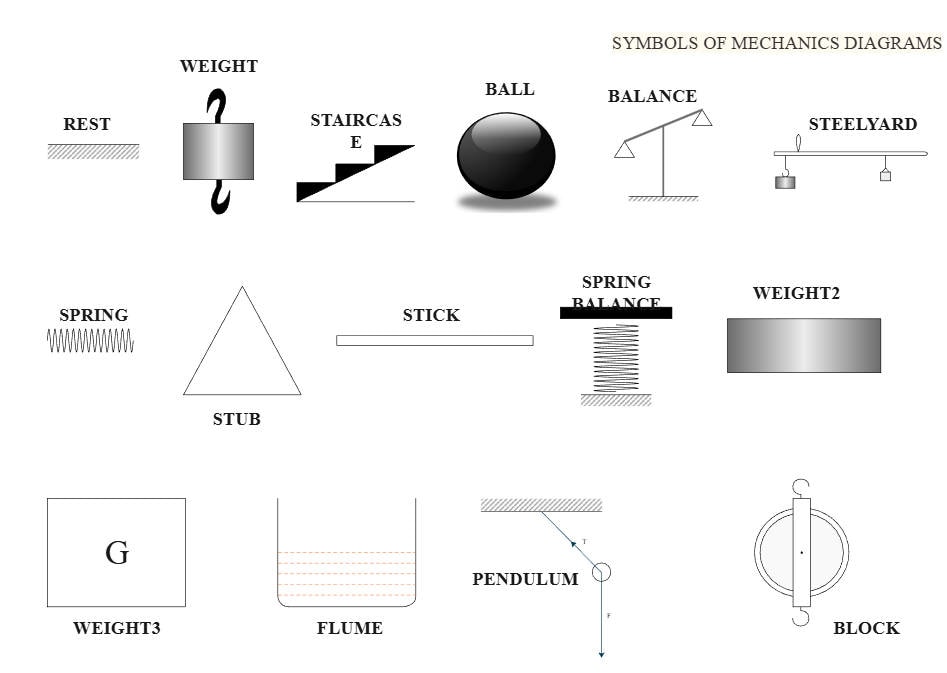
4. Mechanics Diagrams
Mechanic Diagramming is a sub-domain of physics diagrams that are comprised of schematics, graphs, and illustrations, to convey a process, design & engineering, or formation. Mechanical drawings vastly use lines and angular symbols that are easy to draw, in contrast to other complex structures and shapes used in science illustrations.
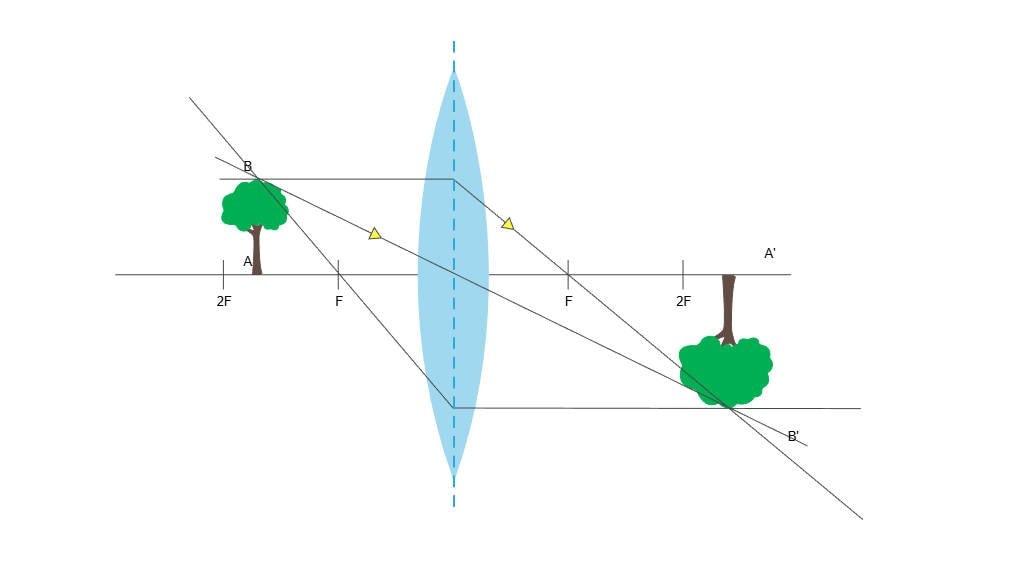
5. Optics Drawing
Optics drawings are largely used to explain the patterns and behavior of light, sound, magnetism, radioactivity, and such “spectrums” that may be visible or invisible. Usually, schematics are used to show angles, progressions, reactions, etc. sometimes there may be illustrative symbols such as the image of the Sun, or a surface, to complete the project.
6. Natural Illustrations
Natural diagrams use illustration and pointing techniques to achieve two goals: detailed visualization of a structure, matter, etc., and define its functions. It largely revolves around anatomies, process orientations, and optics. Natural diagrams represent the sub-domains of medical illustration, botanical illustration, and geological illustration.

The domain of Science is dispersed and vast. However, all the many branches and their applications can trace back to the three main categories of Biology, Physics, and Chemistry.
7. Chemistry Diagrams
Diagrams used in Chemistry include schematic equation diagrams, or illustrative diagrams of laboratory equipment, or charts and graphs to show variations between chemicals. Some of the significant diagramming examples in chemistry include the Benzene Diagram, Molecular Models, and Structural Formulae.
8. Physics Diagrams
Physics uses mostly optical diagrams and mechanical illustrations to denote atomic behavior, spectroscopy, and quantitative details. The most significant use of optic diagrams is used in physics studies and projects, along with variations of graphs and charts, such as Jablonski diagrams, Kinematic diagrams, and UML diagrams.

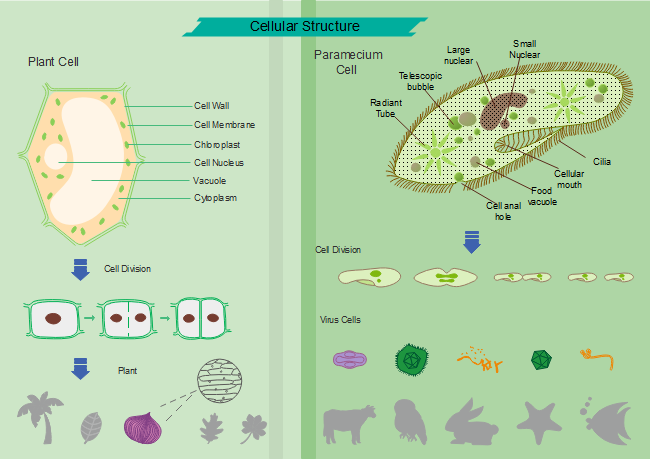
9. Biology Diagrams
Biology diagrams are perhaps the most complex and widespread subject in the Science Illustrations and Diagramming domain. Making it worthwhile with just about anything, from heavily detailed hand-drawn illustrations, to optics drawings, and schematic pointers, so that we can learn more about the most important lessons about life and life science. The most popular biology diagram is about anatomy drawing, which could be about cells, bone structure, or the human skull, as well as processes like the respiratory system or photosynthesis.
3. Why are Science Diagrams Important?
Science diagrams play a key role in enabling a learner to conceptualize technical facts such as anatomy, quantitative data, mechanisms, chemical equations, etc. Diagrams are sometimes the ultimate source of knowledge sharing, since one cannot imagine what they have no idea or intuition about, and one can hardly have an idea of something they haven’t ever seen, such as the anatomy of the brain or the formations of tectonic plates. A teacher cannot fully convey the knowledge without the supplementary diagrams.
Many study materials often use photographs, but diagrams are different in terms that they achieve both a visual concept as well as define elements like functionality, cycle, or behavior. Diagrams are not readily an interpretation of how the subjects look, which can only be achieved with a photograph, but rather to stimulate the obtrusive details, such as the human digestive system, or velocity. Therefore, for a 10-year old pupil, it is easier to conceive the incredible information that is gathered by the more mature and skillful work of a scientist, following intrinsic studies.
4. Science Diagram Examples
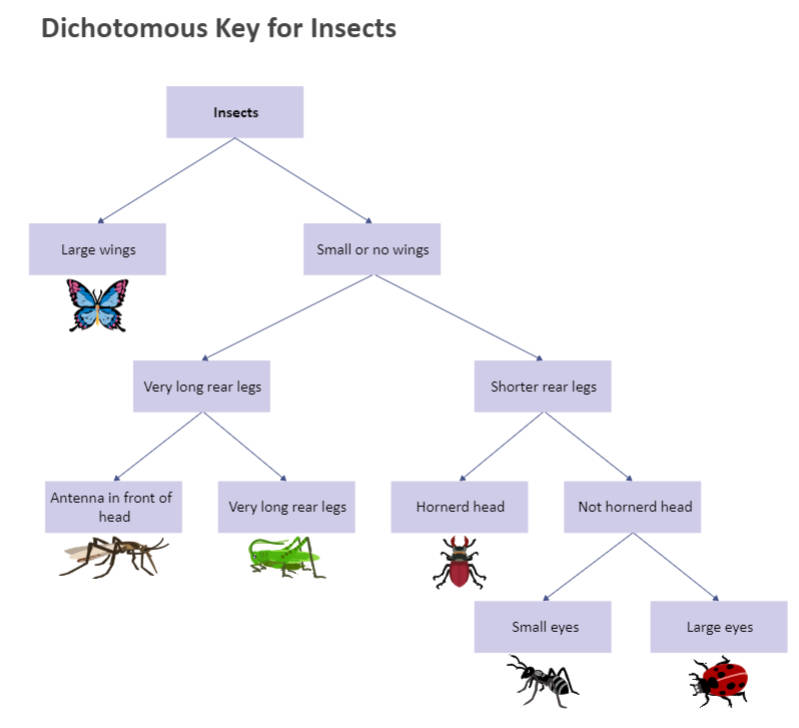
Science Drawing
The science drawing in this example illustrates a dichotomous key for insects. It classifies insects into various groups based on specific features, each pair of two. You can see that the diagram starts with a group named insect. The next step divides the group into two sub-groups based on the size of insect wings. Next, it further divides each sub-group in to two other groups and goes on till it reaches the fifth step. Creating this diagram is simple, and any reader can get the general idea of the diagram at a single glance.
Lab Diagram
The lab diagram in this example illustrates the experiment of burning red phosphorus. It depicts the chemical reaction using icons to depict lab equipment and labels to name components involved in the experiment. The burning red phosphorus flares yellow at oxygen atmosphere, and the diagram represents that with a yellow flame icon to make it easier to understand for any reader. At the end of the reaction, you can see the mist at the flask walls. You can also illustrate any experiment you want by using the symbols and icons in the EdrawMax library or using templates.

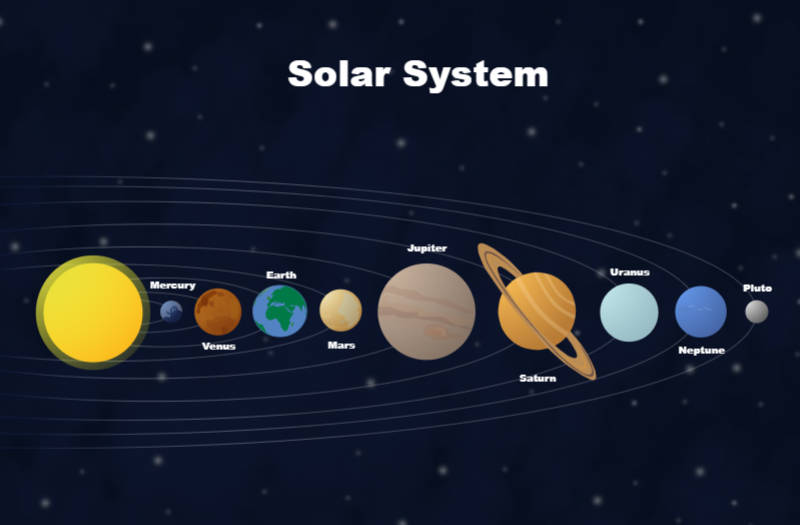
Solar System Diagram
This diagram in this example depicts our solar system. This type of solar system diagram is commonly used to introduce students to our solar system. There are not many written details in the diagram, and you can only see the planets, the sun, and the orbits. It is the most basic solar system diagram that tells students the order of planets in the solar system and their size differences. You can see that Jupiter is the largest, while Pluto is the smallest planet in the diagram, and Earth is the third nearest planet to the sun.
5. How to Design a Science Diagram With EdrawMax?
The best thing about EdrawMax is that it is not only easy to learn but is also simple to use. The suite uses vector-based clip art of various illustrative symbols like organs, chemical apparatus, objects, etc., as well as graphs, charts, and schematic diagrams, that are altogether sufficient to give you a complete resource of science diagramming, where you, as a user, just have to mix and match and adjoin the various elements to create a whole project. Here you can find detailed steps on how to draw a science diagram.
- Launch Edraw software from your PC/Laptop
- Go to >>File<< tab on the top left
- Select the category “Science.”
- Select an appropriate domain like chemistry, physics, or biology, and click on “Edit".
- Use the given images, symbols, shapes, and other characters to drag and drop into the worksheet
- Arrange them by the same drag-and-drop technique, and complete your project
- Once you are done, you may save the work on your PC drive, or publish it elsewhere, like social media, or email it.
6. Tips on Making a Stunning Science Diagram
- Launch Edraw software from your PC/Laptop
- Keep it simple. Science drawings are about technical accuracy, so it is probable to avoid decorative fonts or using too many colors and dynamic graphics. Stick to the fundamental goals.
- Explore custom shapes. Make the same diagram in different styles. This way, you’ll not only hone your skills but also make your project stand out from stereotyped lessons.
- Pay attention to a well-contrasted background. The background color should not obstruct the clarity of your diagrams, especially when you are using multiple colors.
- Use text boxes. For definitions, it is best to tuck it in the text box and keep it away from the lines of the diagram, with a single arrow.
- Use thematic colors. Choose color schemes instead of random ones to keep your diagrams organized and superior.
- Do not deviate from rules. Diagramming does require artistry, but you must not deviate from the conventional standards. Especially when you are working with instructional diagrams, where people largely follow a specific standard.
So go ahead! Use the best resources to create superior diagrams. Make your work do the talking, whether in school or at the workplace.
AI Diagram Generator
Enter your prompt. Upload files if needed. Generate diagrams, charts, or slides instantly.


