Swimlane flowcharts are not only an effective visual tool for illustrating processes and workflows, but they also provide a clear and organized representation of the various individuals or departments involved in a given process.
Whether you are a project manager, a business analyst, or simply looking to improve process efficiency, understanding the ins and outs of Swimlane flowcharts is essential for effective process mapping and analysis.
In this article, we will research more about key components, benefits, and best practices of swimlane flowcharts, equipping you with the knowledge needed to effectively utilize this powerful visual tool.
In this article
Swimlane Flowcharts: An Overview
Swimlane flowcharts are a useful tool for visualizing processes and workflows. They divide the flowchart into lanes, representing different individuals or departments involved. Symbols are used to represent actions, decisions, data, and connectors.
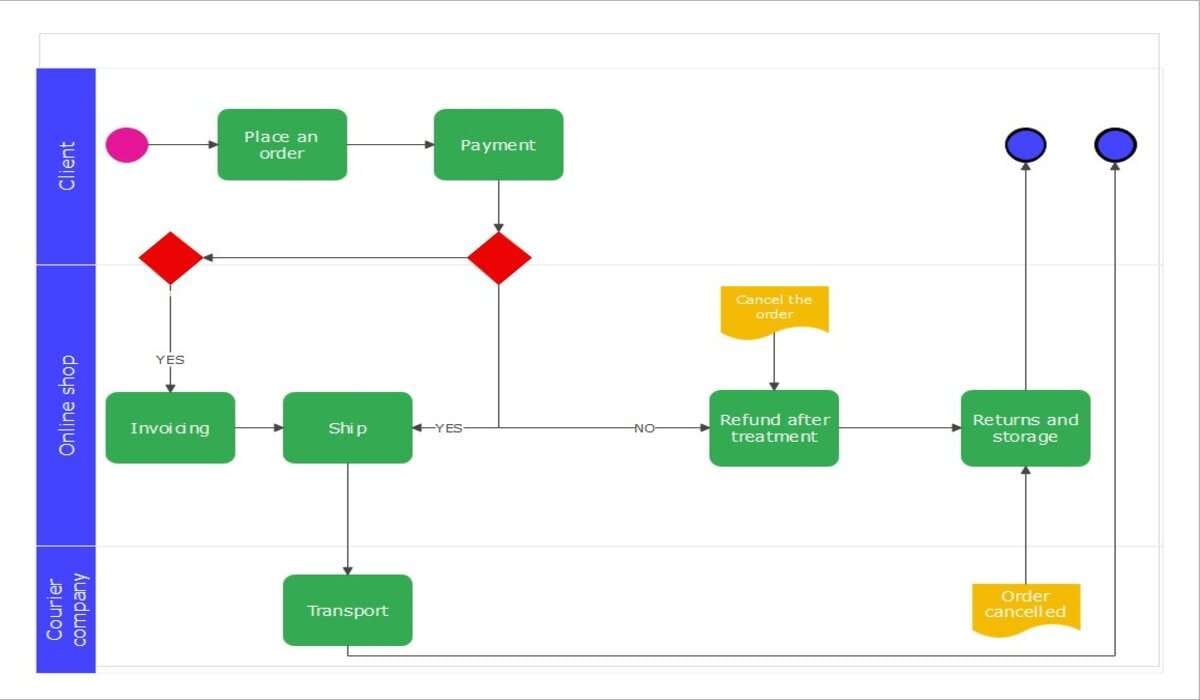
By organizing these symbols into swimlanes, flowcharts provide a clear overview of how a process works. They help identify bottlenecks and areas for improvement. Swimlane flowcharts are widely used in various industries to streamline processes and enhance productivity.
Swimlane Flowcharts Symbols
Swimlane flowcharts are used to visually represent processes and workflows. They are divided into lanes, which represent different individuals, departments, or organizations involved in the process. Here are the symbols commonly used in swimlane flowcharts:
- Process symbol: Represents an action or step in the process, depicted as a rounded rectangle.
- Decision symbol: Represents a decision point, depicted as a diamond shape.
- Start and end symbols: Mark the beginning and end of the process, depicted as rounded rectangles or arrows.
- Document symbol: Represents a generated or used document or report, depicted as a rectangle with a wavy line.
- Data symbol: Represents inputted, stored, or outputted data, depicted as a parallelogram.
- Connector symbol: Connects different parts of the flowchart, depicted as a small circle or dot.
- Delay symbol: Represents a delay or waiting time, depicted as a half-circle or semi-circle.
- Loop symbol: Represents a loop or repetition, depicted as a rectangle with curved corners and an arrow looping back.
- Off-page connector symbol: Connects different pages or sections, depicted as a small rectangle with a number or letter inside.
Best Online Tools to Create Swimlane Diagrams
Some of the best online tools to create Swimlane diagrams are discussed below:
1. Wondershare EdrawMax
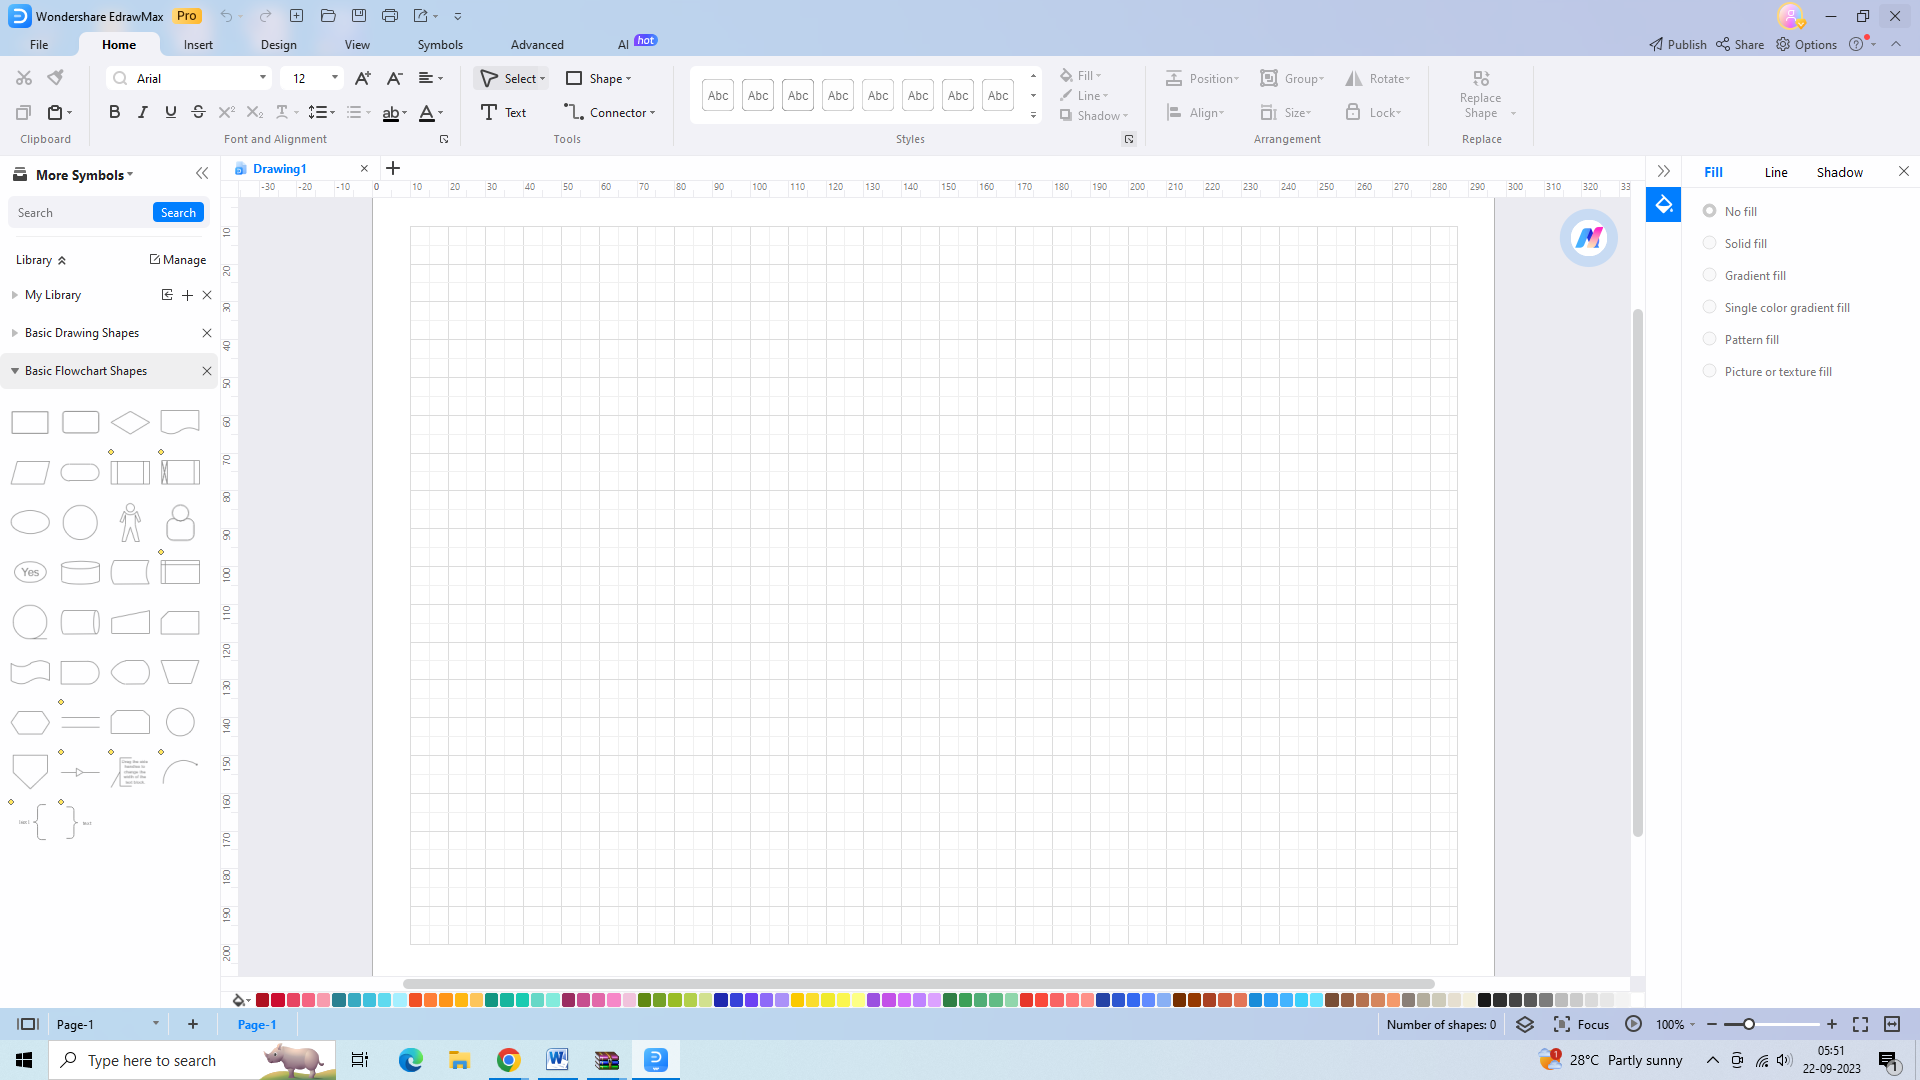
Wondershare EdrawMax is not only a user-friendly online tool but also a highly versatile platform for creating swimlane diagrams. With its extensive collection of templates and symbols, EdrawMax simplifies the process of creating cross-functional diagrams, making it accessible even for beginners. By offering a drag-and-drop interface, EdrawMax ensures a seamless and intuitive diagramming experience, allowing users to effortlessly arrange and connect elements.
Features:
- Extensive library of swimlane diagram templates.
- Easy customization with various symbols and shapes.
- Real-time collaboration and sharing options.
- Cross-platform support for Windows, Mac, and Linux.
Pros:
- User-friendly interface for easy diagram creation.
- A vast collection of templates and symbols.
- Real-time collaboration enhances teamwork.
Cons:
- Some advanced features may require a learning curve.
- Limited free version with watermarked diagrams.
Compatibility: Windows, Mac, Linux.
2. Cacoo
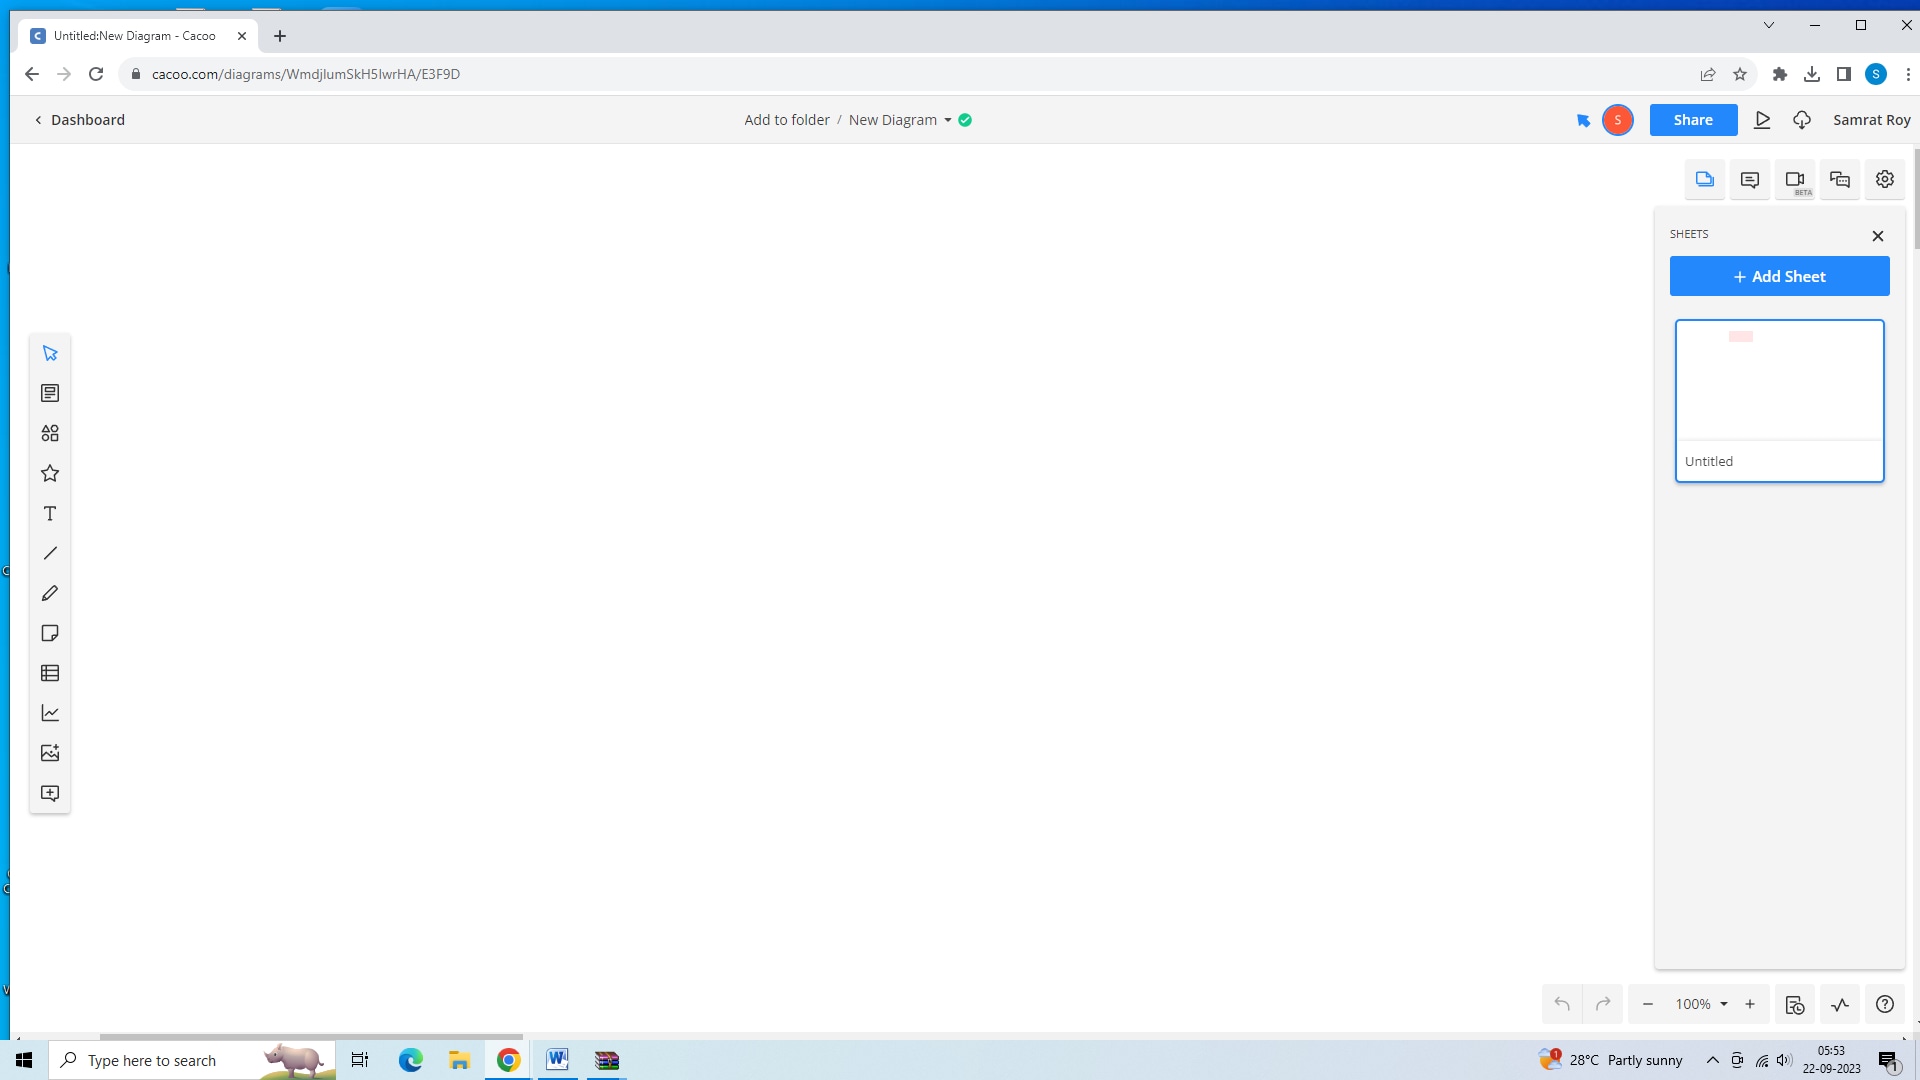
Cacoo is not only an intuitive online tool but also a powerful platform that empowers users to effortlessly create swimlane diagrams.
With its user-friendly interface and drag-and-drop functionality, Cackoo simplifies the diagramming process, allowing users to easily arrange and connect elements within their swimlane diagrams.
Furthermore, Cackoo offers a wide range of customization options, giving users the ability to personalize their diagrams with different colors, shapes, and text styles.
Features:
- Easy-to-use interface with drag-and-drop functionality.
- Customizable swimlane diagram elements.
- Collaboration features for real-time teamwork.
- Export options in multiple formats for easy sharing.
Pros:
- Simple and intuitive interface.
- Customization options for personalized diagrams.
- Real-time collaboration enhances teamwork.
Cons:
- Limited template options compared to other tools.
- Some advanced features are missing.
Compatibility: Windows, Linux, MacOS, and Web browser.
3. Sketchboard
Sketchboard offers a user-friendly interface that makes it easy for individuals or teams to create swimlane diagrams. With a variety of drawing tools and templates available, users can customize their diagrams to suit their specific needs. Whether it's for project management, process mapping, or visualizing workflows, Sketchboard provides a convenient and efficient solution for diagram creation and collaboration.
Features:
- Real-time collaboration for seamless teamwork.
- Infinite canvas for unlimited diagram size.
- Drawing tools and templates for easy customization.
- Integration with popular project management tools.
Pros:
- Real-time collaboration enhances teamwork.
- Easy customization with drawing tools and templates.
- Integration with project management tools streamlines workflow.
Cons:
- The interface is a little overwhelming for beginners.
- Advanced features may require some learning.
Compatibility: Windows, Linux, MacOS, and Web browser.
Steps to Prepare Swimlane Flowcharts in EdrawMax
Creating a Swimlane flowchart in EdrawMax is a simple process that involves a few key steps. By following these steps, users can easily prepare a well-organized Swimlane flowchart to visually represent processes or workflows. The steps to prepare a Swimlane flowchart in EdrawMax are discussed below:
Step 1: Determine the flowchart purpose
Begin by clearly defining the purpose of your swimlane flowchart, and identifying the specific process or workflow you want to illustrate. Take time to analyze the process, understand its inputs, outputs, and key steps. This ensures effective communication with the intended audience. Now open EdrawMax.
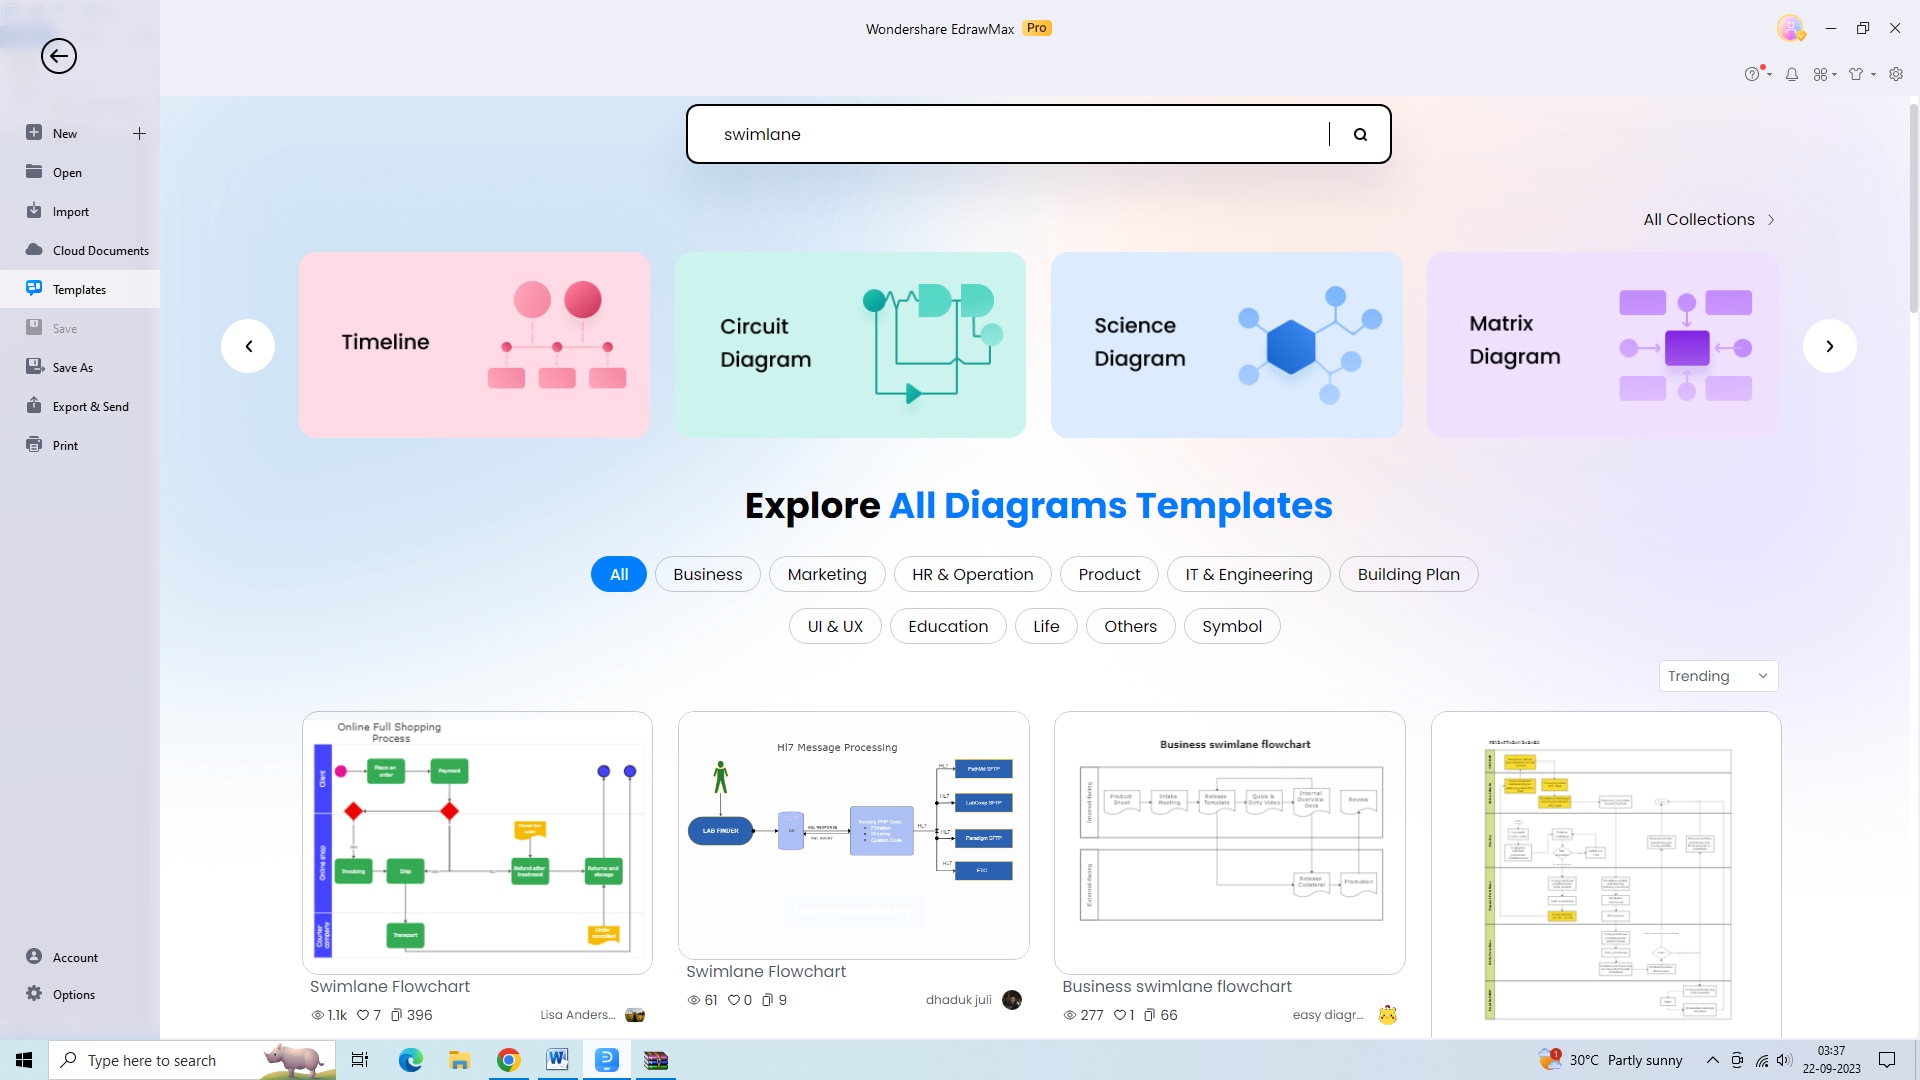
Step 2: Start with Swimlane template
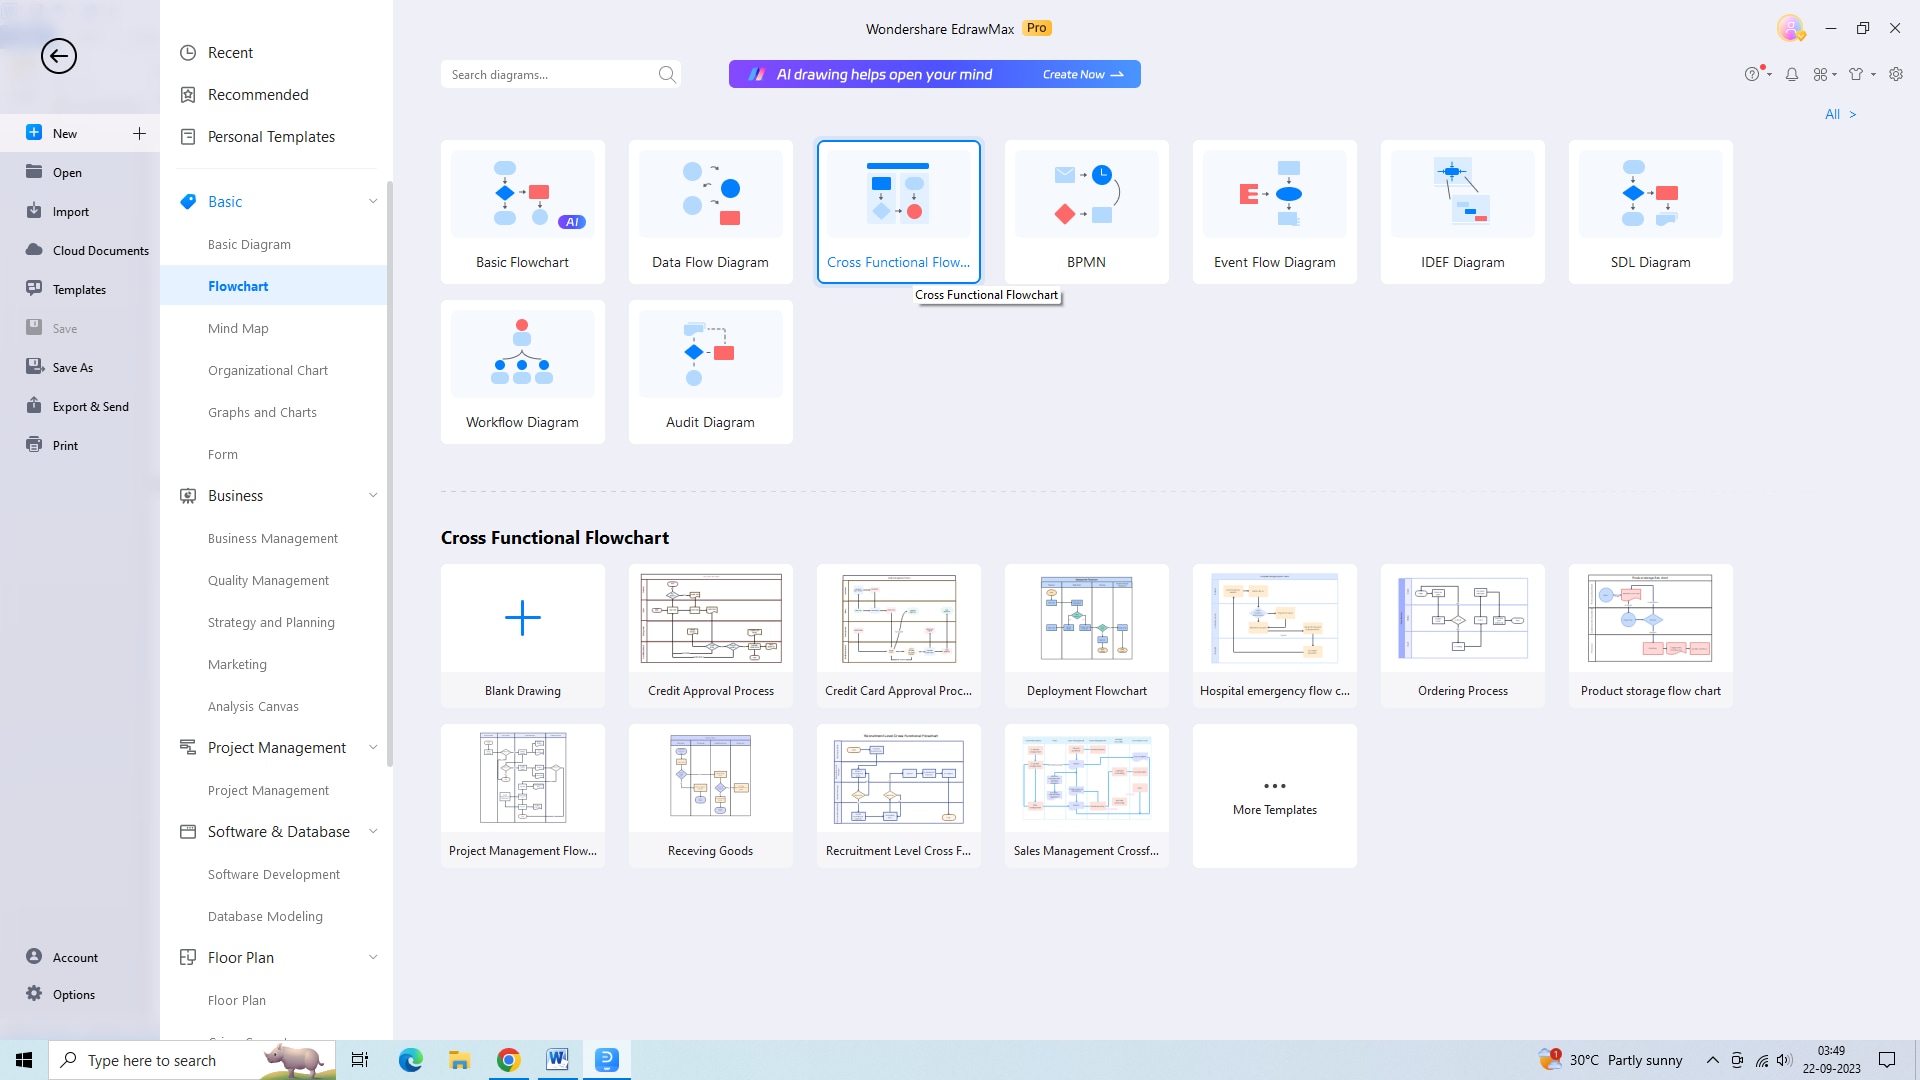
After opening EdrawMax, select a swimlane template matching your envisioned structure. You need a cross-functional flowchart for creating a swimlane flowchart. Consider the number of lanes, orientation, and required symbols. Choosing the right template saves time and effort.
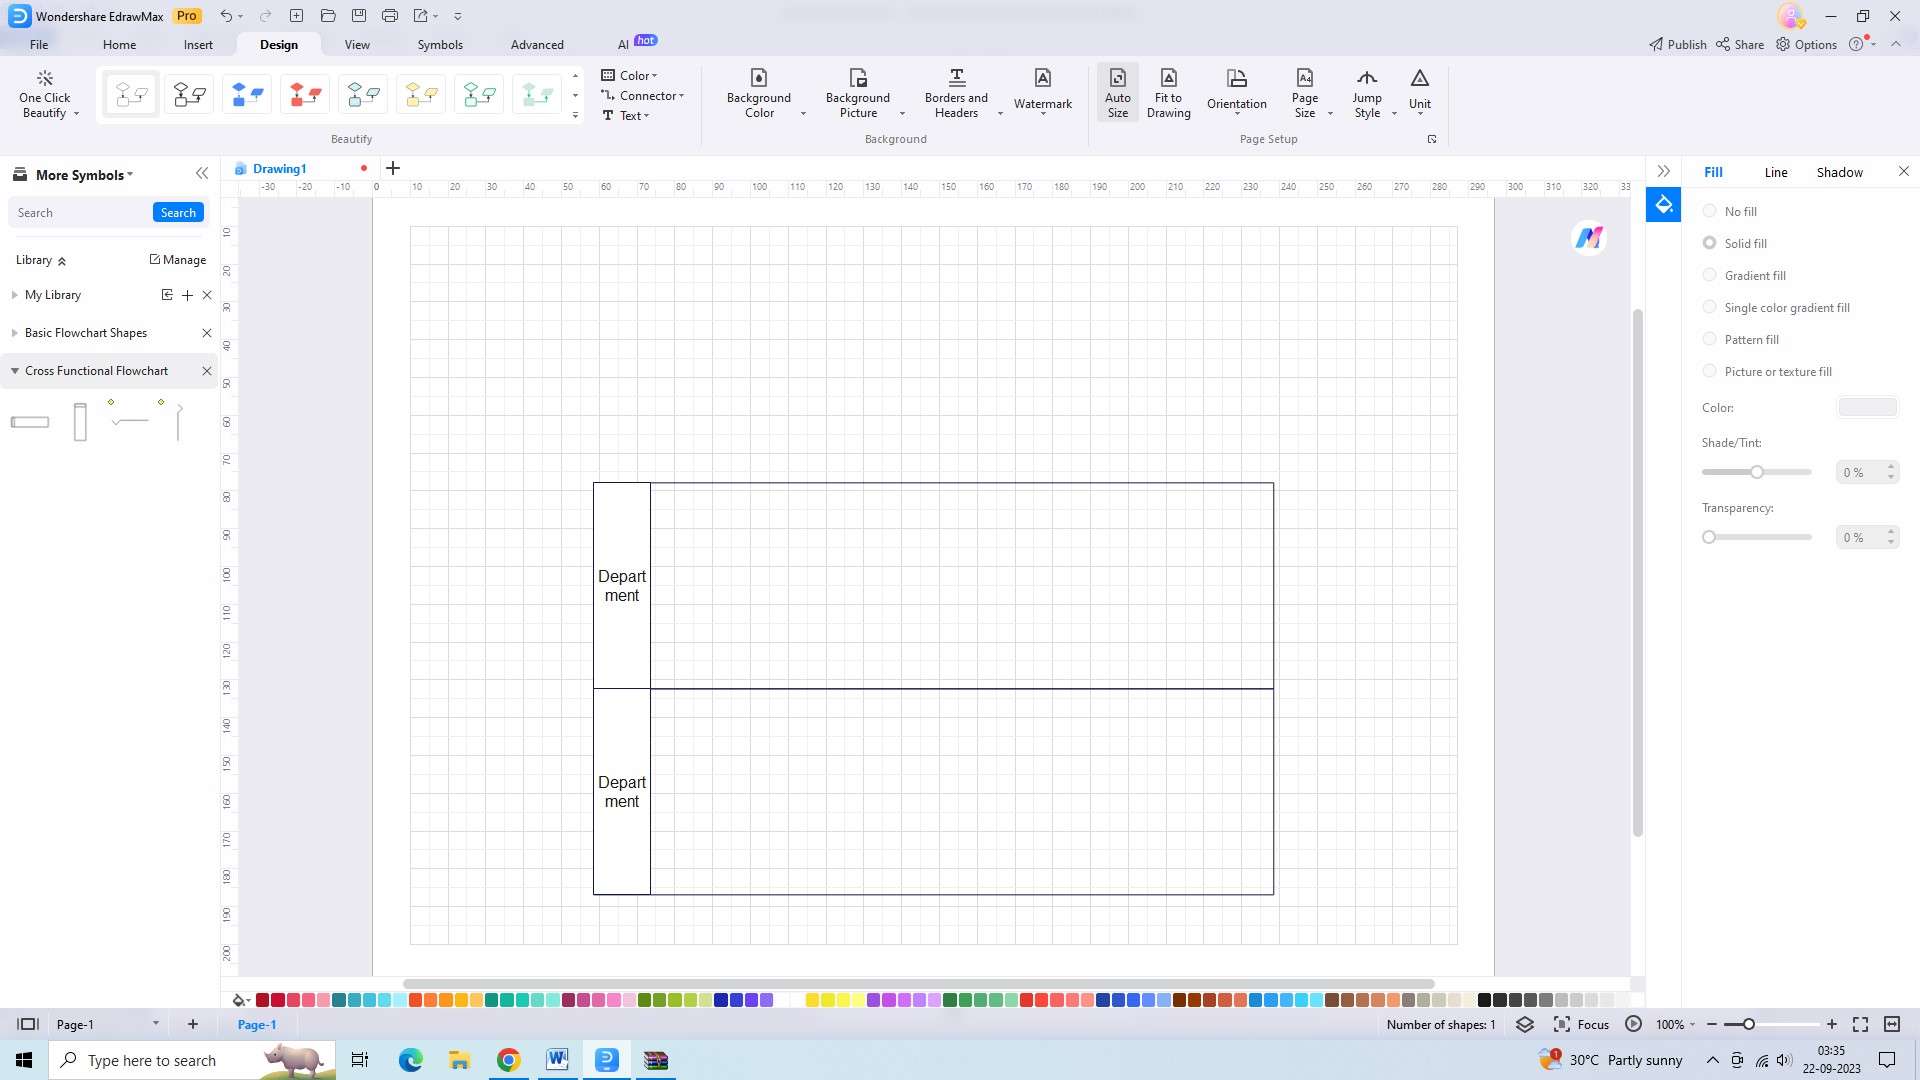
Step 3: Add symbols and shapes
Enhance your swim lane flow chart by adding appropriate symbols and shapes from EdrawMax's extensive library. Drag and drop symbols to represent activities, decisions, start and end points, data inputs and outputs, and more.
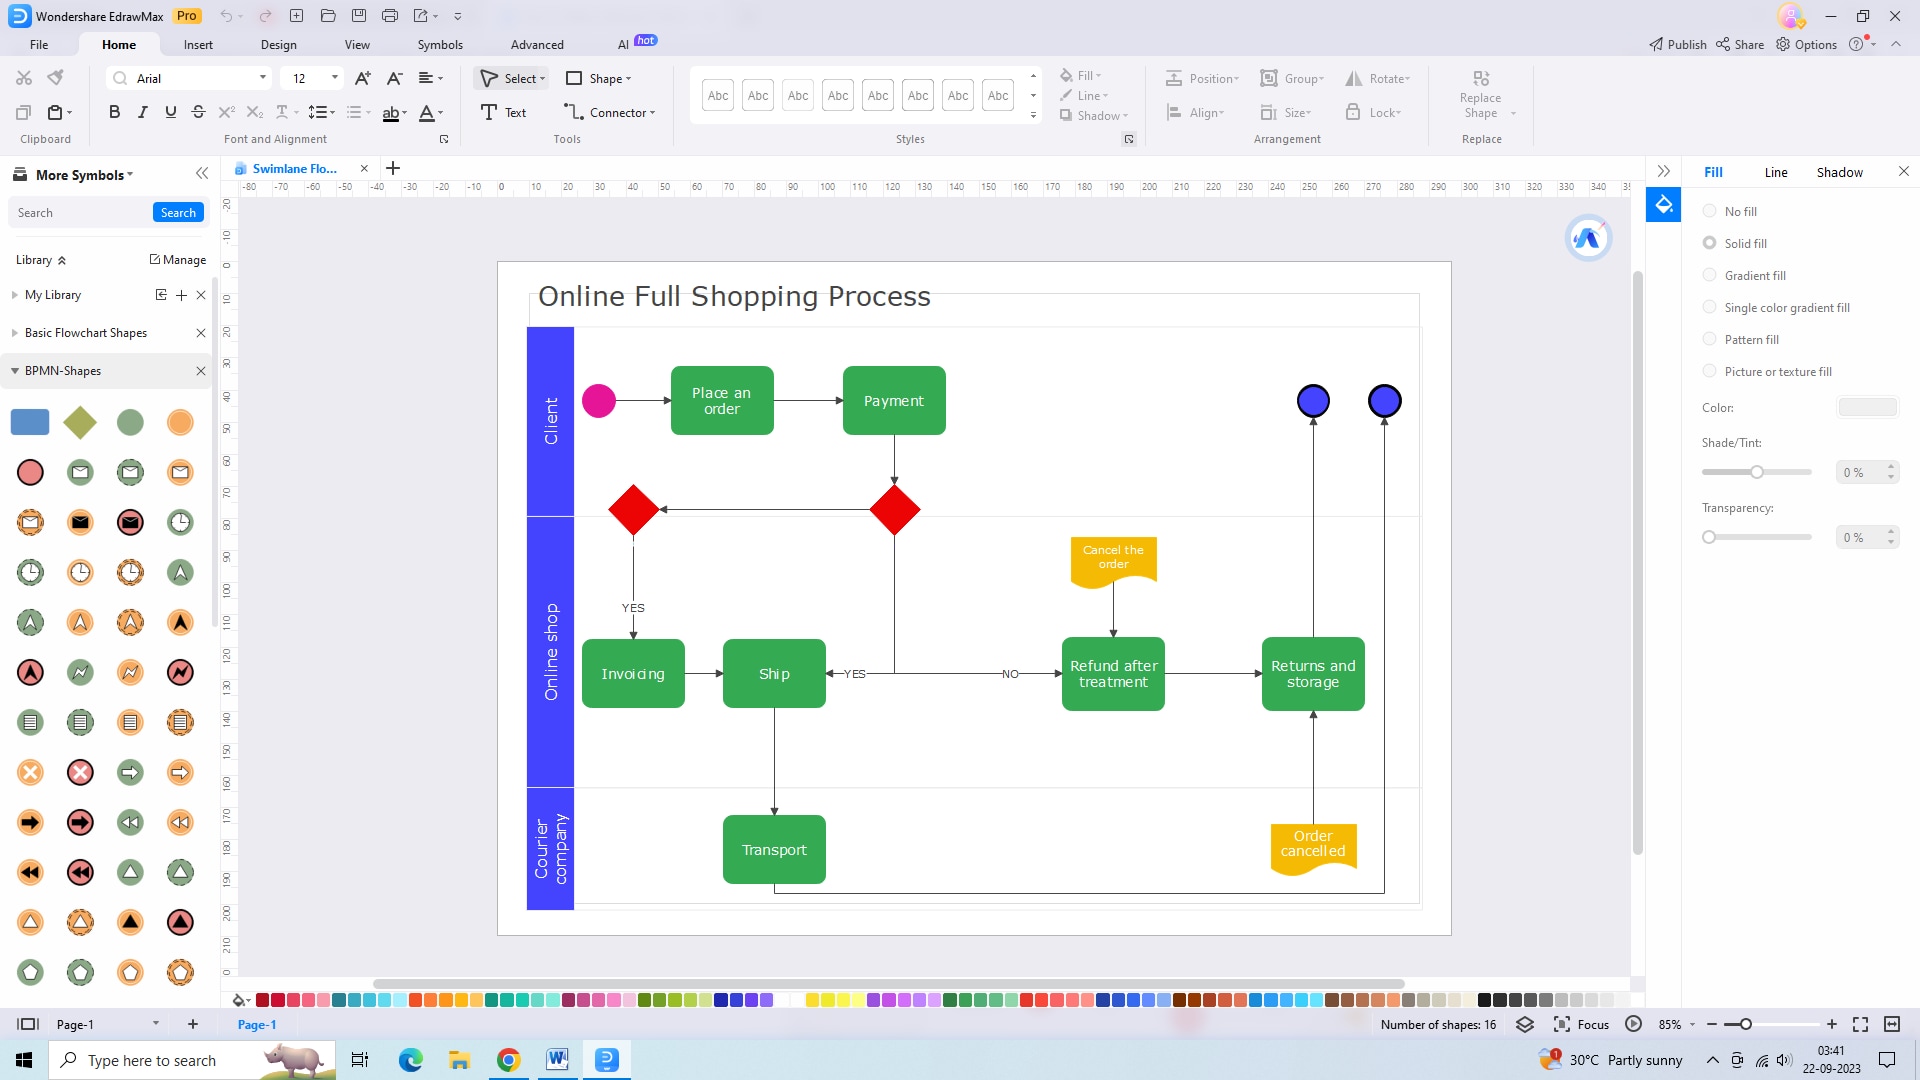
Step 4: Connect the shapes with arrows and lines
Create a logical flow by connecting shapes with arrows, indicating the sequence of steps within each swimlane. Connect the symbols to accurately represent the process flow and allow viewers to understand the workflow.
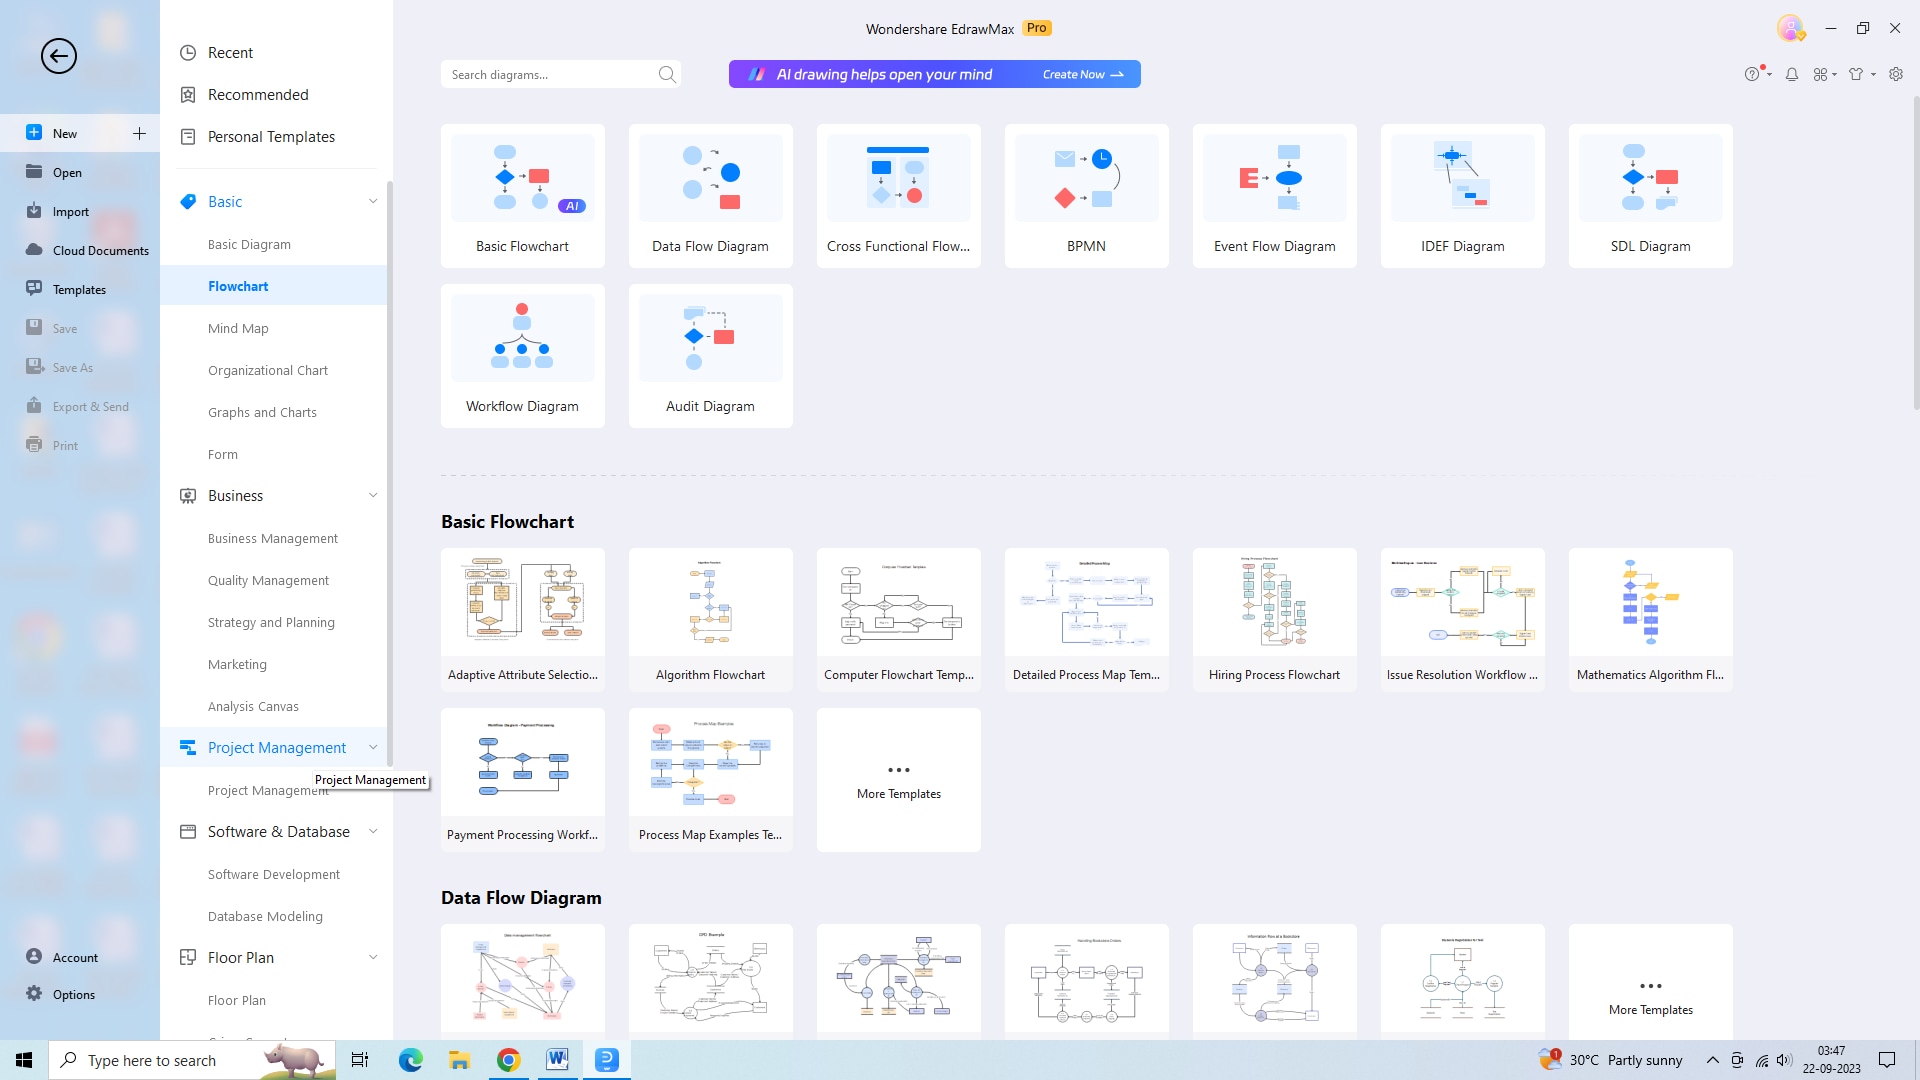
Step 5: Add decisions or Divide paths
Incorporate decisions or branching points in your swimlane flowchart to represent different paths or outcomes. Add decision symbols or diamonds, then connect possible outcomes or paths with arrows or lines. Visualize the decision-making process.
Step 6: Modify the appearance of flowchart
Customize the appearance of your flowchart by adjusting colors, fonts, and styles. Use contrasting colors to differentiate swimlanes, highlight important elements, and emphasize the process flow. Consistent formatting contributes to clarity and professionalism.
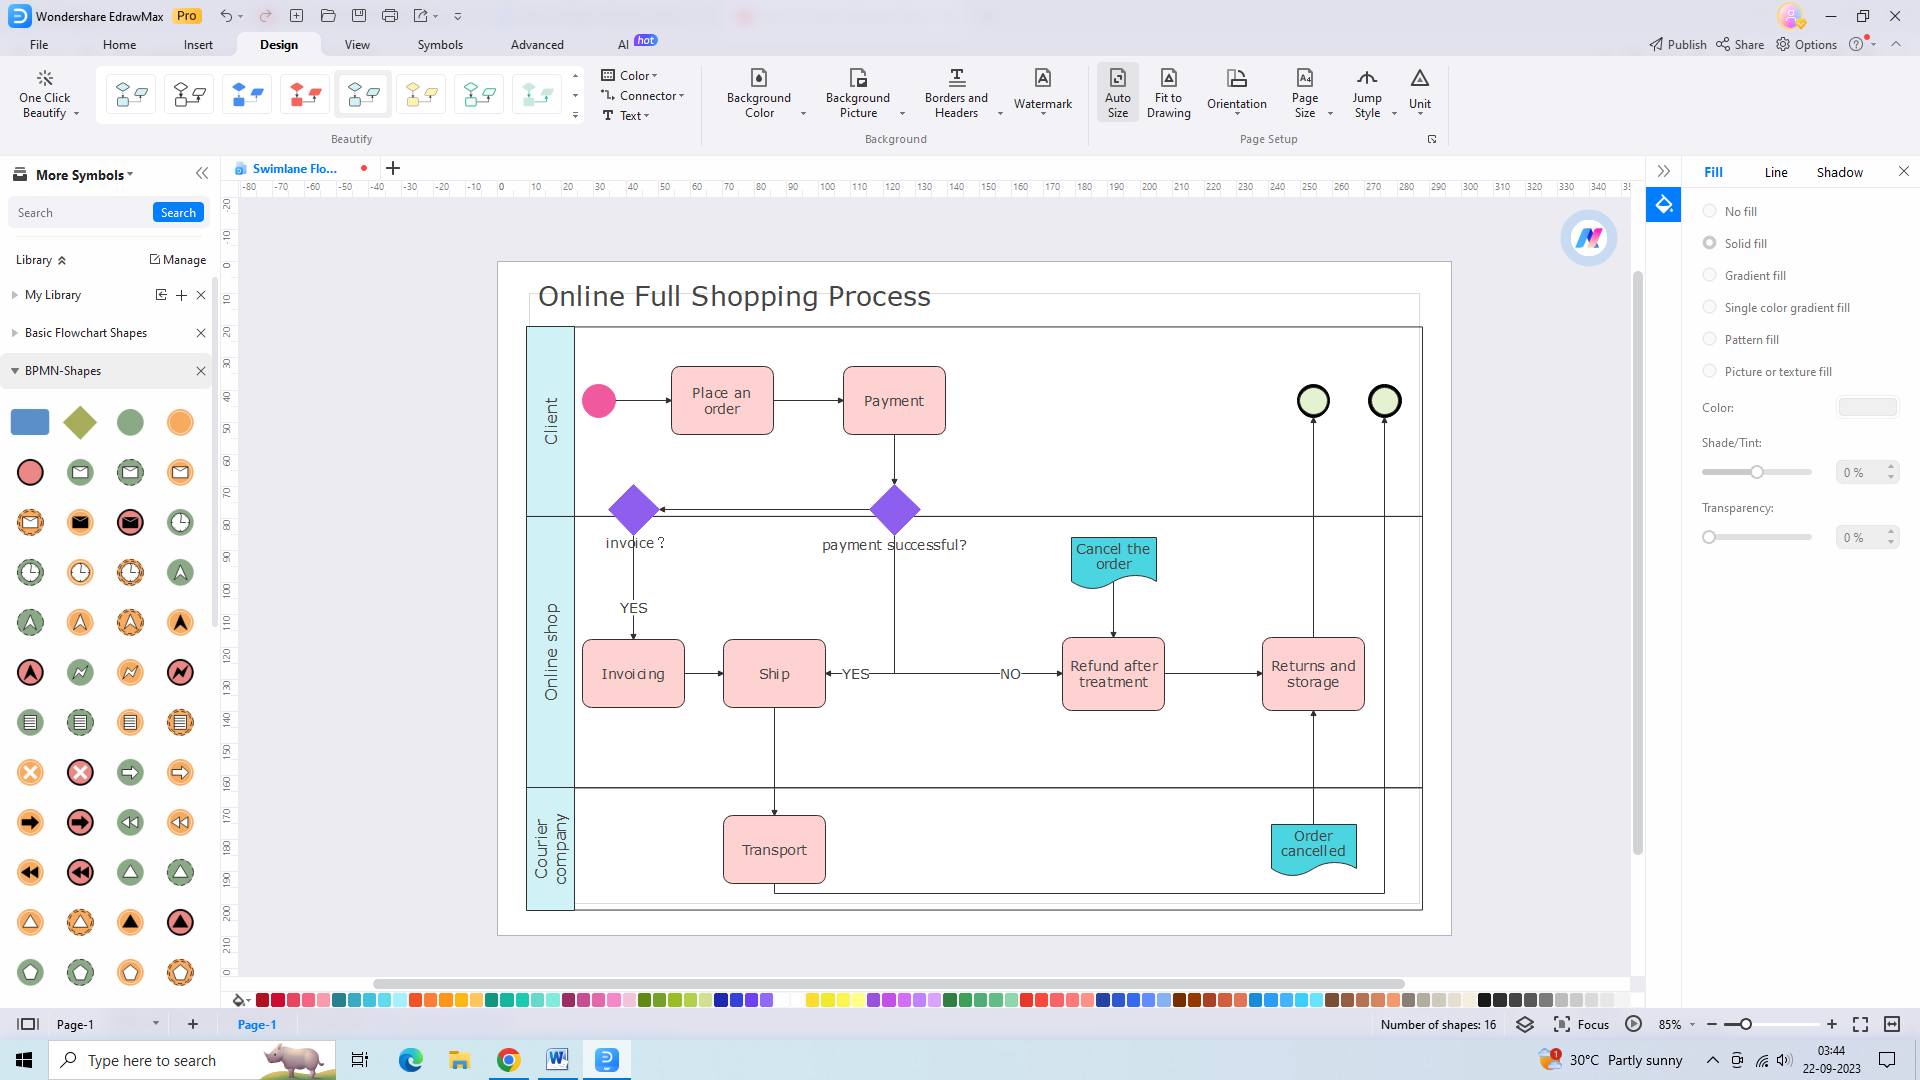
Step 7: Share or download the flowchart
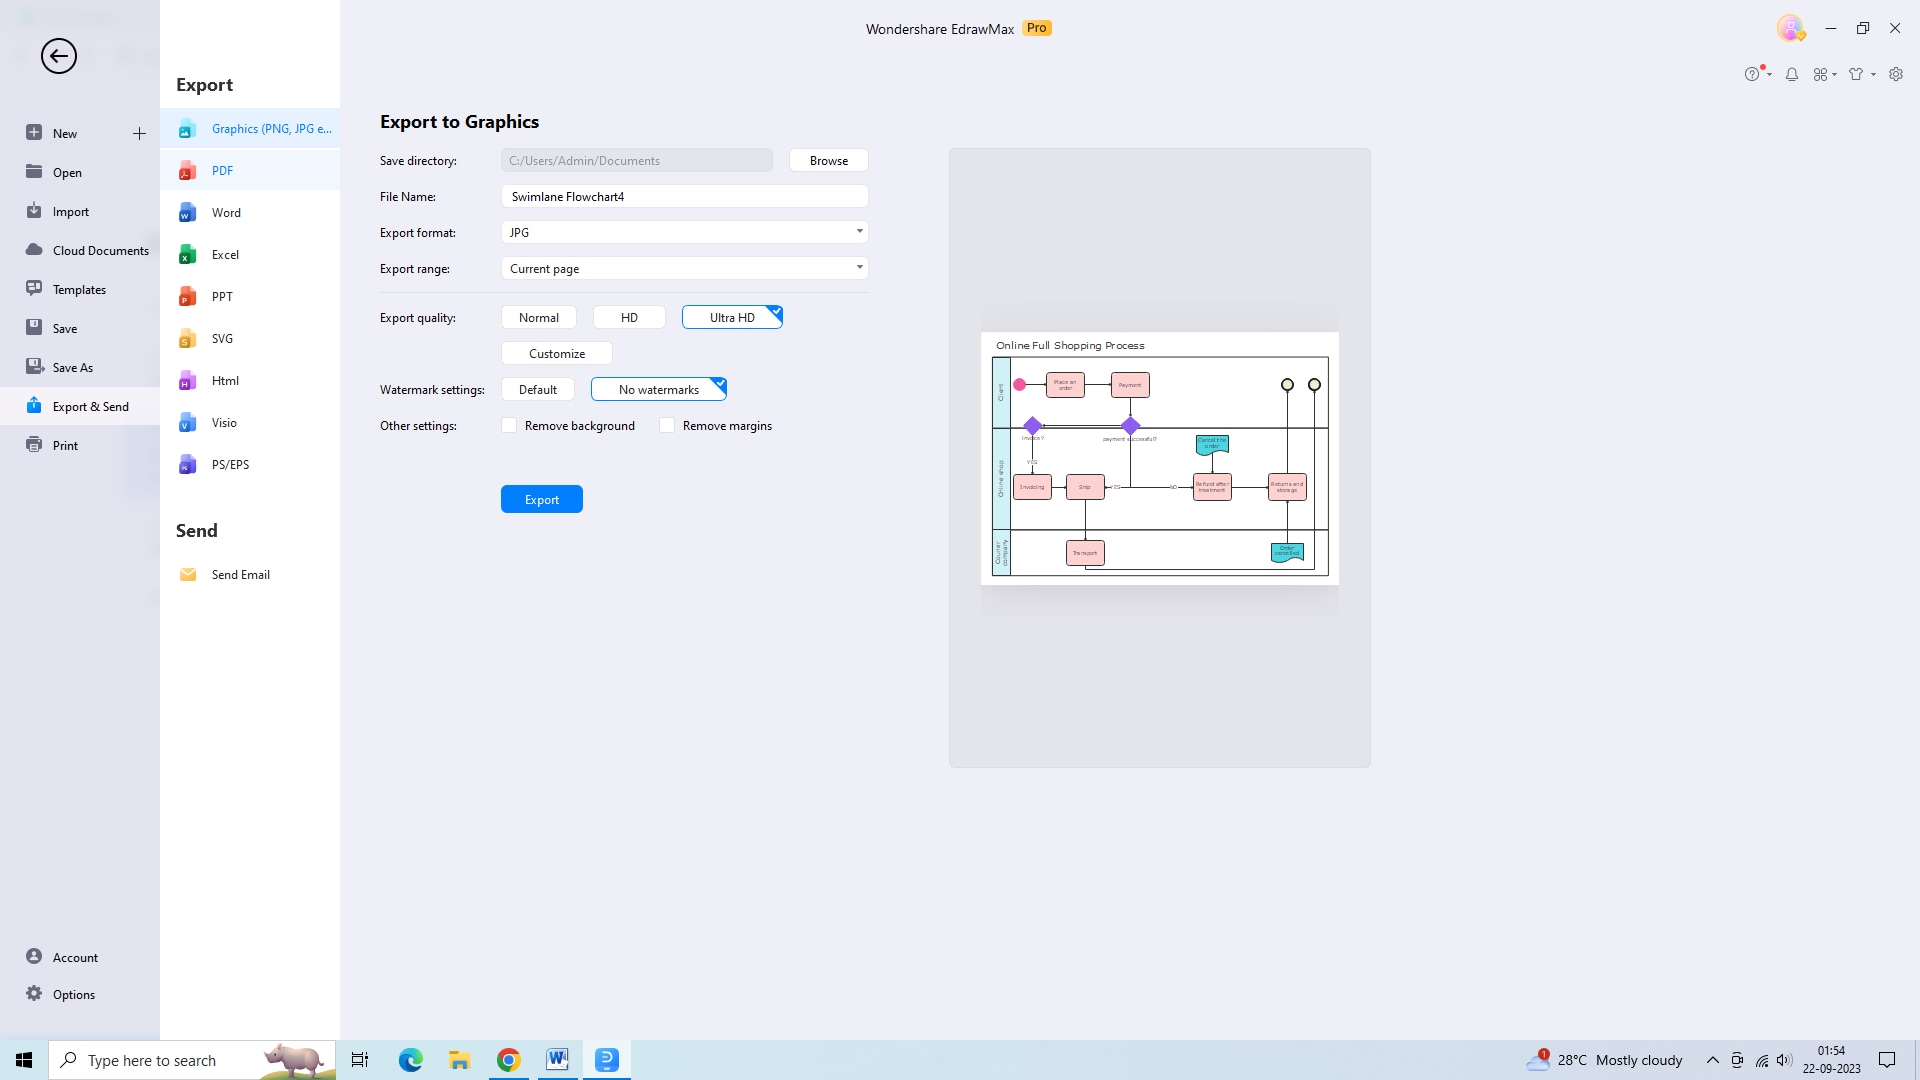
Share your swimlane flowchart by exporting it as a PDF, image file, or printing it. Consider the preferences and requirements of your audience. Save it for future reference.
Bonus: Add interactive elements
Add interactivity using EdrawMax's features like hyperlinks, tooltips, and attachments to enhance engagement. Hyperlinks provide additional resources, tooltips offer explanations, and attachments provide supporting documents. These elements enhance clarity and user experience.
Final Words
Swimlane flowcharts are an effective way to visualize processes and workflows. By dividing the flowchart into lanes and using symbols to represent different elements, they provide a clear overview of how a process works. This helps identify bottlenecks and inefficiencies, leading to improvements in productivity. With the help of online tools like Wondershare EdrawMax, creating swimlane flowcharts has become easier and more accessible.


