Transform the way your company operates with a meticulously designed manufacturing organizational chart, crafted effortlessly using EdrawMax. This guide is your key to redefining efficiency and productivity. By implementing a strategically structured framework, you'll optimize workflows and empower your team for success.
Bid farewell to operational hindrances and welcome an era of flawless operations. Uncover the mastery of organizational excellence with EdrawMax!
Contents of this article
Part 1. What is a Manufacturing Company Organizational Chart
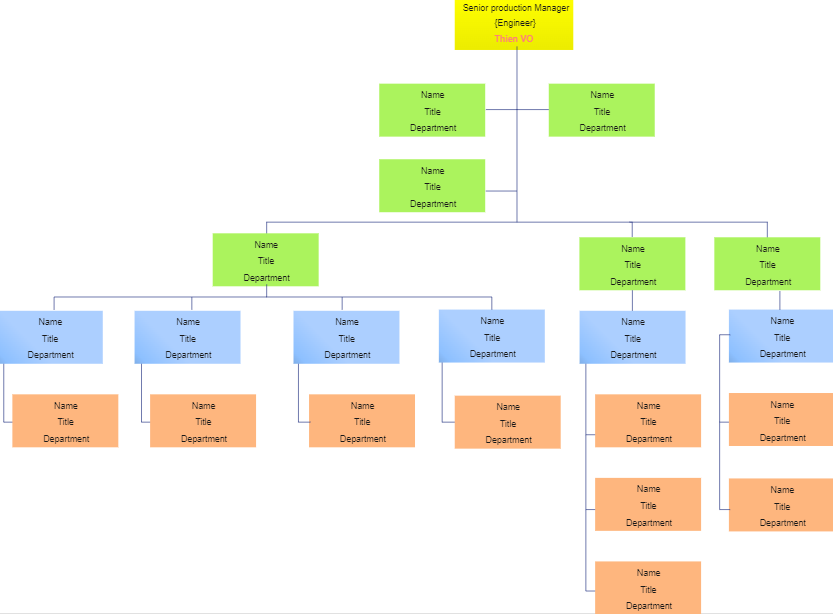
A Manufacturing Company Organizational Chart is a visual representation of the hierarchical structure within a manufacturing firm. It outlines the roles, responsibilities, and relationships between different departments, teams, and personnel. This chart provides a clear overview of the chain of command, from top-level executives to frontline workers. It helps employees understand their positions and who they report to, facilitating smoother communication and workflow.
Additionally, it aids in decision-making processes and allows for effective delegation of tasks, ultimately contributing to the company's overall efficiency and productivity.
Part 2. Types of Organization Chart
In understanding Manufacturing Company Organization Charts, it's crucial to explore the various types that exist. These charts come in different formats, each tailored to specific organizational structures and objectives. Here are the key types to consider in a manufacturing organizational structure:
- Hierarchical Chart: Illustrates a clear chain of command from top management to lower-level employees.
- Matrix Chart: Depicts both functional and project-based reporting relationships, ideal for complex organizations.
- Flat Organizational Chart: Emphasizes a more egalitarian structure with fewer hierarchical levels.
- Divisional Chart: Organizes departments based on products, services, or geographical locations.
- Team-based Chart: Focuses on collaborative teams rather than individual roles.
- Circular Chart: This represents a non-hierarchical structure with equal importance given to all positions.
Part 3. Key Benefits of Using Organizational Charts:
Implementing Organizational Charts in a manufacturing company offers a range of invaluable advantages, enhancing both efficiency and clarity. Here are the key benefits to consider:"
- Clear Communication: Defines roles and reporting lines, reducing confusion.
- Improved Workflow: Streamlines processes and tasks for smoother operations.
- Facilitates Decision-Making: Enables quicker, more informed choices by visualizing the structure.
- Identifies Redundancies: Helps spot areas for consolidation or restructuring, optimizing resources.
- Encourages Accountability: Clearly outlines responsibilities, promoting ownership of tasks.
- Supports Growth: Easily adaptable to accommodate new hires or changes in structure.
- Enhances Employee Morale: Provides a sense of direction and purpose within the organization.
Part 4. How Factories Can Benefit From Organizational Charts
Utilizing Organizational Charts in factories yields a myriad of benefits, streamlining operations and fostering a more productive work environment.
Here's how factories can harness these advantages:
1. Clear Hierarchy and Reporting Lines:
Organizational charts establish a visual hierarchy, making it easy for employees to understand their positions and who they report to. This clarity reduces confusion and ensures a smooth flow of information within the factory.
2. Efficient Communication:
By defining reporting relationships, organizational charts facilitate seamless communication. Employees know whom to contact for specific issues or updates, reducing delays and enhancing overall operational efficiency.
3. Resource Allocation:
With a clear view of each department's structure and responsibilities, factories can allocate resources more effectively. This prevents overloading certain areas while others remain underutilized, leading to optimized productivity.
4. Workforce Planning:
Organizational charts assist in strategic workforce planning. They provide insights into the distribution of skills and expertise across different departments, aiding in recruitment efforts and identifying areas for training and development. This ensures that the factory has the right talent in the right places.
5. Streamlined Decision-Making:
Organizational charts empower management with a visual representation of the hierarchy. This aids in quicker, more informed decision-making, as it's easy to identify the relevant stakeholders for specific matters. It eliminates bottlenecks and ensures that decisions are made by the appropriate individuals or teams.
Part 5. Creating a Manufacturing Company Org Chart with EdrawMax
EdrawMax stands out as an indispensable tool for crafting organizational charts in manufacturing companies. Its significance lies in its ability to simplify and streamline what can otherwise be a complex process. Unlike conventional methods, EdrawMax offers a user-friendly interface, making it accessible even for those without advanced design skills.
You can opt for EdrawMax for several compelling reasons. Firstly, its extensive library of pre-designed templates and shapes specifically caters to manufacturing industry needs. This saves valuable time and effort in creating a customized organizational chart from scratch. Furthermore, EdrawMax's intuitive drag-and-drop functionality empowers users to effortlessly add, rearrange, and connect elements within the chart.
Here are the steps to create a simple manufacturing org chart using EdrawMax:
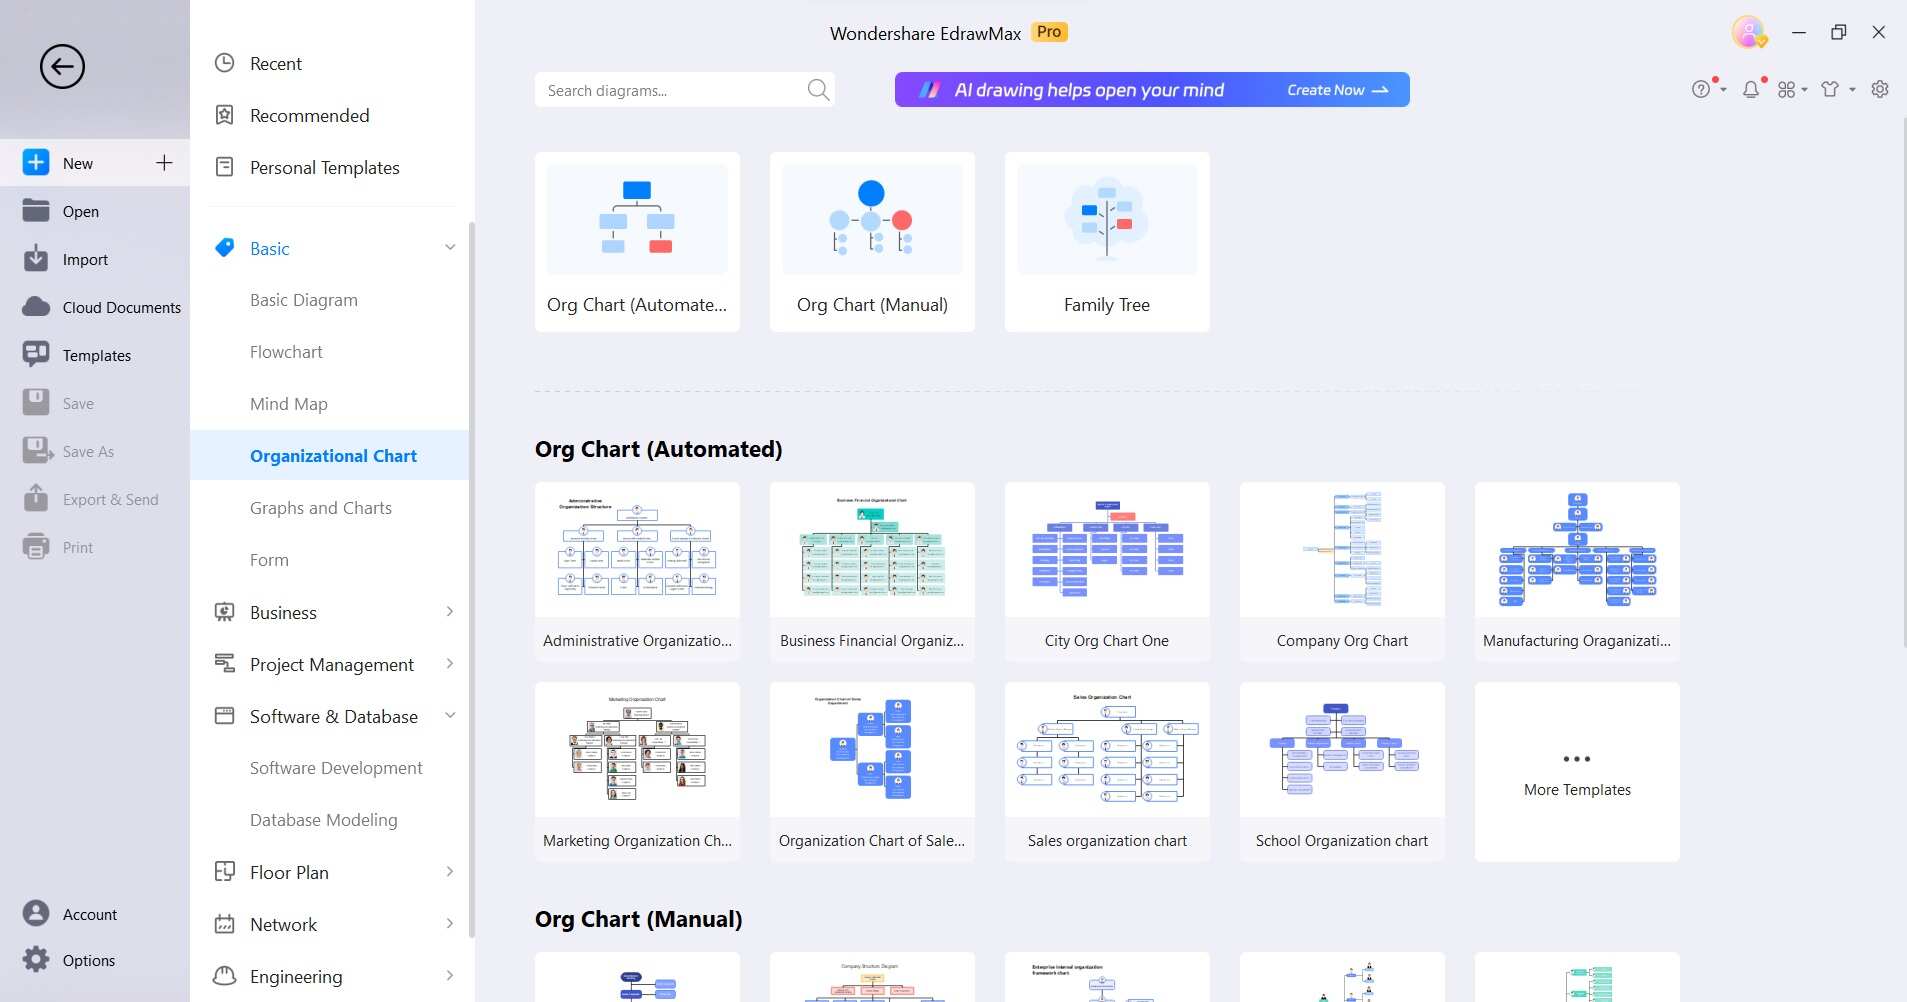
Step 1: Open EdrawMax and select the "Organizational Chart" category. Choose a template that suits your manufacturing company's structure.
Step 2: Drag and drop the various position shapes onto the canvas. Label each shape with the respective job title (e.g., CEO, Production Manager, Supervisor, etc.).
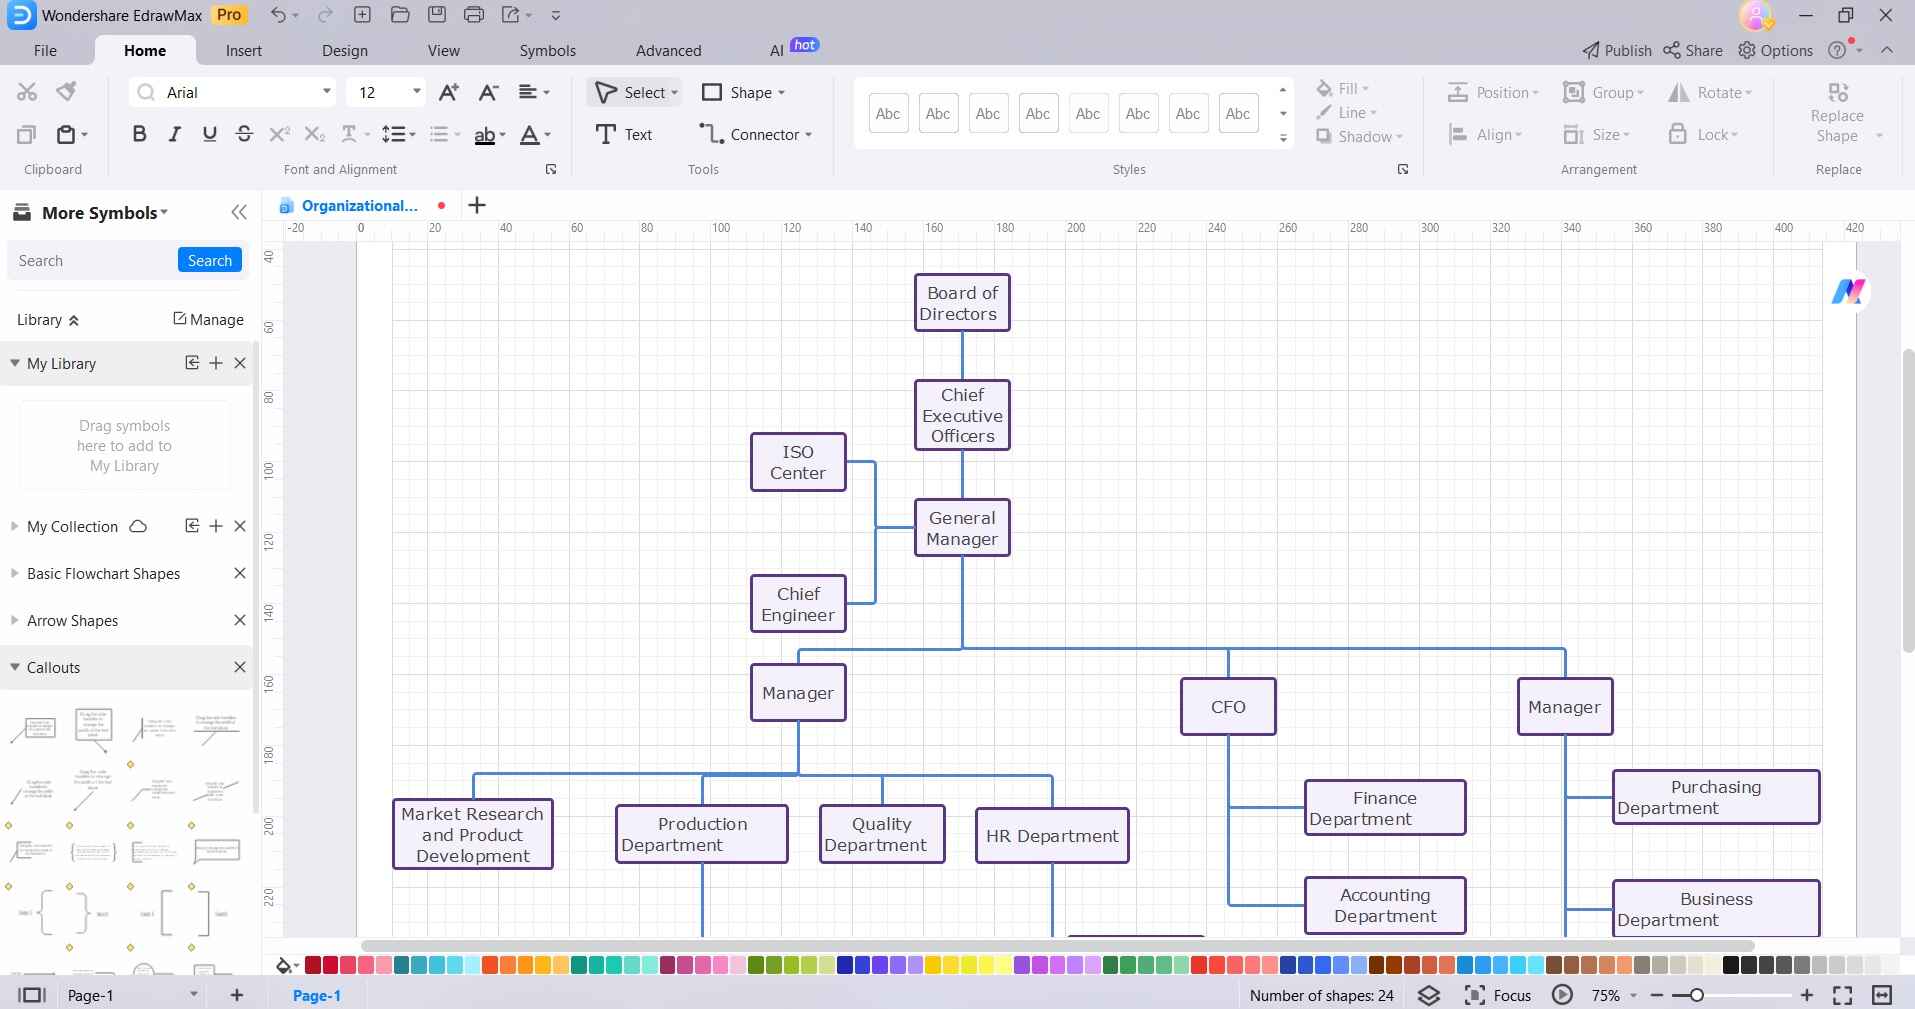
Step 3: Use connector lines to link the positions based on their reporting relationships. Ensure the lines are clear and well-organized to depict the hierarchy accurately.
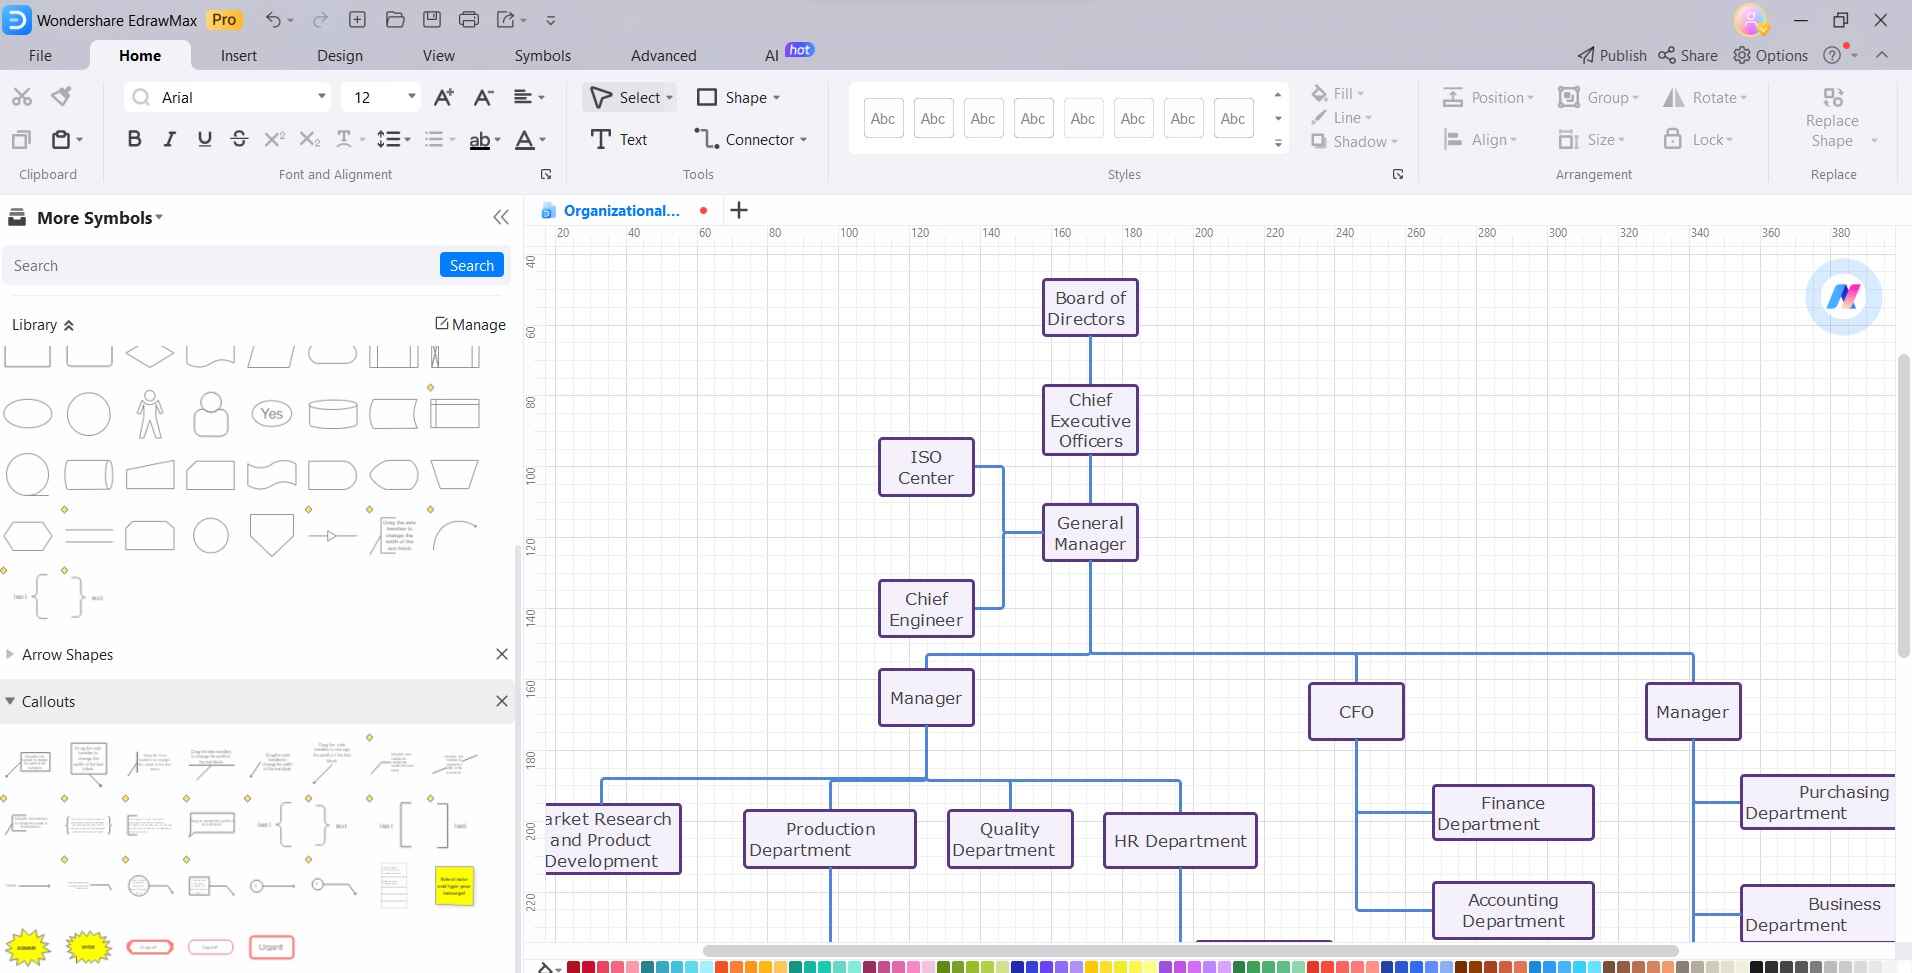
Step 4: Customize the shapes and lines to fit your company's visual style. You can change colors, fonts, and line styles to enhance clarity and aesthetics.
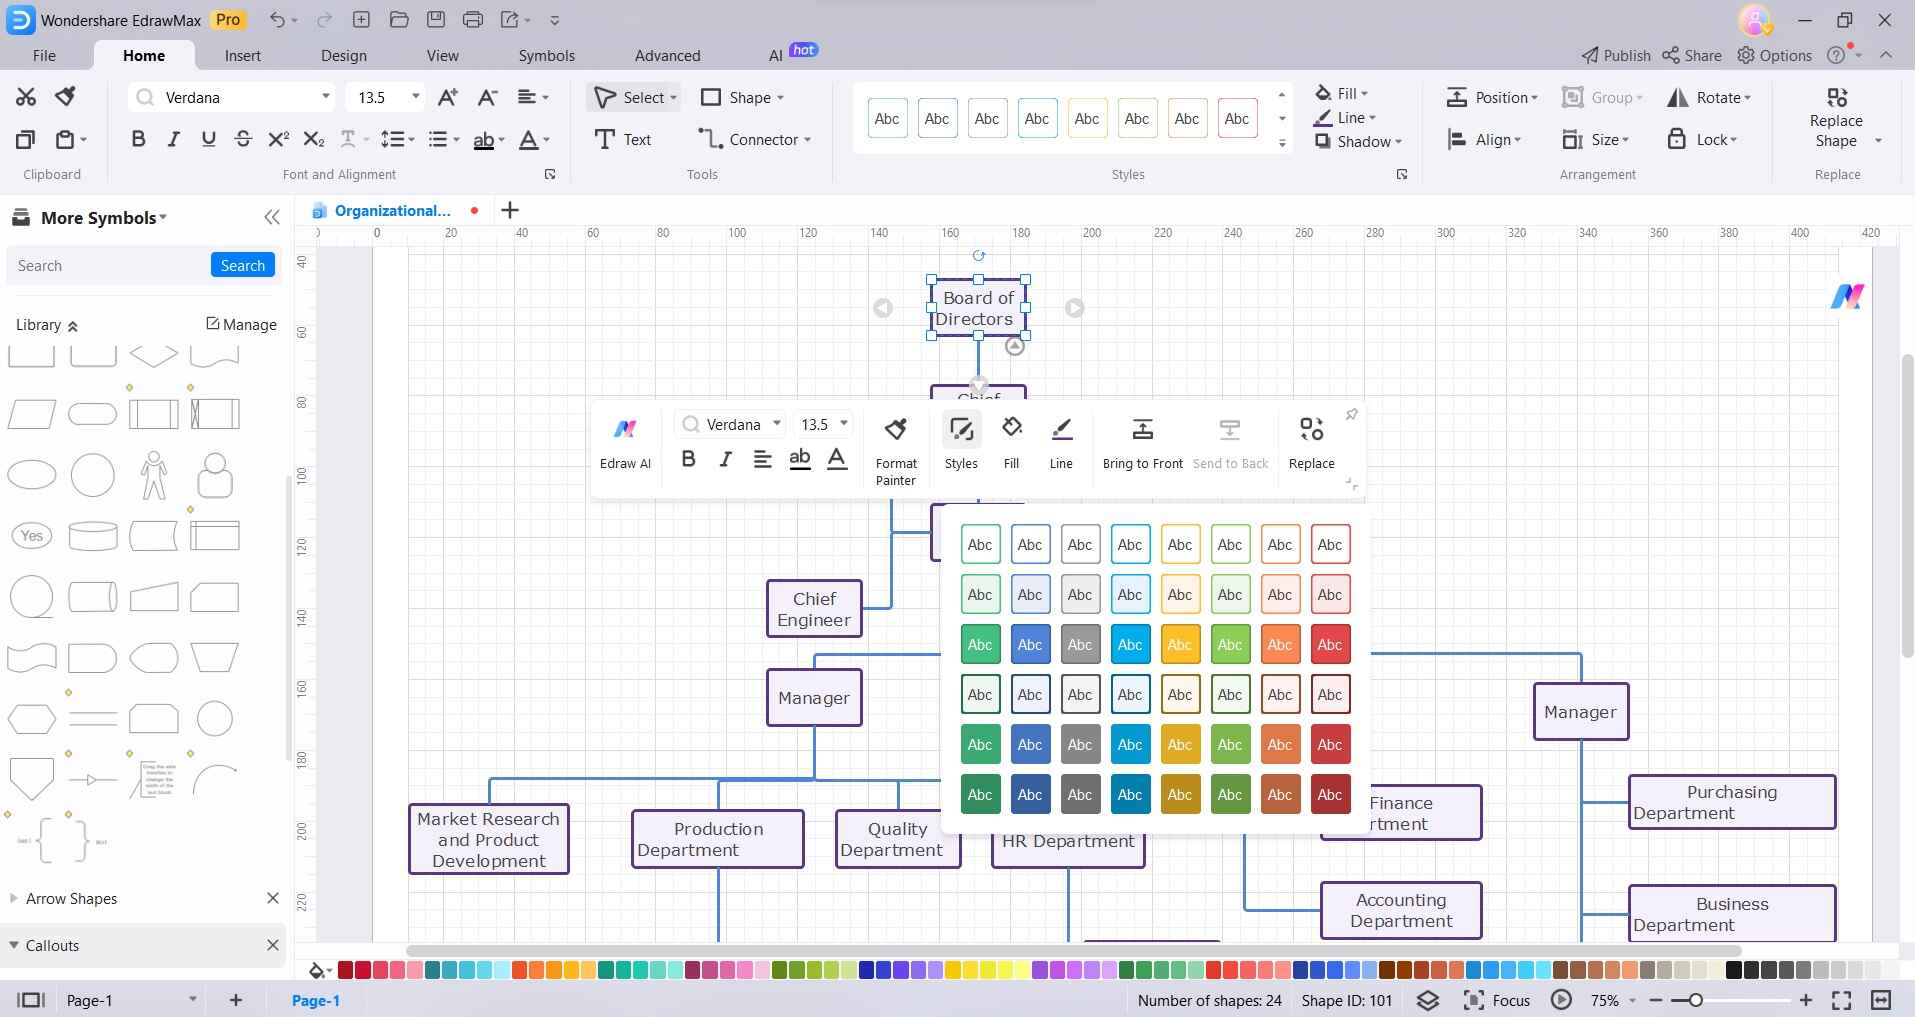
Step 5: Within each shape, add the names of the employees occupying those positions. This provides a personal touch and aids in identification.
Step 6: Navigate to File> Save. Save your org chart in a preferred format (e.g., PNG, PDF) to retain a digital copy.
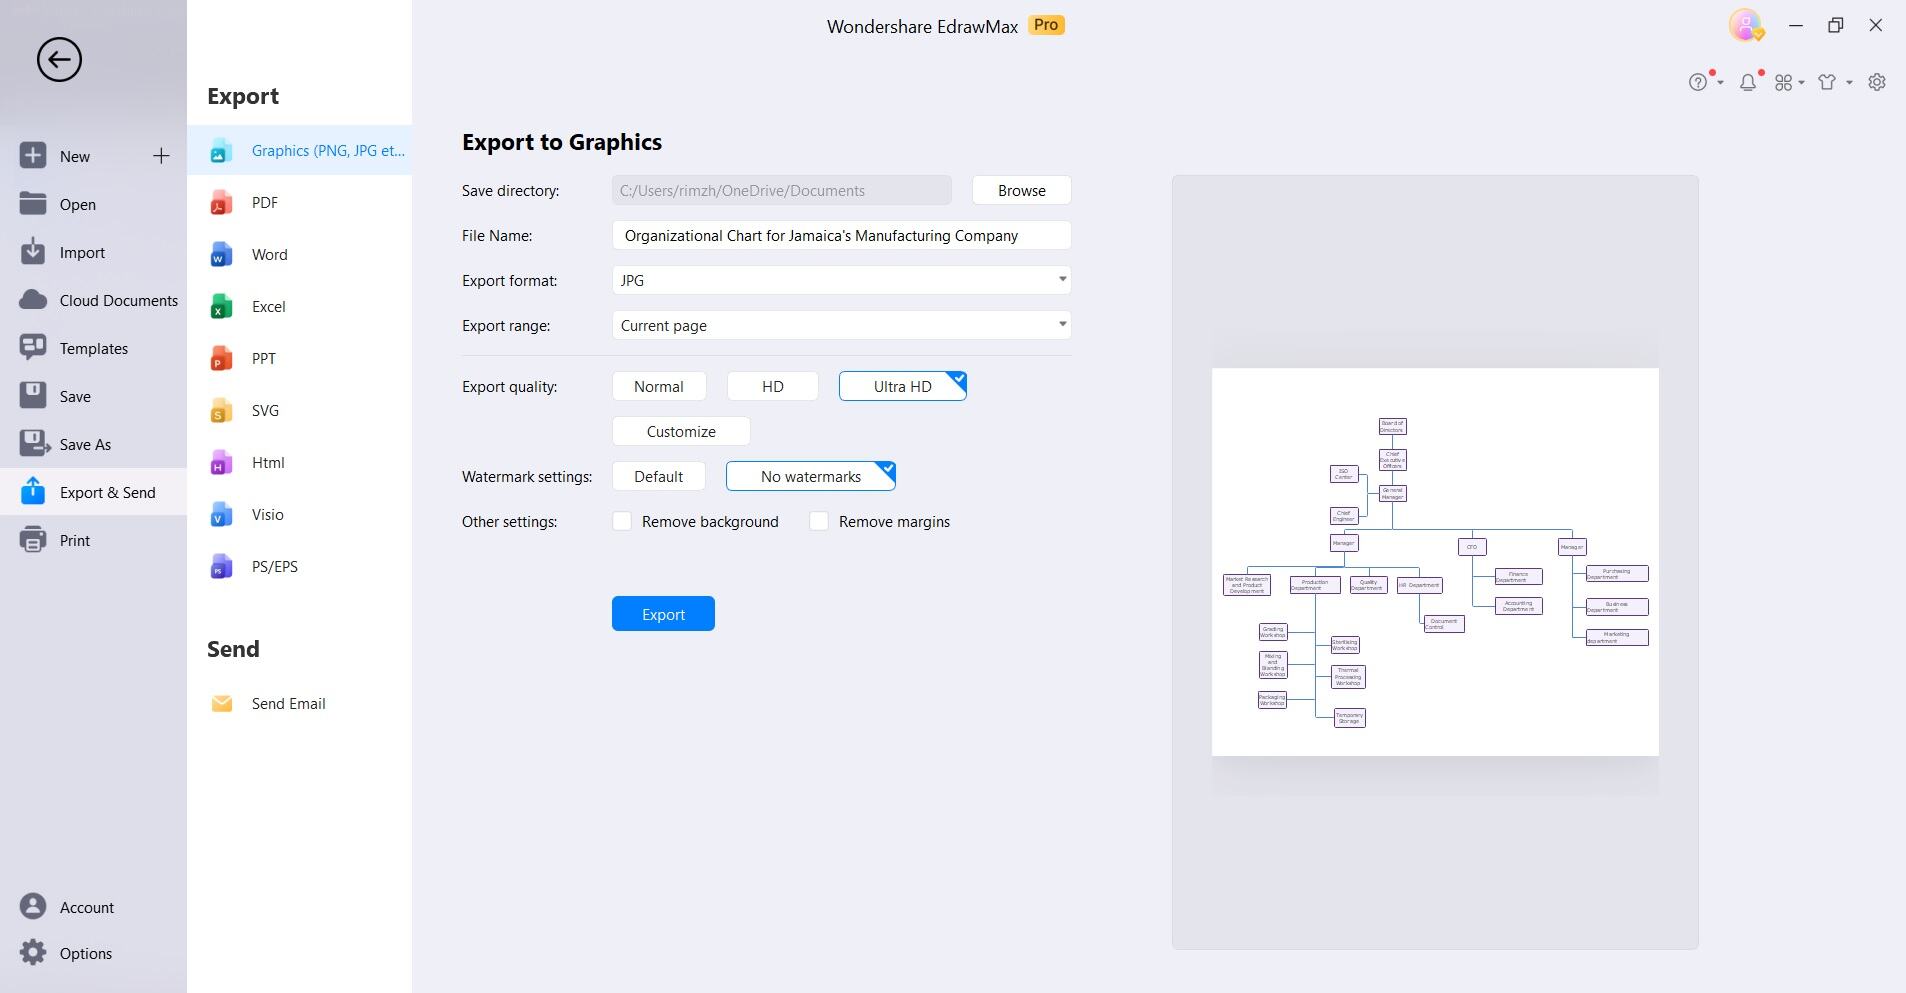
NOTE: As your manufacturing company evolves, regularly revisit and update the org chart to reflect any changes in personnel or organizational structure.
By following these steps, you'll have created a clear and concise factory organizational chart for your company using EdrawMax.
Conclusion
In conclusion, leveraging EdrawMax to design a manufacturing company organizational chart proves to be a game-changer. Its user-friendly interface, extensive template library, and intuitive customization options streamline the process significantly. With clear reporting lines and easily identifiable positions, communication and decision-making within the company become more efficient. The ability to update and refine the chart ensures its relevance in dynamic organizational environments.
Ultimately, EdrawMax empowers manufacturing firms to establish a visual framework that enhances productivity, fosters collaboration, and facilitates growth in today's competitive business landscape.


